
Abstract
Purpose
Despite the atheroprone environment of blood flow in coronary bifurcations, limited quantitative information is available on the hemodynamics occurring in these geometries, both before and after their treatment with endovascular stents. Previous studies have focused on computational fluid dynamics (CFD) analyses and have bypassed the challenges associated with experimentally representing the flow environment, providing no means for validation. This study analyzed steady flow conditions in 3 bifurcation angles and 4 different single- and double-stenting procedures, which are used clinically in coronary bifurcations.
Methods
The numerical aspect of this study utilized geometries derived from CAD models (nonstented cases) and finite element simulations (stented cases). Digital particle image velocimetry (DPIV) testing was conducted within compliant bifurcating models for which an uncertainty analysis was performed at each measurement location for CFD validation purposes. Results were analyzed in terms of velocity magnitude contour maps and axial velocity profiles at several locations in the bifurcated vessels.
Results and Conclusions
Qualitatively, the 2 approaches showed agreement in the bulk flow patterns. However, the velocity computed with CFD was outside the DPIV uncertainty estimates, which can be attributed to the intrinsic difference and modeling assumptions of the 2 approaches. The findings reveal that wider bifurcation angles and double-stenting procedures are both characterized by increased areas of low flow and recirculation. Additionally, inferior performance in terms of viscous and wall shear stresses was observed in double-stented cases.
Keywords
Introduction
Coronary stenting is the most common treatment to restore blood flow in atherosclerotic coronary arteries. Despite the high rate of occurrence of this procedure, failures associated with hemodynamic alterations from vascular stenting, including in-stent restenosis and late thrombosis, have yet to be overcome (1, 2). Improvements in validation techniques for interventional strategies and medical device designs are necessary to surpass these shortcomings by expanding our understanding of these biomechanical environments. Unfortunately, current in vivo imaging systems are not able to provide accurate quantitative information on coronary stented arteries in terms of 3D stent deformations, velocity measurements or arterial stresses occurring during the intervention. Consequently, in vitro experiments and numerical models have become essential and widely adopted tools in this field (3).
Numerical methods such as finite element models or computational fluid dynamics (CFD) utilize mathematical modeling of medical devices and biological tissues to determine the mutual interactions of these components in terms of deformations, stresses and resultant flow fields that occur throughout simulations (4-5-6). However, numerical models are often sensitive to assumptions including those regarding the geometry, mechanical behavior and boundary conditions of the system, and therefore need to be accurately verified and validated with in vivo or in vitro measurements to increase the reliability of results. This process may be challenging, especially in complex biological systems (7) such as stented arteries.
Alternatively, in vitro bench testing typically consists of the physical deployment of stents in synthetic arterial models. Micro-CT systems may be used to quantify stent deformations (8), while flow measurement techniques, such as digital particle image velocimetry (DPIV), can provide hydrodynamic analyses (9-10-11). Such techniques are widely accepted in the interventional cardiology community, as they have been used extensively and successfully, having demonstrated their ability to achieve realistic deployments and deliver high-fidelity measurements. However, in vitro experiments often entail high levels of technical expertise and costly equipment to prepare complex experimental setups, and consequently, a low number of studies have included both experimental and numerical methodologies (12-13-14-15), despite the shortcomings of each standalone method.
This study aimed to compare local flow patterns resulting from steady flow in stented and nonstented coronary bifurcation models using DPIV (9, 10) and numerical (16) methods. In doing so, this paper outlines a methodology for performing each standalone method, as well as a means for comparison between the techniques by providing measurement uncertainty for DPIV velocity estimates. To the authors’ knowledge, this is the first published in vitro investigation using DPIV to quantify flow in stented bifurcating vessels. A total of 4 different stenting techniques and 3 bifurcation angles were investigated using DPIV and CFD to determine each method's ability to quantify the influence of stenting procedures and bifurcation angles on flow environments. The results demonstrated the negative hemodynamic influence of higher side branch (SB) angles and double-stenting procedures. Ultimately, this work highlights the inherent differences between the current experimental and numerical methodologies used to assess complex biomechanical problems such as stenting procedures. These differences prevent the straightforward quantitative comparison necessary for complete validation of CFD with DPIV measurements, but do provide valuable qualitative evaluations.
Materials and Methods
Experimental methods
Stented and nonstented bifurcated silicone models
Bifurcating synthetic models with SBs angled at 30°, 60° and 90° were fabricated through a casting process using polydimethylsiloxane (PDMS; Dow Corning Sylgard 184) at a mixture ratio of 1:10, resulting in a modulus of elasticity of approximately 1.0 MPa, to approximate physiologically observed arterial compliance (9). The lumens of each model were created using 3.96 mm (main branch [MB]) and 2.77 mm (SB) steel rods that were fitted together at different angles through an inset hole on the larger rod and centered in a casting mold resulting in a 0.4 mm wall thickness. Only models with uniform wall thickness and without bubble defects were used, to ensure uniform compliance and optical clarity for DPIV purposes. The branches of resulting arterial models had constant and straight lumen diameters, as well as uniform wall thickness, which differ from physiologically observed tapered and curved arteries.
Commercially available Endeavor Resolute stents (Medtronic, USA) were implanted into 4 synthetic 60° bifurcated models by an interventional cardiologist using 4 different stenting techniques (Fig. 1). Angioplasty balloons with diameters of 4.0 mm and 3.0 mm were used in the MB and SB, respectively. The 4 techniques (17) investigated herein were:
Provisional side branch (PSB): A stent is deployed in the MB, followed by a final kissing balloon (FKB) inflation to create an opening in the stent for SB flow.
Crush technique (CRU): First, a stent is deployed in the SB with one third of the stent protruding into the MB. Second, a balloon is inflated in the MB outside of the previously placed stent, and it acts to crush the SB stent against the wall of the vessel. Finally, a second stent is deployed in the MB, and the technique ends with a FKB inflation to reopen the lumens of the MB and SB.
Culotte technique (CUL): A stent is deployed in the SB with a high protrusion into the proximal region of the MB. Next, a balloon is inflated in the MB through the SB stent struts, which is used to reopen the lumen of the MB. This opening allows access for a second stent to be implanted within the MB, and finally, a FKB inflation is performed to reopen MB and SB lumens. High overlap of the 2 stents occurs in the proximal MB.
T stenting technique with high protrusion (T-PR): After performing PSB stenting, a second stent is implanted in the SB with a section of the stent protruding into the MB.
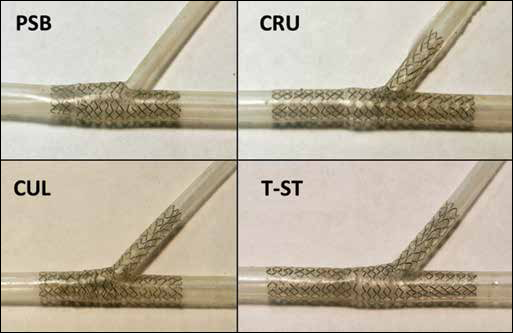
In vitro bench testing of stenting procedures in the fabricated silicone bifurcation models. Top left, provisional side branch (PSB) stenting; top right, crush technique (CRU); bottom left, culotte technique (CUL); bottom right, T-stenting technique with high protrusion (T-PR) in the main branch (MB).
Flow loop replicating a steady flow
The flow loop shown in Figure 2 and described in Charonko et al (9) was used to recreate a steady flow condition, and modified to account for the presence of a bifurcation. Resistive elements were placed downstream of the bifurcation model, to control the ratio of flow rates between the MB and SB. Pressure was measured at the inlet of the model, while flow rates were measured upstream and downstream of the model using an ultrasonic flow meter. A 60%-40% water-glycerine mixture was used as a blood analog to approximate physiological kinematic viscosity (3.77x10⁻⁶ m2/s). This fluid also filled the test section, and matched the refractive index of the vessel walls, to reduce optical distortions and light reflections at the vessel walls. Components of the setup were adjusted to obtain a constant flow rate at the bifurcation inlet with an 84/16 flow split between MB and SB. Pressure conditions were maintained at approximately 100 mmHg.
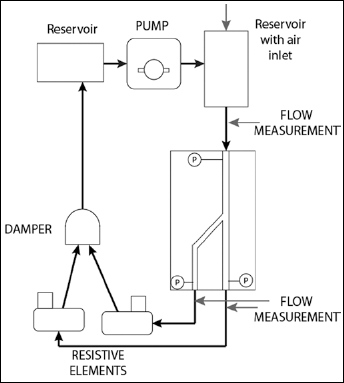
Schematic depiction of the flow loop developed by Charonko et al (9) modified to examine steady flow cases with a bifurcated region of interest. Resistive elements were placed downstream of the bifurcation model to control the ratio of flow rates between the main branch (MB) and the side branch (SB).
Digital particle image velocimetry methods
DPIV was performed using a high-speed intensified camera (IDT Xs-5i) with an Nd-YAG laser, and 7-μm fluorescent particles were used for flow tracers. A double pulse strategy was adopted to acquire image pairs with a separation time of 200 µs and a sampling frequency of 250 Hz resulting in a peak particle displacement of approximately 8 pixels. For each set of data, a total of 2,000 images were acquired, corresponding to an acquisition time of 4 seconds. The field of view for this study was chosen to visualize flow patterns in the majority of the stented region of the arterial model resulting in spatial resolution of 7.33 µm/pixel for stented and 4.78 µm/pixel for unstented cases. The absence of the stent in the latter case allowed for higher magnification, although the length of the vessel imaged in the field of view was reduced. DPIV was performed for each stenting technique in 60° bifurcation models as well as in the 3 nonstented bifurcating models of varying bifurcation angles, resulting in a total of 7 cases. For stented cases, stent struts visually blocked several areas in the flow, resulting in dark regions without particles, which provided no contributions to the correlation. Velocity measurements were not available at these locations, and for analysis purposes stented regions of the velocity fields were masked and excluded from the data analysis after processing was performed. Because masking was performed after DPIV processing, this procedure did not influence results.
DPIV processing was conducted using Prana (http://sourceforge.net/projects/qi-tools/), an in-house software program allowing for ensemble correlation processing (18) using the robust phase correlation (RPC) (19-20-21). The processing method employed included discrete window offset (22) coupled with a window deformation scheme (23). Processing methods using window deformation are useful for near wall measurements due to shear at these locations, and they serve to deform the image window based on the local velocities computed in the previous processing passes. Ensemble correlation processing can be performed in steady flow conditions to improve measurement accuracy in noisy data by averaging DPIV correlations in time (18, 24). Gaussian windowing is applied to remove aliasing from finite window sizes (20).
Prior to DPIV processing, a median image subtraction was performed to remove background illumination. Next, ensemble correlation processing was conducted on 1,000 image pairs for 2 passes. The initial pass used a window resolution of 32x32 pixels with an 8-pixel grid resolution, and the second pass used a window resolution of 8x8 pixels with a 2-pixel grid resolution. Both passes were iterated 2 times and a Gaussian filter was used to smooth measurements after each iteration, as is typical for deformable window schemes. Additionally, the universal outlier detection scheme (25) was used to identify erroneous vectors after each pass using a 3x3 vector neighborhood.
Ninety-five percent uncertainty bounds for the measured velocity fields were computed following methods outlined by Charonko et al (26). Conventional DPIV experiments often report an error of 0.1 pixels. However, this representation is often misleading as error is defined as a deviation from the true value, which is unknown in most circumstances (27). Alternatively, the uncertainty (systematic and random) is estimated from the cross-correlation peak ratios (the ratio of the primary to secondary peaks) as opposed to isolating each source of uncertainty. The correlation peak ratio has been shown to be a reliable method for outlier detection in standard cross correlation processing as well as an evaluation parameter for signal to noise ratio (SNR) and detectability (28, 29). Performing uncertainty analysis in such a way allows for the inclusion of sources of error such as instantaneous particle image patterns, as well as image quality, sparse seeding and high velocity gradients, which are common problems when investigating flow systems on this length scale. Additionally, this method produces independent uncertainty bounds for each velocity estimate, thus allowing for CFD comparisons at each measurement location rather than 1 confidence interval for the entire field. Using this method, uncertainty can be estimated for RPC processing using the ratio of the correlation peaks such that,
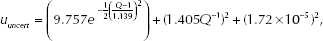
where Q is the ratio of the highest to the second highest peak in the correlation. Additional uncertainties due to magnification and acquisition timing were estimated from calibration images and timing system specifications, respectively. Propagation of uncertainty was performed using Taylor series expansion with uncertainty contributions from DPIV correlation, image magnification and acquisition timing to determine the overall reported uncertainty value.
Numerical methods
Numerical replica of stenting procedures
The 7 cases studied by means of DPIV experiments were subsequently simulated via numerical methods. A CAD model of the 60° silicone bifurcation was built using the commercial software Rhinoceros 4.0 Evaluation (McNeel and Associates, Indianapolis, IN, USA) to reflect the geometrical features of the bench-top models in terms of bifurcation angle, internal diameters and wall thickness. The bifurcation was then discretized with 112,720 reduced integration C3D8R hexahedral elements, and the mechanical behavior was described as a linear elastic material with a Young modulus and a Poisson coefficient equal to 1 MPa and 0.3, respectively.
Stent models resembled the commercial devices Endeavor Resolute (Medtronic, USA) used in the in vitro bench tests, which have struts of circular cross-section with a diameter of 91 µm. Before deployment, stents had an external nominal diameter of 1.6 mm and a length of 15 mm and were expanded with 4 mm and 3 mm balloons in the MB and SB, respectively. The device meshes resulted in a total of 272,384 reduced integration hexahedral elements. Stents were constructed of a cobalt-chromium alloy that was described through a Von Mises-Hill plasticity model with isotropic hardening and the following properties: 233 GPa, 0.35, 414 MPa, 933 MPa and 44.5% in terms of Young modulus, Poisson coefficient, yield stress, stress and deformation at break, respectively (30).
Explicit dynamics finite element models were implemented in Abaqus/Explicit (v. 6.10; Dassault Systemes Simulia Corp, Warwick, RI, USA) to replicate the 4 stenting procedures. More details on these models can be found in Gastaldi et al (31) or Morlacchi et al (16). Despite the general similarity between how stents were deployed in the physical models and in finite element modeling, some differences existed and are described in the limitations section of the “Discussion”. Lastly, since the double-stenting procedures examined here (CUL, CRU and T-PR) involved the deployment of bent devices in the SB, the stents underwent preliminary simulations of crimping and bending in order to be correctly positioned in the bifurcated geometries and maintain the history of stress modifications (32).
Fluid dynamic simulations
The fluid volumes of the 3 nonstented bifurcations with 30°, 60° and 90° were created by means of CAD software to replicate the fabricated silicone models (Fig. 3, left). A structured fully hexahedral mesh was then created with approximately 350,000 elements for the 30°, 60° and 90° bifurcation models. An O-grid was used to discretize the circular section of the vessel with a total of 880 elements, thus enhancing the general quality of the grid at the boundary layers while mesh size was decreased in the bifurcation area. The mesh quality was numerically verified by means of a sensitivity analysis, which indicated that by halving the mesh size, the difference among velocity predictions remained below 1.1% in all cases.
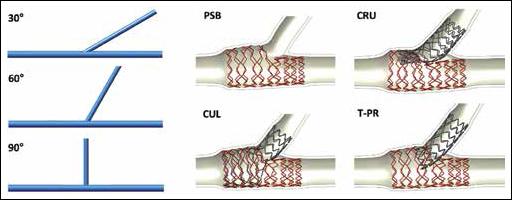
Geometrical configurations of the 7 cases used for computational fluid dynamics (CFD) analyses. On the left: CAD geometries replicating the nonstented 30°, 60° and 90° bifurcations. On the right: outcome of the structural simulations of the 4 stenting procedures investigated. Top left, provisional side branch (PSB) stenting; top right, crush technique (CRU); bottom left, culotte technique (CUL); bottom right, T-stenting technique with high protrusion (T-PR) in the main branch (MB).
Alternatively, for stented cases, the geometrical configurations of the stents and vessels after the structural simulations (Fig. 3, right), were used to define the fluid domain (16). A hybrid meshing method composed of hexahedral elements for the core and tetrahedron for the surface was implemented to obtain a computationally efficient calculation grid. Mesh size was chosen in accordance to the sensitivity study on wall shear stress (WSS) values presented in Chiastra et al (33) and resulted in meshes ranging between 2,331,624 elements for the PSB case (1 stent) and 5,081,720 elements for the CUL case (2 stents).
Steady state simulations were carried out by means of the ANSYS/Fluent commercial software using a parabolic velocity profile at the inlet and a constant flow split as outlet condition to replicate the experimental conditions. Specifically, an 85 ml/min inflow was divided with a 84/16 split in the MB and SB. The working fluid was modeled as a Newtonian fluid with viscosity of 3.77x10⁻⁶ m2/s and a density equal to 1,100 kg/m3. A coupled solver was used with a second-order upwind scheme for the momentum spatial discretization. Under-relaxation factors of 0.3 were applied for the pressure and momentum, and a factor of 1 was applied for the density. The convergence criterion for continuity and velocity residuals was set to 10−6.
Results
Velocity magnitude fields for the stented cases are shown in Figure 4. For nonstented cases, experimental and computational velocity fields displayed similarities in flow patterns and structures. Specifically, the locations, sizes and shapes of recirculation regions were similar between the 2 methods (results not shown).
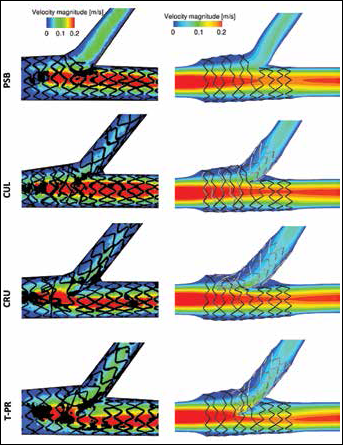
Velocity magnitude fields in m/s in the transversal plane of the 4 stented models. From top to bottom: provisional side branch (PSB) stenting, culotte technique (CUL), crush technique (CRU), and T-stenting technique with high protrusion (T-PR). The experimental digital particle image velocimetry (DPIV) measurements are shown on the left, while the computational fluid dynamics (CFD) numerical results are reported on the right.
Stented cases showed similarities between the 2 investigation methods. For the PSB case, which did not include a stented SB, a smaller low flow region was visible in the SB, in comparison with the other stenting procedures. Additionally, results for double-stented cases (CUL, CRU, T-PR) showed flow pattern variation in the distal MB which was manifested as low flow regions protruding inward toward the centerline of the MB and following the distal surface of the SB stent. This pattern was most obvious in the T-PR case where the SB stent significantly protruded into the MB lumen. Several differences were also visible between experimental and computational results. First, for experimental cases the field of view contained only stented regions of the bifurcation, whereas CFD cases showed the transitions between stented and unstented regions of the vessel. For this reason, CFD results showed a decrease in MB velocity over the stented length of the vessel, followed by a recovery of velocity just after the stented portion of the vessel. This decrease and recovery of velocity can be explained by an overexpansion of the stent, which is typical for stenting procedures.
Axial velocity profiles at the SB entrance are shown in Figure 5 to quantitatively investigate the influence of bifurcation angles. Both investigation methods showed similarly shaped profiles indicating a growth in recirculation area and maximum velocity magnitude for increasing bifurcation angle. Finally, for the T-PR case, velocity magnitude profiles in different locations of the MB and SB are shown in Figure 6. A comparison between numerical and experimental values is reported in the figures, and similar profiles are observed between investigation methods. At the proximal MB location, profiles resembled Poiseuille flow. However, at the first distal MB location, the velocity profile became skewed due to a low flow region caused by the SB stent protruding into the MB lumen. Further downstream, the profile skewness was reduced and the velocity returned to a Poiseuille shape.
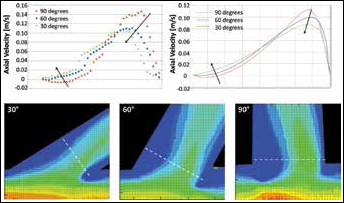
Top: Axial velocity profiles at the side branch (SB) take-off in the 3 nonstented cases characterized by a bifurcation angle equal to 90° (red), 60° (blue) and 30° (green). Values were measured at the cross-section where the maximal axial velocity was found. The influence of the bifurcation angles in terms of reduction of the peak velocity and recirculation is clear in both the numerical (right) and experimental (left) charts. Bottom: Magnified view of recirculation areas in the SB measured by means of digital particle image velocimetry (DPIV). Dotted white lines represent the cross-section where axial velocity profiles were extracted.
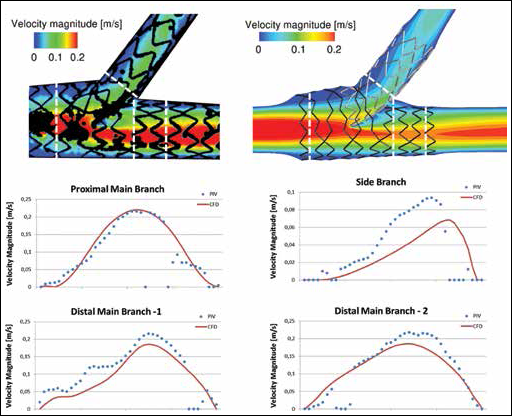
Velocity magnitude profiles measured at 4 cross-sectional locations (black arrows) of the T-stenting technique with high protrusion (T-PR) case for experimental (blue dots) and numerical (red line) studies. Cross-sectional locations are highlighted in the contours of the top panel with white dashed lines. Distal Main Branch-1 was located proximal to Distal Main Branch-2.
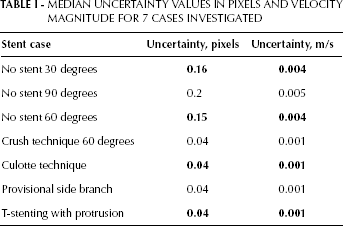
The 95% uncertainty fields for the T-PR technique and the 60° nonstented case are seen in Figure 7. Regions of elevated uncertainty existed in the MB at high-velocity locations, which was consistent with the other data cases. Additionally, increased uncertainty was visible in several small circular regions within the vessel. This increase was due to optical artifacts, which hindered visibility at these locations but did not affect flow inside the model. For brevity, the median uncertainty values of the velocity field for each case are listed in Table I. Larger median uncertainty values were observed for nonstented cases due to the change in spatial resolution.
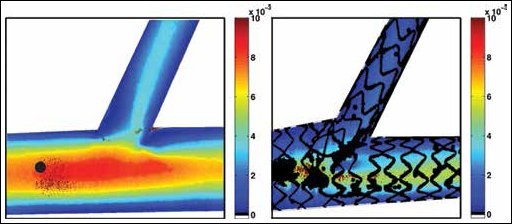
Velocity uncertainty in m/s for the 60° non-stented case and the T-PR technique. Problematic regions exist in the MB at high velocity locations, which is consistent for other data cases.
MEDIAN UNCERTAINTY VALUES IN PIXELS AND VELOCITY MAGNITUDE FOR 7 CASES INVESTIGATED
To better examine the influence of the stenting procedures on the bulk flow, the in-plane viscous shear stress (VSS) was calculated and reported in Figure 8 for the numerical cases and is defined as:
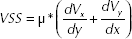
where µ is the dynamic viscosity of the fluid, while Vx and Vy are the velocities in the principal directions of the transversal plane. For all stent procedures, an increase in VSS magnitude was seen along the vessel wall distal to the bifurcation. Additionally, procedures using multiple stents also displayed high VSS magnitude values along the region of the SB protruding into the MB lumen. This result was most obvious for the T-PR case, which displayed larger regions of high VSS magnitude in the area of the protruding stent. Finally, moderate to high VSS values were seen at the entrance of the SB for each of the stent procedures. Specifically, the PSB procedure, which did not use SB stenting, displayed higher VSS values at this location in comparison with the cases using SB stenting.
In-plane viscous shear stress (VSS) fields of the numerical results calculated in the transversal plane of the 4 stented cases. To better visualize fluid structures at different scales, VSS color scale values are bounded between -0.05 and 0.05 Pa. Viscous shear stress is increased by approximately one order of magnitude in regions with close proximity to stent struts. PSB = provisional side branch stenting; CUL = culotte technique; CRU = crush technique; T-PR = T-stenting technique with high protrusion.
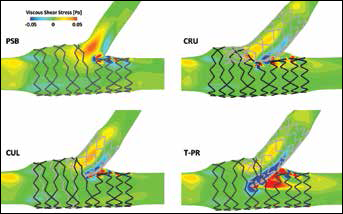
Additionally, WSS was computed for the numerical stented cases and values are reported as area averages in the proximal and distal MB (Fig. 9), where for analysis purposes, the division between these areas was chosen to be the centerline of the SB inlet.
Area averaged wall shear stress (WSS) for proximal, distal and entire main branch (MB) in dynes/cm2. PSB = provisional side branch stenting; CUL = culotte technique; CRU = crush technique; T-PR = T-stenting technique with high protrusion.
For all stenting procedures, WSS was observed to be considerably lower in the proximal region of the MB in comparison with distal areas. This result is to be expected, as proximal regions coincide with the overexpansion of the stents caused by the FKB inflation. Results also indicated the detrimental influence of multiple metallic layers on WSS. For instance, CUL performed the worst in the proximal region for both average WSS as well as at each isolated wall location shown in the line plot. Alternatively, the CRU technique had low WSS values localized to the nearside wall due to the presence of the triple metallic layer. Results for the PSB case indicated moderate averaged values without localized regions of low WSS. Finally, the T-PR case indicated higher WSS values, specifically at the far-side wall and in the distal MB, due to the skewness of the velocity profile shown in Figure 6.
Discussion
DPIV and CFD are commonly adopted in vitro methods used to assess local flow patterns in coronary arteries. Unfortunately, both methods require modeling assumptions that can affect the fidelity of the impending results. However, comparative investigations between the methods can increase the reliability of results and provide an evaluation of CFD models with respect to experimental data under targeted flow conditions.
The 95% uncertainty bounds for velocity computed at each DPIV measurement location serve as a validation metric between experimental and numerical analyses and confirm existing differences between the methods. Typically, the cross-correlation is the primary contributor of uncertainty with respect to other experimental sources in DPIV measurements. However, correlation uncertainty can be reduced for ensemble correlation processing, as performed here, which increases correlation SNRs and peak ratios but requires steady flow conditions. In this work, resulting DPIV uncertainty bounds were low and CFD velocity measurements were observed to fall outside of the velocity range predicted by experimental methods. However, velocity fields presented in Figures 4-5-6, indicated a general good agreement between the experimental and numerical results despite some point-to-point variations related to intrinsic differences of the 2 methods (detailed in the “Study limitations” section). For this reason, the methodologies and analysis presented herein can still bring valuable insight regarding bulk-flow trends of the biomechanical system in question. Specifically, these methods are able to identify regions of low and recirculating flows, conditions which have been associated with localized arterial plaque formation in previous studies (34, 35).
In particular, previous studies have correlated the severity of atherosclerosis with geometric risk factors such as wider SB angles due to the resulting hemodynamic environments (36, 37). In the current work, contour plots of velocity magnitude for DPIV and CFD results (not shown) both indicate larger areas of low velocities occurring in cases with wider SB angles. In addition to geometric risk factors, clinical trials have reported improvements in safety and efficacy for procedures using a single MB stent rather than double-stenting techniques (38). Alterations in hemodynamic quantities are most noticeable in the current study when comparing velocity fields among single- (PSB) and double-stenting procedures (CUL, CRU and T-PR). By observing both the in vitro expansions (Fig. 1) and numerical simulations (Fig. 3), it is apparent that the simultaneous presence of 2 devices in a coronary bifurcation leads to the creation of a metallic carina between the SB and the distal part of the MB, in addition to the presence of a larger number of stent struts at the flow divider. The disturbance created by this geometry is observed in the velocity fields (Fig. 4) as well as VSS (Fig. 8) and WSS (Fig. 7) measurements, which indicate low velocity and WSS as well as high VSS in and around the region of the flow divider. Similar trends are also apparent in the proximal MB after double-stenting procedures due to increases in strut density, thus preventing the recovery of low velocity and WSS behind densely spaced struts.
Within double-stenting procedures, implications of metallic carinas have been reported for in vivo studies, suggesting that the altered geometries are critical in terms of late stent thrombosis (39). In the current work, cases with high protrusion of the SB into the MB lumen (T-PR and CRU) were observed to have problematic regions distal to the metallic carina. For instance, the T-PR case displayed skewed velocity profiles with low flow regions occurring in the MB distal to the SB stent protrusion for experimental and numerical results. The implication of this skewness is the presence of high WSS values on the far-side wall, as well as low WSS distal to the metallic carina on the nearside wall and highly disturbed VSS field. This finding is quantified in the axial velocity profiles presented in Figure 6 and in the WSS and VSS measurements (Fig. 7 and Fig. 8, respectively). Similarly, the CRU case exhibited asymmetrical velocity in the distal MB, but additionally displayed low WSS measurements throughout the MB. Lastly, the CUL technique appeared to be the least critical among the double-stenting procedures in terms of bulk flow quantities, possibly due to the presence of a small protrusion of the SB stent into the MB. However, CUL was characterized by the lowest WSS values in the proximal MB due to an area of high overlapping stents. This occurrence was also visible in the CRU technique where a triple metallic layer was present in the proximal MB, and this correlates to the results proposed by Foin et al (40) who found a higher risk of stent malapposition within double-stenting techniques, especially CRU and CUL techniques.
Study limitations
Both the experimental and computational methods presented herein are subject to some intrinsic limitations and assumptions that must be carefully considered when discussing results and drawing conclusions. These differences prevent an accurate quantitative validation of numerical models with respect to experimental methods, but allow a qualitative comparison, thus increasing the reliability of the results obtained during hemodynamic assessments.
First, the polymeric bifurcation models differ from their numerical replica due to manufacturing inaccuracies and compliance. Specifically, due to the molding/casting process, a small extension of polymer remained confined in the bifurcation area at the connection between the MB and SB.
For experimental methods, analysis was performed with real commercial devices deployed by an experienced interventional cardiologist. Alternatively, numerical models were based on virtual simulations that aimed to replicate the experimental stenting procedures but included imprecisions associated with many numerical studies. For instance, the length of the stent used in the numerical models was reduced to decrease the computational cost of each analysis. Moreover, axial positioning and rotation of the devices was only assumed by visual inspection of the in vitro expansions and may have differ slightly from the experimental stent configuration.
Secondly, the arterial models used for DPIV analysis were compliant to allow for stent deployment and geometric alterations for the various stenting procedures, while a rigid wall boundary condition was assumed for CFD simulations. However, negligible influence on resulting velocity estimations was to be expected from the compliance mismatch due to the steady flow conditions used herein.
In addition to the differences between the experimental and numerical methods, other limitations with regard to the study should be considered. First, only 1 stent design and 1 bifurcation model geometry were analyzed. Due to manufacturing challenges, straight, nontapering vessel branches were fabricated with constant compliance, which differed from physiological coronary bifurcations. Secondly, this study was limited to steady flow to permit ensemble correlation processing and to account for low correlation SNR from poor image quality, sparse seeding and high velocity gradients. Despite the drawback of neglecting pulsatility, the chosen field of view and processing scheme permitted velocity measurements in the majority of the stented bifurcation for a 1-to-1 scale model, as well as high allowable spatial resolution with small DPIV interrogation windows to improve accuracy of bulk-flow measurements. These advancements would be unfeasible with instantaneous correlations.
Conclusion
Several intrinsic fundamental differences between the 2 methodologies, including stent placement, vessel length and modeling approximations, have been discussed and provide rationale for the observed discrepancies. These differences currently prevent the straightforward quantitative comparison necessary for complete validation of CFD with DPIV measurements. However, the results presented underline how both CFD and DPIV analyses are able to capture the main trends of the fluid flows within both the stented and nonstented cases, increasing the reliability of both methods. These findings suggest that the role of hemodynamics before and after stenting procedures might be accurately assessed with both strategies. Nonetheless, both approaches still require a challenging direct validation against in vivo measurements to fully demonstrate their ability to describe the existent hemodynamics of coronary flows from a clinical standpoint.