
Abstract
Purpose
A method for the quantification of handwritten spirals in patients with Parkinson's disease (PD) pre and post levodopa treatment is reported.
Methods
Fifteen PD patients (mean age: 66.80±9.75 years) were assessed in the absence of medication (OFF condition) and under levodopa administration (ON condition). The control group was composed of 15 age-matched healthy (H) individuals (mean age: 63.70±9.40). They were asked to hand draw a spiral at self-selected speed, without resting their forearm on the table. The participants drew on a paper sheet, using a normal pen. The trace of the pen was determined from the 3D coordinates of passive markers placed on the pen and on the sheet, acquired with an optoelectronic system and some parameters were identified and computed.
Results
The method revealed to be significant in highlighting the differences between H and PD subjects and in detecting pharmacologic effect. PD patients are impaired in spiral drawing execution and levodopa improves drawing performance, evidenced by spatio-temporal parameters and velocity profiles.
Conclusions
The protocol is easily employable in clinic analysis because of its simplicity, the short duration of the test, and the natural test conditions. These characteristics suggest the applicability of this protocol to other fields of motor and cognitive assessments.
Introduction
Writing and drawing are the final output of a complex neurologic, psycological, and motor action: diseases and brain injuries therefore leave important traces in the graphic gesture.
The presence of diseases such as Parkinson's disease (PD) (1-5) can be found in the graphical deficits because of motor difficulties; PD symptoms include bradykinesia, tremor, rigidity, reduced manual ability, and loss of accuracy, that are reflected in the graphic performance.
In the literature several studies finalized on the quantification of kinematic alterations in the graphic gesture in patients with PD demonstrate that PD patients are impaired in the execution of automatic movements such as writing and drawing. Kinematic analysis therefore shows that the pathology causes a worsening in the graphic movement execution (1-3).
Spirography is a standard method to test the presence of PD symptoms, such as micrographia (reduction of writing dimensions) or tremor, or to study the strategies adopted by patients in order to partially counter their deficit (4-6). In particular, hand-drawn spirals enable study of micrographia and the motor strategies adopted by the subjects (5,7,8): it was in fact observed that during a spiral hand-drawing task PD subjects tend to increase the spiral radius less compared to healthy subjects, leading to spirals of smaller dimensions (5). In some studies concerning spiral drawing subjects are not allowed to rest the forearm on the table, so that movements can be of larger amplitude. In this way, in fact, both distal and proximal joints are involved, and it is therefore possible to globally study the movement of the upper limb (7-9).
A recent work (8) also suggests that spiral analysis may be more sensitive in detecting early changes in motor performance than the Unified Parkinson's Disease Rating Scale (UPDRS), which is a clinical standard method for PD assessment. The study reveals that spiral execution abnormalities may have the potential to discern pre-clinical disease, and might therefore be considered in a battery of screening tests for at-risk individuals.
The “standard” graphic test used to assess graphic gesture are administered on a sheet, and the analysis of the graphic gesture is visually executed by the graphologist. The acquisition through the “pen and sheet” method involves major limitations in terms of measurement: in particular this method does not enable memorizing the temporal sequence of the graphic signs on the sheet. All the information about the temporal evolution of the graphic signs, such as reaction time and duration, is therefore lost. In the last few years digitizing tablets have been sometimes used instead of the pen and sheet method, which enables computerized analysis of the performance by means of recording pen pressure (1-8). Even if they introduce the possibility for a quantitative analysis the digitizing tablets display some important limitations. First, for a correct analysis it is very important to facilitate the approach to the instrumentation and to re-create the “natural” conditions of writing, while the use of digitizing tablets appears, to the subject, less “natural” than the “pen and sheet” method. Secondly, the analysis of the gesture is only bi-dimensional: the movement, in fact, is described by means of the × and y coordinates of the image acquired by the tablet, with no information about the third dimension. Finally, digitizing tablets do not allow integration of different signals: it is not possible, for instance, to record the position of the pen together with the electromyography signals of the activated muscles or with the posture of the subject during drawing; the lack of a direct comparison between kinematic and muscular activity limits the analysis capability of the system.
A new method for the quantitative analysis of drawing with an optoelectronic system has recently been developed and applied for the assessment of cognitive states and dementia (10) and for the assessment of motor abilities in children with learning disabilities (11), but there is a lack in the quantitative assessment of drawing tests for the assessment of motor abilities in subjects with Parkinson's disease.
Starting from the clinical need to have a quantitative method to better investigate the drawing ability in some pathologic conditions, and in view of the limits of standard methods, the aims of this study are:
the development of an experimental set-up for drawing, based on the acquisition through an optoelectronic system, which is suitable for subjects with PD or other motor diseases, and which can be proposed as a standard.
the application of the experimental set-up to a group of healthy subjects and to a group of subjects with Parkinson's disease, in order to quantify the principal alterations of the graphic gesture in patients with this pathology, and to highlight the effect of levodopa medication on drawing tasks.
Materials and Methods
Subjects were recruited in the San Raffaele Parkinson's Disease Centre of Cassino, (FR), Italy and were diagnosed according to the UK Brain Bank criteria. Healthy subjects were recruited between the patients' relatives. The study was approved by the Institute's Ethics Committee and all subjects were volunteers and gave informed consent to participation in the study.
The control group was composed of 15 healthy (H) subjects (mean age: 63.7±9.4), whose ages matched the ages of the PD subjects. Exclusion criteria for the control group included prior history of cardiovascular, neurologic or musculoskeletal disorders.
The group of PD subjects was composed of fifteen subjects (mean age: 66.8±9.7), assessed in the absence of pharmacologic medication (OFF) and after pharmacologic treatment with levodopa (ON).
PD subjects were assessed with a standard clinical battery of tests. All patients underwent a quantitative assessment of their neurologic condition using the Unified Parkinson's Disease Rating Scale (UPDRS). In particular, the severity of the extrapyramidal symptoms was rated using the motor section of UPDRS (UPDRS III); the score for this part ranges from 0 to 108 and a higher score denotes greater disability. Testing was performed both during the OFF phase (following withdrawal of levodopa medication) and in the ON phase at the best motor condition, approximately 90 minutes after the first dose of levodopa, in the morning. In addition, the subjects underwent brain computed tomography and a full neuropsychiatric assessment. The Mini Mental State Evaluation (MMSE) and the Geriatric Depression Scale (GDS) were used for rating dementia and depression respectively.
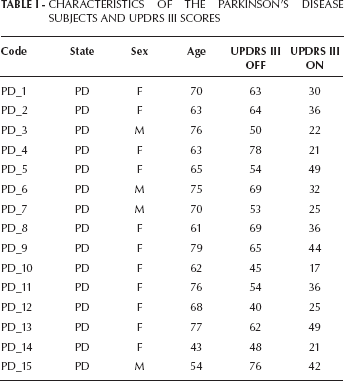
The characteristics of the PD subjects and the clinical scores of UPDRS III are listed in Table I.
CHARACTERISTICS OF THE PARKINSON'S DISEASE SUBJECTS AND UPDRS III SCORES
The graphic gesture was acquired with an optoelectronic system with six cameras (SMART BTS; Italy), at a frequency of 120 Hz, and with an integrated video system (Vixta, BTS, Italy) for videorecording; the acquisition was obtained by the measure of the x, y, and z coordinates of passive markers of diameter=5mm.
For this study the acquisition protocol consisted of a static acquisition and a dynamic acquisition, as reported by De Pandis et al (10). The markers configuration of Fig. 1a was used for the static acquisition, in which the subject did not take part: the pen was laid on the table and the markers were acquired for five seconds, in order to calculate the position of the tip of the pen and allow the calculation of its position during the dynamic acquisition, in which the graphic test was executed by the subject. In the dynamic acquisition markers were positioned both on the sheet and on the pen (Fig. 1b): for the dynamic acquisition the marker on the pen was removed, while the two markers on the sheet were positioned in order to give a reference system fixed with the sheet.
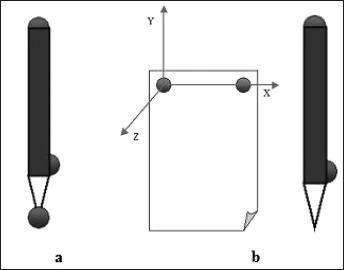
Configuration of the markers for static acquisition (a) and dynamic acquisition (b).
The subjects were asked to hand draw a spiral, starting from the center and having at least five revolutions (5,9) at their self-selected speed. During the execution subjects were not allowed to rest the forearm on the table, so that movements could be of larger amplitude (8, 12).
From the data obtained some parameters were identified and computed and a dedicated report was defined using Smart Analyzer software (BTS, Italy, Version 1.10).
Parameters were selected considering the spatiotemporal characteristics of the spiral drawing, and in particular the dimension of the spirals, parameter “D” (cm2) and the velocity profiles (mm/s) were considered to characterize the drawings. The parameter “D” was calculated as an indicator of the presence of micrographia, and computed as the product between two perpendicular diameters of the spiral [1]:

Figure 2 shows the diameters d1 and d2. d1 was calculated by prolonging the line passing from the final point of the drawing and the center of the spiral, while d2 was perpendicular to d1.
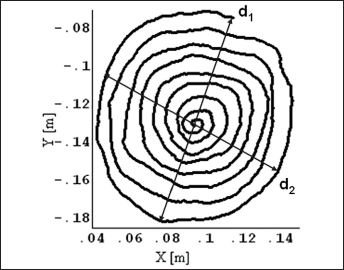
Perpendicular diameters of the spiral, used for the calculation of the dimension parameter (D).
The velocity profile patterns of the tip of the pen were considered in order to detect the slow movements (bradykinesia) typical of PD. Starting from the 3D coordinates of the markers on the pen, the pen tip coordinates were calculated, and therefore the parameter of “instantaneous velocity, Vist” (i.e. the velocity of the marker defined for each frame) was computed as (2):
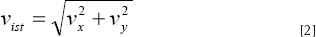
where Vx and Vy are the velocity components along the × and y directions respectively.
Velocity data were normalized with respect to time, so that each velocity profile could be plotted on a scale from 0 to 100, to enable comparison of the profiles and punctual averaging. A punctual mean was then calculated, separately, for the velocity profiles of H, PD ON, and PD OFF groups of subjects.
Linear regression was computed for the punctual mean velocity profiles, in order to describe the trends of the velocity profiles, from center to external spires, of the three groups of subjects.
Statistical Analysis
Data were grouped by two categories: healthy subjects (H) and subjects with Parkinson's disease. PD subjects were additionally sub-grouped as PD in the off-medication phase (with no dopaminergic treatment, “PD OFF”) and PD in the on-medication phase (after levodopa administration, “PD ON”). For each group the means and standard deviations of the selected parameters were calculated.
Non-parametric tests were chosen for statistical analysis, in particular the Mann-Whitney U-test, to compare H vs. PD ON group and H vs. PD OFF group, and the Wilcoxon Test, to compare the PD ON vs. PD OFF group.
Results
Figure 3 shows the drawing trace of the spiral drawn by a healthy subject and the traces of two spirals, drawn by the same PD subject (PD_9), in the off condition (in the center) and in the on condition (on the right), respectively.
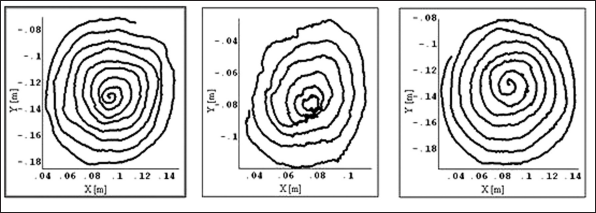
Trace of the spiral drawn by a healthy subject (on the left), and by the same subject with PD (PD_9), respectively in the off (in the center) and in the on (on the right) conditions.
The spirals drawn by the subject with PD in the two conditions are different: a marked presence of tremor and irregularity is present in the off condition, while better spatial organization and regularity in spiral increments can be found in the on condition, in which the spiral becomes very similar to the one drawn by the healthy subject. The spiral dimension is similar for the H and the subject with PD in the on condition, while the spiral is smaller for the PD in the off condition, as demonstrated by the × and y coordinate values.
In Table II the mean values (standard deviations) of the parameter “D” are shown with the results of the statistical analysis.
MEAN VALUES (SD) OF DIMENSION
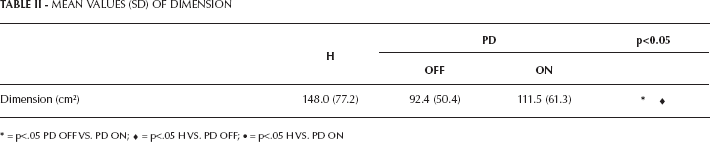
• = p<.05 H VS. PD ON
= p<.05 PD OFF VS. PD ON;
= p<.05 H VS. PD OFF;
Hand-drawn spirals analysis showed that H subjects globally drew spirals of bigger dimension compared to PD OFF subjects. Significant differences were also found between the spiral dimensions in the OFF vs. ON condition. No significant difference was found between PD ON and H subjects for the dimensional parameter.
In Figure 4 the punctual mean velocities of the three groups of subjects are shown. Linear regression is also plotted, with the line equation and the Pearson's Coefficient (R2), which is a measure of the quality of fitting.
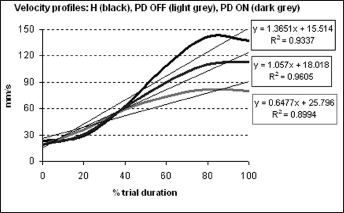
Punctual mean velocity profile and trend lines for the H (black), PD ON (dark grey), and PD OFF (light grey) groups, plotted against the percentage of duration of the trial.
It can be noted that H subjects (black line) developed the highest drawing velocities, with an increasing profile from the inside to the outside of the spiral, while PD OFF subjects (light grey) showed the lowest drawing velocities.
In Table III the angular coefficients of the three regression lines, calculated from the velocity profiles of Figure 4, are shown for comparison.
ANGULAR COEFFICIENT VALUES OF THE REGRESSION LINES OF THE VELOCITY PROFILES
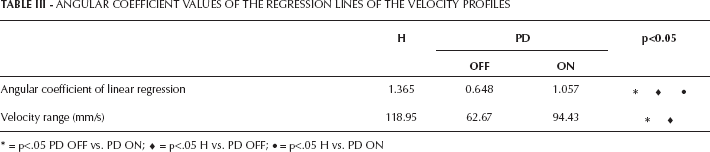
= p<.05 PD OFF vs. PD ON;
= p<.05 H vs. PD OFF;
= p<.05 H vs. PD ON
Form the analysis it is evident that the angular coefficients in the ON and OFF condition did not attain the value of the H angular coefficient. Comparing the two conditions, the lowest angular coefficient (approximately half value) was calculated for the PD OFF group.
The H group showed the higher velocity range than the pathologic individuals, and they incremented their drawing velocity from inside to the outside spires, with a trend that could be well-fitted (R2=0.9337) by a linear regression, and an angular coefficient of the regression line of 1.365. Velocity ranges were also significantly different between PD subjects in the ON and OFF conditions because in the OFF condition the subjects drew the slowest.
Discussion
In this study an experimental set-up was defined for the quantitative assessment of writing and drawing. The set up was applied to a group of healthy subjects, to define a group of reference, and to a group of subjects with PD, to assess the alterations caused by this pathology and to quantify the effect of levodopa treatment.
The subjects with PD were tested while following withdrawal of levodopa therapy (OFF) and in the on medication condition (ON), in order to highlight the differences caused by the pharmacologic treatment on the drawing task.
The computed parameters were useful for the quantification of the handwritten Archimedean spirals and for the characterization of the healthy vs. pathologic subjects and of PD ON vs. PD OFF subjects.
Statistical analysis showed that the administration of levodopa positively affects the motor performance of PD subjects. The parameter of dimension (D) showed that H subjects drew larger spirals, while PD OFF subjects drew smaller spirals; no difference was found between H and PD ON for the dimensional parameter. This means that, for both PD ON and H subjects, the movement was larger, involving both the distal joint of the wrist and the proximal joint of the shoulder. PD OFF subjects, conversely, drew smaller spirals, so that the shoulder joint was as less involved as possible, and motor control could be increased (4,6). This phenomenon is related to the presence of micrographia in PD OFF subjects, in accordance to what has been observed in literature (6, 13, 14). Levodopa treatment appeared to positively influence the dimension of the spirals, which increased in the on condition with respect to the off condition, and approached control values. One of the documented effects of levodopa, in fact, is to decrease the entity of tremor and bradykinesia and, as a result, we can infer that this globally leads to better motor control and thus larger drawing movements.
The administration of levodopa appeared to also increase the PD subjects' velocity, which approached the values of the H subjects in the ON condition. The treatment therefore displays a positive effect on bradykinesia, thus increasing the velocity of motion and the motor control capabilities of the subjects when passing from off to on medication condition.
Velocity profiles analysis of hand-drawn spirals showed that healthy subjects increased their velocity from the center to the outside of the spiral (7); their velocity profiles could be well-fitted by a linear regression line. For PD OFF subjects, the analysis of velocity profiles showed more difficulty in maintaining constant increments between spires, with a major slowness of the movement. As a result, the ranges of velocity and the angular coefficient of linear regression (which represent the capacity to increment the velocity from inside to the outside of the spiral and the extent of the increment), were smaller in the OFF medication condition, where the absence of levodopa effect contributed to worsening bradykinesia. The narrower velocity ranges in the OFF condition indicate that the subjects, owing to fatigue and limited motor control, tended to move slower and/or to stop during drawing.
The experimental set-up used in this study was suitable both for healthy and pathologic individuals. The test was completely non-invasive and did not limit in any way the subject's motion. In addition, it permits an easy employment in clinical analysis, and enables motion analysis laboratories to enrich the possibilities for screening and diagnosis by introducing the quantitative analysis of drawing to the set of their motor tests. The characteristics of the protocol suggest its applicability with regard not only to PD but also to other fields of motor and cognitive assessment, before and after specific treatments.
Footnotes
Acknowledgments
We are grateful to Doc. Maria Gaglione for support with the acquisitions and to Eng. Francesco Menegoni for the preliminary part of protocol development with smart Analyzer.
Financial support: None.
Conflict of interest: The authors have no conflicts of interest.