
Abstract
Background
Patients with chronic kidney disease (CKD) may have increased plasma concentrations of some tumor markers even when no cancer is present. Previous studies have indicated that plasma concentrations of chromogranin A (CGA), cytokeratin 19 fragments (CYFRA 21-1), cancer antigen 125 (CA 125), cancer antigen 19-9 (CA 19-9) and carcinoembryonic antigen (CEA) are higher in patients with CKD but without cancer, than in healthy individuals, and this can make interpretation of results more complicated. The aim of this study was to establish reference limits for these markers in patients with CKD not receiving dialysis and with no clinical evidence of cancer.
Methods
We measured plasma concentrations in samples from 131 patients with CKD due to various etiologies and studied the association of tumor marker concentrations with estimated glomerular filtration rate (GFR) and other patient characteristics.
Results
Estimated reference limits for plasma CA 125, CA 19-9 and CEA were approximately the same as for healthy populations. Serum concentrations of CGA and CYFRA 21-1 correlated strongly with estimated GFR, and GFR-dependent reference limits were estimated.
Conclusions
GFR-dependent reference limits for CGA and CYFRA 21-1 are reported in order to support interpretation of these markers in patients with CKD.
Introduction
A number of nonmalignant conditions may influence plasma concentrations of tumor markers due to increased release into the blood stream or impaired elimination (1). Molecules eliminated by renal filtration may be retained in the blood in patients with kidney failure. Particularly, this is the case for small molecules with molecular weight below 25-30 kilodaltons (kDa) (2). Correspondingly, plasma concentrations of small-molecularsize tumor markers may increase with decreasing glomerular filtration rate (GFR). In addition, metabolic disturbances in patients with chronic kidney disease (CKD) may influence tumor marker metabolism. If concentrations of tumor markers are significantly altered in patients with CKD for one of these reasons, then interpretation of tumor marker measurements may become more complicated, both with respect to assessing the probability of having a specific malignant disease and whether already diagnosed cancer has progressed or regressed.
Cancer and CKD both affect a large number of people (3, 4). Issues related to use of tumor markers in patients with CKD are therefore highly relevant (5). This study aimed to estimate reference limits for some frequently used tumor markers in patients with CKD and impaired GFR, to support a more adequate interpretation of these markers.
Methods
Patients and samples
The study population has been described elsewhere (6). Briefly, it comprised 160 nondialysis patients with CKD visiting the renal outpatient clinic in a tertiary hospital between 2007 and 2009. Clinical information was collected from medical records. Serum and plasma samples were collected consecutively as patients were included in the study. All samples were collected during daytime as part of routine care using Vacuette® SST and Lithium Heparin tubes (Greiner-Bio One). Patients were not required to be fasting. Samples were stored in sealed 500-μL cryotubes at −80°C until analysis of plasma carcinoembryonic antigen (CEA), cancer antigen 19-9 (CA 19-9) and cancer antigen 125 (CA 125) in 2009 and of serum chromogranin A (CGA) and cytokeratin 19 fragments (CYFRA 21-1) in 2015.
Ethics
The study was approved by the Regional Committee for Medical Research Ethics, and all participants gave informed consent for participation in the study.
Laboratory methods
All measurements were made according to the manufacturer's instructions with kits from Roche Diagnostics GmbH (Mannheim, Germany), except for CGA for which kits were obtained from Euro Diagnostica AB (Malmö, Sweden), as detailed in Supplementary Table I (available online at www.biological-markers.com – Specifications for analytical methods for tumor markers). Creatinine was measured with an enzymatic method traceable to isotope dilution mass spectrometry and sodium with indirect potentiometry. Estimated glomerular filtration rate (eGFR) was calculated using the Chronic Kidney Disease Epidemiology Collaboration (CKD-EPI) equation (7). Patients were classified into CKD grades 1 to 5 according to whether eGFR was ≥90, 60-89, 30-59, 15-29 or <15 mL/min per 1.73 m2, respectively (8). Not all analytes were measured in all samples due to limited sample availability. The analytical quality of all methods was assessed on the basis of internal and external quality assessment programs and found acceptable. The integrity of stored samples was evaluated by comparing concentrations of sodium measured at times of sample collection and tumor marker measurement. In addition, 60 plasma samples from blood donors collected in 2011 were compared with 60 samples from age- and sex-matched blood donors collected in 2016 in order to confirm stability of CYFRA 21-1 and CGA when stored at −80°C for several years.
Clinical kidney disorders
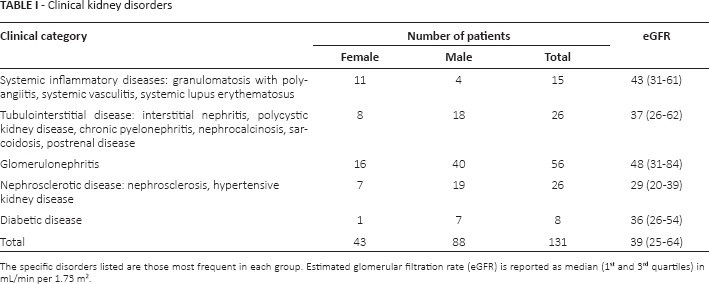
The specific disorders listed are those most frequent in each group. Estimated glomerular filtration rate (eGFR) is reported as median (1st and 3rd quartiles) in mL/min per 1.73 m2
Statistical analysis
We used MedCalc Statistical Software v. 15.8 (MedCalc Software bvba, Ostend, Belgium) to estimate reference limits with the robust method as recommended for small sample sizes by the Clinical and Laboratory Standards Institute (9). When appropriate, reference values were partitioned according to CKD grades. Outliers identified with Reed's method (10) were removed. For all other statistical analyses we used SAS v. 9.4 (SAS Institute Inc., Cary, NC, USA). We used Spearman's rank correlation analysis, and the Mann-Whit-ney-Wilcoxon test to compare tumor marker concentrations between groups. We used quantile regression analysis (11) to investigate relationships between quantiles of tumor marker concentrations and relevant covariates. Quantile regression can be used to estimate any conditional quantile of a continuous variable on 1 or more explanatory variables. It is a nonparametric method and therefore has fewer assumptions regarding the underlying distribution of values than ordinary least squares regression methods. As low concentrations of the tumor markers are of little clinical relevance, only upper reference limits were estimated. Due to the limited number of observations, the reported quantiles were partly chosen to obtain reasonably narrow confidence intervals (CI). A p value <0.05 was considered statistically significant.
Results
Patient characteristics
Samples were available from 157 patients, of whom 19 were excluded due to previous or evident cancer at inclusion, or death from cancer before latest record review in 2012. In addition, 7 patients were excluded on suspicion of relevant comorbidity based on results of routine laboratory tests (cardiac troponin T = 765 ng/L, alanine aminotransferase = 223 U/L, vitamin B12 = 1,298 pmol/L, C-reactive protein = 65 and 148 mg/L, CA 19-9 = 358 kIU/L and CA 125 = 155 kIU/L, respectively), leaving 131 patients. Median age was 55 years (range 18 to 85 years). All except 3 patients were white. Median eGFR was 39 mL/min per 1.73 m2 (range 12-133). Number of patients with CKD grades 1 to 5 was 17, 22, 52, 33 and 7, respectively. Table I lists the number of patients with respective clinical kidney disorders.
Sample integrity
Sodium was measured in patient samples at the time of collection and in samples analyzed in 2015. Median relative difference in sodium concentration between samples from the same patient was 2.2%. The difference was less than 3% for 75% and less than 5% for all 131 patients. If the apparent change in sodium concentration was caused by evaporation of water during storage, median increase in tumor markers due to water loss would be in the order of 2%, which we considered to be negligible with respect to the validity of estimated reference limits. Mean differences (95% confidence interval [95% CI]) between samples from blood donors stored at −80°C since 2011 and samples stored for a few weeks were 0.00 μg/L (95% CI, −0.17 to 0.17) for CYFRA 21-1 and 0.14 nmol/L (95% CI, −0.18 to 0.45) for CGA, which is considered to be insignificant.
Chromogranin A
Seven patients using proton pump inhibitors were excluded, leaving 124 patients for the evaluation of CGA (Fig. 1). CGA correlated inversely with eGFR (r = −0.83, p<0.001). A quantile regression model was fitted for the 90th and 95th percentiles of CGA with inverse eGFR as predictor (Tab. II). Coefficients for age and sex were not statistically significant for any of the percentiles (p>0.14).
Quantile regression parameters for chromogranin A
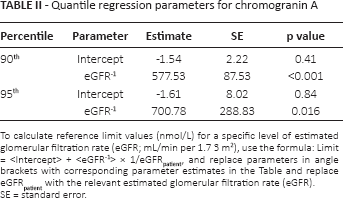
To calculate reference limit values (nmol/L) for a specific level of estimated glomerular filtration rate (eGFR; mL/min per 1.7 3 m2), use the formula: Limit = <Intercept> + <eGFR−1> × 1/eGFRpatient, and replace parameters in angle brackets with corresponding parameter estimates in the Table and replace eGFRpateint with the relevant estimated glomerular filtration rate (eGFR).
SE = standard error
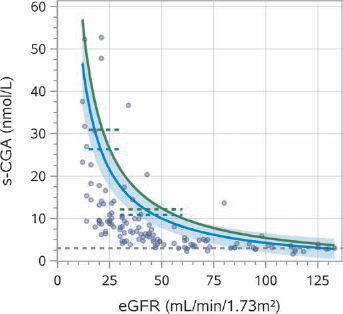
Serum concentration of chromogranin A (s-CGA) plotted versus estimated glomerular filtration rate (eGFR). Gray dashed horizontal line corresponds to the 3.0 nmol/L upper reference limit for CGA (see Supplementary Table I, available online at www.biological-markers.com – Specifications for analytical methods for tumor markers). Blue and green solid lines correspond to quantile regression estimates of the 90th and 95th percentiles, respectively. The blue band represents the 90% confidence interval for the 90th percentile. Correspondingly, blue and green dashed horizontal lines indicate reference limits estimated with the robust method for chronic kidney disease (CKD) grades 3 and 4 as the 90th and 95th percentiles.
Reference limits for CKD grades 3 and 4, the only subgroups with more than 30 patients, were estimated with the robust method after removal of 1 outlier. For patients with CKD grade 3, the 90th and 95th percentile reference limits were 10.8 (95% CI, 9.1-12.4) and 12.2 nmol/L (95% CI, 10.0-14.1), respectively. Corresponding limits for CKD grade 4 were 26.3 (95% CI, 17.3-32.2) and 30.9 nmol/L (95% CI, 19.4-38.4).
CYFRA 21-1
CYFRA 21-1 was measured in samples from 131 patients (Fig. 2). CYFRA 21-1 correlated inversely with eGFR (r = −0.57, p<0.001). Parameter estimates of a quantile regression model fitted for the 90th and 95th percentiles of CYFRA 21-1 with eGFR as predictor are given in Table III. Coefficients for age and sex were not statistically significant (p>0.15).
Quantile regression parameters for CYFRA 21-1
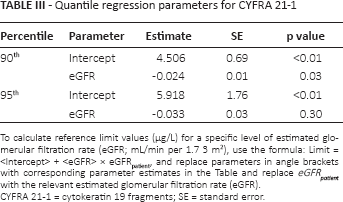
To calculate reference limit values (μg/L) for a specific level of estimated glomerular filtration rate (eGFR; mL/min per 1.7 3 m2), use the formula: Limit = <Intercept> + <eGFR> × eGFRpatient, and replace parameters in angle brackets with corresponding parameter estimates in the Table and replace eGFRpatient with the relevant estimated glomerular filtration rate (eGFR).
CYFRA 21-1 = cytokeratin 19 fragments; SE = standard error
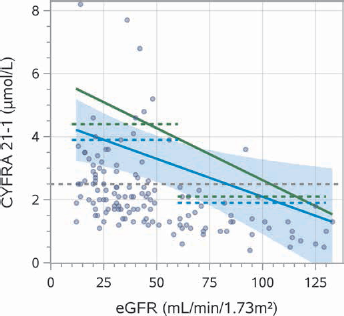
Cytokeratin 19 fragments (CYFRA 21-1) plotted versus estimated glomerular filtration rate (eGFR). Gray dashed horizontal line corresponds to the 2.5 μg/L reference limit for CYFRA 21-1 (see Supplementary Table I, available online at www.biological-markers.com – Specifications for analytical methods for tumor markers). Blue and green solid lines correspond to quantile regression estimates of the 90th and 95th percentiles, respectively. The blue band represents the 90% confidence interval for the 90th percentile. Correspondingly, blue and green dashed horizontal lines indicate the 90th and 95th percentiles estimated with the robust method in patients with eGFR lower or higher than 60 mL/min per 1.73 m2.
Based on the distribution of eGFR and the correlation of CYFRA 21-1 with eGFR, separate reference limits for patients with eGFR higher and lower than 60 mL/min per 1.73 m2 appeared to be appropriate. In patients with eGFR ≥60 mL/min per 1.73 m2 (CKD grades 1 and 2), the 90th and 95th percentile reference limits estimated with the robust method were 1.9 (95% CI, 1.7-2.1) and 2.1 μg/L (95% CI, 1.8-2.4), respectively. In patients with eGFR <60 mL/min per 1.73 m2 (CKD grades 3, 4 and 5), the corresponding limits were 3.9 (95% CI, 3.4-4.4) and 4.4 μg/L (95% CI, 3.8-5.0), after removal of 1 outlier.
CA 125
CA 125 was measured in 127 samples. Fourteen patients using warfarin were excluded on suspicion of having atrial fibrillation (see “Discussion”). There was no statistically significant correlation between CA 125 and eGFR (p = 0.5) or difference between men and women (p = 0.4). The 90th and 95th percentile reference limits estimated with the robust method were 27 (95% CI, 24-30) and 31 kIU/L (95% CI, 27-35), respectively. When only women were included, the corresponding reference limits were 28 (95% CI, 23-34) and 32 kIU/L (95% CI, 26-39), comparable to the reference limit from the manufacturer's product specifications (35 kIU/L).
CA 19-9
CA 19-9 was measured in 127 samples. There was no statistically significant difference between men and women (p = 0.3) or correlation between CA 19-9 and eGFR (p = 0.2). The 90th, 95th and 97.5th percentile reference limits estimated with the robust method were 26 (95% CI, 23-29), 30 (95% CI, 27-33) and 33 kIU/L (95% CI, 30-37), respectively, which is comparable to the reference limits in the manufacturer's product specifications.
CEA
CEA was measured in 126 samples. There was no statistically significant difference in CEA between smokers (n = 24) and nonsmokers (p = 0.35). CEA correlated inversely with eGFR (r = −0.26, p<0.01). Coefficients estimated with quantile regression of the 90th and 95th quantiles of CEA with eGFR, age, sex and smoking status as predictors were not statistically significant. The 95th percentile estimated with the robust method on basis of samples from the 79 nonsmokers aged 40 years or older was 4.4 μg/L (95% CI, 3.9-4.8) after removal of 1 outlier. The corresponding reference limit from the manufacturer's product specifications is 5.0 μg/L Numbers of patients who were younger than 40 years or smokers were too low to estimate relevant quantiles.
Discussion
Serum concentrations of CGA and CYFRA 21-1 correlated strongly with eGFR. GFR-dependent upper reference limits may support interpretation of these markers and, if used as diagnostic decision limits, may improve diagnostic specificity compared with regular reference limits, in patients with CKD. Continuous limits estimated by quantile regression have the potential of providing a better fit to the concentrations observed in patients with variable levels of eGFR compared with separate limits – e.g., for different CKD grades.
Chromogranin A is a peptide with a molecular weight of 48 kDa. Increased concentration of CGA in plasma is associated with neuroendocrine tumors – e.g., carcinoid tumors, small cell lung cancer, neuroblastoma and pheochromocytoma (12). CGA does not vary with sex and age and does not correlate with blood pressure (13). It may increase in acute coronary syndrome and liver disease (1) and in patients using proton pump inhibitors (14). We therefore excluded patients with suspected influencing factors.
Several studies have demonstrated increased CGA in patients with renal failure (15-17). Our findings agree with Hsiao et al (15), Tramonti et al (16) and Bech et al (17), who observed increasing concentrations of CGA with lower GFR in patients with kidney disease. However, none of these studies reported specific reference limits for CGA at different levels of GFR. Consequently, their results are difficult to apply when trying to decide whether CGA in individual patients with CKD is increased, compared with what is expected according to the patient's GFR. Hsiao et al (15) found no significant effect of sex, age and blood pressure on any central tendency of CGA when adjusted for creatinine. We found no significant additional effect of these variables in a quantile regression model of the 90th and 95th percentiles of CGA.
CYFRA 21-1 antigen identified by the BM 19.21 and KS19.1 antibodies is composed of soluble fragments of cytokeratin 19 with a molecular size of approximately 30 kDa. Elevated plasma concentration of CYFRA 21-1 is associated with epithelial cell carcinomas (18, 19), benign pulmonary diseases and liver cirrhosis (1, 20). CYFRA 21-1 does not correlate with age, sex or smoking (21, 22).
Our findings are in agreement with several studies demonstrating increased CYFRA 21-1 in patients with renal failure (19, 20, 22-25). GFR-dependent reference limits were, however, not reported in most of these studies. Xiaofang et al (23) reported 90th percentiles for CYFRA 21-1 in Chinese non dialysis CKD patients. As in our study, values increased with decreasing creatinine clearance, but were, in general, almost twice as high as in our study. Likewise, Tong et al (25) measured CYFRA 21-1 in a large number of samples from CKD patients and reported 75th percentiles in patients with CKD grades 1-5 somewhat higher than in our study. As levels of CYFRA 21-1 seem to vary between different healthy populations (20, 25-27) we believe that differences with respect to demographic factors, comorbidity or CKD treatment are the most likely explanations for the observed differences between the different CKD populations.
CA 125 is a high-molecular-weight glycoprotein recognized by the monoclonal antibody OC 125. High plasma concentrations are associated with ovarian carcinoma and malignant diseases in the endometrium, breast and gastrointestinal tract. Nonmalignant causes of increased concentrations are, among others, liver disease, pancreatitis, lung disease, heart failure (1), pleural effusions, ascites (28, 29) and pregnancy.
We found approximately the same 95th percentile in patients with CKD as the corresponding reference limit reported in the manufacturer's product specifications, which was based on healthy premenopausal and postmenopausal females. In accordance with this, we observed no significant correlation between CA 125 and eGFR.
Several studies have demonstrated increased CA 125 in patients with renal failure (23, 30-32). Filella et al (30) observed increased CA 125 in 17% of patients with chronic renal failure, but no correlation with creatinine. Xiaofang et al (23) observed increased levels of CA 125 in patients with CKD. In subgroups according to sex and creatinine clearance, they reported 90th percentiles 3-4 times as high as we observed, even though we apparently used the same analysis method. The 2 populations appear not to be comparable, possibly due to differences with respect to comorbidity.
In our study, use of warfarin was strongly associated with high serum concentrations of CA 125. Although we did not collect specific information regarding the reasons for anticoagulant therapy, some of these patients likely had atrial fibrillation (AF). As AF is associated with heart failure, fluid retention and elevated CA 125 (33), patients with high probability of AF were excluded from the final analysis in our study. It is possible that increased CA 125 observed in some patients with kidney disease is associated more with fluid overload than impaired GFR.
CA 19-9 recognized with the monoclonal antibody 1116-NS-19-9 is a high-molecular-weight glycolipid antigen. Increased serum concentrations are associated with pancreatic and gastrointestinal malignancies, but CA 19-9 may also be elevated in other gastrointestinal, hepatobiliary and pulmonary disorders (1).
We found reference limits in patients with CKD comparable to those in a healthy population reported in the manufacturer's product specifications. This is in agreement with Filella et al (30), who did not observe increased frequency of CA 19-9 above cutoff in patients with chronic renal failure. However, Arik et al (32) observed almost twice as high a mean CA 19-9 in predialysis patients with chronic renal failure as in healthy controls. Likewise, Xiaofang et al (23), who apparently used the same method as we did, reported medians and 90th percentiles in groups with different levels of creatinine clearance almost twice as high as in our study. Dissimilarities related to the study populations and possibly the analytical methods may explain these differences (34).
Carcinoembryonic antigen is a high-molecular-weight glycoprotein of approximately 180 kDa. Increased serum concentrations are associated with colorectal carcinoma but may also be observed in nonmalignant disorders of the intestine, liver, pancreas and lungs (1). CEA correlates with age and is frequently increased in smokers (35).
We estimated the 95th percentile reference limit of CEA among nonsmoking patients with CKD aged 40 years or older to be somewhat lower than the corresponding limit reported in the manufacturer's product specifications. This is in agreement with Arik et al (32), who observed mean CEA in predialysis patients with chronic renal failure not different from that of healthy controls. In studies by Filella et al (30) and Nomura et al (36), CEA correlated with creatinine, as we also observed in our study. However, they both observed a substantial number of patients with CEA above upper reference limits. As smoking habits were not reported, results are difficult to interpret. Tong et al (25) reported medians and 75th percentiles in patients with CKD grades 1 to 5 approximately as in our study. However, they also did not record information about smoking habits.
Study limitations
The number of patients included in the present study was limited, therefore the choice of reference limits was done on the basis of which percentiles could be estimated with acceptable precision. Although patients with evident cancer were excluded, we cannot rule out that some patients with undetected cancer were included in our study. As the probability is low and not related to GFR, this is unlikely to have had a significant influence on the estimated reference limits. Samples were stored in −80°C for several years before analysis. As differences in sodium concentrations measured at time of inclusion and in 2015 were small, increased concentrations due to evaporation were probably negligible. Degradation of tumor markers during storage was probably small (37, 38) and most likely independent of patient GFR. Hence, we believe this did not have a significant influence on the observed association between eGFR and marker concentrations.
Conclusions
To support the interpretation of tumor marker measurements in CKD patients, we estimated GFR-dependent reference limits for CGA and CYFRA 21-1 in patients with eGFR ranging from 12 to 133 mL/min per 1.73 m2. Reference limits for CA 19-9, CA 125 and CEA were approximately the same as in healthy populations.
Footnotes
Financial support: Trondheim University Hospital, Trondheim, Norway, supported the study financially.
Conflict of interest: Authors declare they have no conflicts of interest.