
Abstract
Background
Information on preanalytical variability is mandatory to bring laboratories up to ISO 15189 requirements. Fecal sampling is greatly affected by lack of harmonization in laboratory medicine. The aims of this study were to obtain information on the devices used for fecal sampling and to explore the effect of different amounts of feces on the results from the fecal immunochemical test for hemoglobin (FIT-Hb).
Methods
Four commercial sample collection devices for quantitative FIT-Hb measurements were investigated. The volume of interest (VOI) of the probes was measured from diameter and geometry. Quantitative measurements of the mass of feces were carried out by gravimetry. The effects of an increased amount of feces on the analytical environment were investigated measuring the Hb values with a single analytical method.
Results
VOI was 8.22, 7.1 and 9.44 mm3 for probes that collected a target of 10 mg of feces, and 3.08 mm3 for one probe that targeted 2 mg of feces. The ratio between recovered and target amounts of devices ranged from 56% to 121%. Different changes in the measured Hb values were observed, in adding increasing amounts of feces in commercial buffers.
Conclusions
The amounts of collected materials are related to the design of probes. Three out 4 manufacturers declare the same target amount using different sampling volumes and obtaining different amounts of collected materials. The introduction of a standard probes to reduce preanalytical variability could be an useful step for fecal test harmonization and to fulfill the ISO 15189 requirements.
Introduction
In the clinical laboratory setting, the standardization and harmonization of methods and the use of correct metrics and reference units are crucial to allow the comparison of analytical data and to transfer the data acquired in clinical trials to individual patient management. Many critical points need to be observed to obtain comparable results from quantitative methods used in fecal samples analysis. Sample characteristics critically affect both preanalytical and analytical phases of quantitative measurements in fecal tests.
The FIT for Screening Expert Working Group of the Colorectal Cancer Screening Committee of the World Endoscopy Organization (WEO) (1, 2) pointed out the importance of fecal sampling in the measurements of hemoglobin (Hb) using fecal immunochemical tests for hemoglobin (FIT-Hb). Commercial methods for quantitative measurements of feces are based on different self-sampling strategies. In the absence of guidelines or recommendations from certification bodies or scientific societies, manufacturers have developed different sample collection devices (SCDs) and buffers, which make the analytical results dependent on the specific analytical system (3, 4), which in turn could make clinical interpretation difficult. Moreover, the texture of biological material and its chemical-physical characteristics related to food intake and physiology, the nonhomogeneous distribution of the analyte in the fecal material and the variability of Hb concentration in different bowel motions in malignant and nonmalignant lesions, represent sources of variability in Hb measurement.
Previous issues were debated in an opinion letter presented in 2014 (5). These effects are widely reported for FIT-Hb measurements, but similar effects were observed also for fecal calprotectin (6).
The ISO 15189 regulations for quality and competence in medical laboratories (7) require to address variability of all phases of the analytical process.
There are evidences (3, 4) to support the importance of the preanalytical phase in FIT-Hb, and to justify all the efforts to reconsider the possibility to provide informations on sampling in fecal tests investigation.
Only theoretical values of amounts of collected feces and buffer volumes contained inside the sampling collection devices are provided by manufacturers. The differences in the information given result in about a 20-fold difference in fecal concentrations (mass/volume) analyzed by different methods (8-11). Moreover, no information is provided by manufacturers about the method used to obtain the declared amount of collected materials, and no data are available on the mass to volume ratio in self-sampling devices.
Before starting this study, specific queries regarding the technical designs of single fecal probes were sent to the manufacturers, but none of the companies contacted were able to provide this information, forcing us to directly investigate the free volumes of sampling dipsticks. To approach any variability related to the sampling collection devices and the effect of the amount of fecal materials on FIT-Hb results, we investigated the overall amount of feces collected by different SCDs, the ratio between mass of feces and sampling volumes and the effect of the amount of feces on the analytical phases of several widely used sampling buffers.
Methods
In this study, 4 SCDs available in Italy for quantitative FIT-Hb measurements were included: the OC-Sensor (Eiken Chemical Co. Ltd., Japan), NS-Plus (Alfresa Pharma Co., Japan), HM-Jack-Arc (Kyowa Medex Co. Ltd., Japan) and FOB-Gold (Sentinel CH SpA, Italy).
Measurement of sampling volumes
The volume of that part of the sample collection probe used for the collection of feces was obtained from the probe diameter and its geometry (Fig. 1). We collected a micro-computed tomography (μ-CT) data set using a high-resolution μ-CT Skyscan 1172 at the Service of Structural Crystallography (CRIST) of the University of Florence. This system has a sealed, microfocus tungsten X-ray tube with a 5-μm focal spot size. The X-rays were produced by exposing the anode to an electron beam at 71 kV and 122 mA. The tip of the probe was cut off to enable it to be placed on a pedestal between the X-ray tube source and the charge-coupled device (CCD) detector. The 2-dimensional (2D) X-ray images were captured over 180-degree rotating sample with a slice-to-slice rotation angle of 0.3°; each 2D image represents 1 slice. The total acquisition time was approximately 15 minutes. Spatial resolution of the images was kept in a range of 9.6 to 9.9 microns in terms of pixel size. The 3D image of the objects' internal structure was reconstructed using a modified algorithm by Feldkamp et al (12) for cone-beam acquisition geometry realized in Nrecon v.1.6.3.10 software (Bruker-MicroCT software). The alignment, beam-hardening and ring artifact corrections were made before starting the reconstruction process. CTan software (Bruker-MicroCT software) was used for the image clean-up and for the measurements. The standard deviations were calculated from the measured pixel sizes (±0.01 μm).
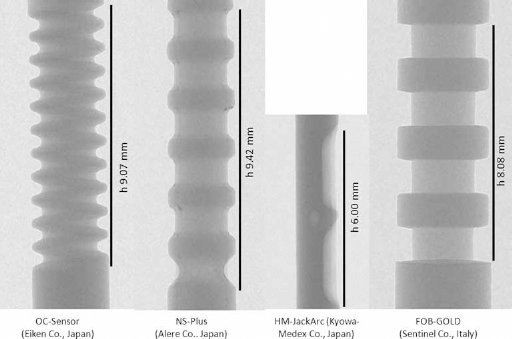
Two-dimensional X-ray images of sampling regions of tested sampling collection devices. Only height (h) is reported in the figure; all other measures (radius, depth of dimples etc.) used to evaluate the collecting volumes were obtained as a ratio with height, after magnification of the 2D image.
To determine the geometric figure volume (GFV) for each device, we calculated the volume of the cylinder that inscribed the probe. The volume of the part of the sample collection probe used for the collection of feces, called the volume of interest (VOI), was calculated by subtracting the probe volume (PV) evaluated from the μ-CT reconstruction, from the GFV.
Measurement of collected faeces
Quantitative measurements of the mass of feces collected were carried out by assessing the mean and the SD of the different probes performing 8 measurements for each device on 3 fecal materials of different texture. Specific weights and Bristol scale values (13) of the samples used throughout the investigations were registered.
The mass of collected material was measured by weighing (Mettler AE 240), with measuring range of 0-40 g, imprecision (± SD) 0.01 mg, using the protocol reported by the Guildford Medical Device Evaluation Centre (GMEC) in the evaluation commissioned by the NHS Bowel Cancer Screening Programme Southern Hub (8) and adapted for the present study.
In brief, the measurement of the mass of collected material was based on opening the SCDs and removing the buffer; then collection of feces was performed, and the excess material was removed with the specific filter (collar) of the sample device. The sampling region of the probe, complete with sampled material, was cut and weighed. Finally, washing, drying and weighing this region of the probe were completed to obtain the tare weight.
To evaluate the capability of each device to collect fecal matter and the repeatability of the procedure, 24 devices were used for each manufacturer. In this way, the mean and the SD of the different probes were assessed performing 8 measurements for each device, for 3 different fecal matter textures. Performance of sampling collection devices was reported as mean and SD. Samples were collected in a sterile container, with a screw cap, from 3 voluntary healthy donors (2 men and 1 woman, aged 50-60 years) previously tested for Hb-free stool.
The mass of the feces collected out of the VOI – in particular, on the top of the probes – and the variation related to use of different plastic materials were investigated using the same strategy of measuring the amount of material collected, avoiding the sample collection component (the region of the probe specifically designed for collection of fecal sample).
The ratio between the amount of collected materials and the VOI of different devices was defined as the recovery and was obtained for the tested SCDs. The time to move feces from probes of different SCDs into the commercial buffers (time of dissolution) of biological material was registered throughout the investigation.
Effect of feces on the Hb measurement
The alignment between the analytical systems and the expected values was investigated on the OC-Sensor system using a reference solution of Hb with assigned Hb concentration obtained starting from a routine hematology analyzer (Sysmex XE 2100; Sysmex Co., Cobe, Japan) calibrated according to the DIN 58931 standard.
Hemolysis of a whole venous blood sample was performed using distilled water. The sample was then diluted (serial dilutions) in physiological saline solution and finally diluted in the sample buffer specific for the method.
Starting Hb concentrations, measured from Hb dilutions, were considered as the expected ones (100% recovery) in the further evaluations. Experiments were done in duplicate, and imprecision was indicated as variation coefficients. The relationship between the Hb measurements and increased concentrations of fecal materials in commercial buffers was investigated in detail on the OC-Sensor system. Increasing amounts of Hb-free feces were sampled by single or double sampling using the HM-JackArc (expected: 2 mg and 4 mg) and OC-Sensor (10 mg and 20 mg) sampling probes, respectively.
Samples were gently mixed and measurements were performed using the same analytical system (OC-Sensor), in a single run. After that, feces were placed in the buffer. The influence of feces, on the reaction medium, was investigated in commercial buffers available for quantitative methods based on latex immunoagglutination.
The aim of the study was to evaluate only the effects of buffer, and the choice was to avoid any analytical variability carrying out all tests on the same system. Different amounts of Hb-free feces were added to 2 mL of a starting solution of Hb in buffers used by OC-Sensor, HM-JackArc and FOB-Gold methods.
The NS-Plus method, based on antibodies bound to colloidal gold particles, uses a blue buffer and gives clearly incorrect results when developed on latex agglutination-based systems. For this reason, it was excluded from further investigation.
Imprecision of the analytical systems throughout the investigation periods was assessed by means of 2 control materials with different Hb concentrations (QC Control LV1 and LV2: Eiken Chemical Co. Ltd., Japan).
Statistical analyzes were performed using the programs available for Excel 2010 (Microsoft, USA).
Results
Fecal samples were handed by donors to the laboratory within 1 hour from collection, preserved in sterile containers with a screw cap at room temperature and processed within 3 hours.
Specific weights of fecal samples ranged from 0.89 to 1.23. The Bristol scale values of samples used to assess the performance of SCDs were 3, 4 or 5. In Figure 1, images of SCDs used to assess the VOIs and to start the measurement of SCDs are reported. In Table I, data are given for the volumes obtained for the geometric figures and sampling regions through geometric estimation; the amount of feces recovered (means and SD), in and out of the VOI (materials collected on the top of the dipsticks); the amount of material collected in the sampling volumes (recovery); the ratio between recovered materials and sampling volumes (mg/mm3); and the amount of feces targeted by the manufacturers and the ratio (%) between collected and targeted amounts of feces for tested SCDs. The ratio between VOI and collected materials ranged from 100% to 130%.
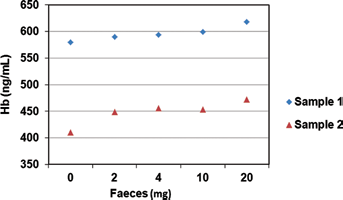
Hemoglobin (Hb) recovery with the OC-Sensor system, adding different amounts of fece samples. Expected amounts of Hb were obtained by dilution of hemolyzed blood cells. Sample 1 (blue diamond) = expected value: 430 ng/mL; actual recovery 94% (410/430 ng/mL). Sample 2 (red triangle) = expected value: 470 ng/mL; actual recovery 124% (582/470 ng/mL).
Volumes estimated by geometric calculation of commercial sample collection devices
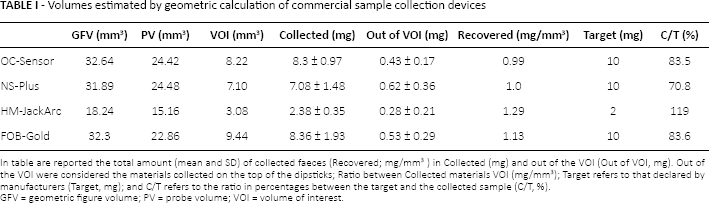
In table are reported the total amount (mean and SD) of collected faeces (Recovered; mg/mm3) in Collected (mg) and out of the VOI (Out of VOI, mg). Out of the VOI were considered the materials collected on the top of the dipsticks; Ratio between Collected materials VOI (mg/mm3); Target refers to that declared by manufacturers (Target, mg); and C/T refers to the ratio in percentages between the target and the collected sample (C/T, %). GFV = geometric figure volume; PV = probe volume; VOI = volume of interest.
Coefficients of variation obtained for tested SCDs in recovery tests ranged between 9.7 and 13.3 for OC-Sensor, 11.7 and 30.4 for NS-Plus, 14.4 and 31.1 for FOB-Gold and 8.6 and 21.3 for HM-JackArc. The ratios between the mean collected material and the VOI were 99% for OC-Sensor, 100% for NSPIus and 129% for both HM-JackArc and FOB-Gold SCDs. The time to move feces from probes into the commercial buffers ranged between 20 and 30 minutes for all probes, out of the HM-JackArc SCD, with an overall resulting time of up to 120 minutes.
The 2 recovery tests were performed on the OC-Sensor system starting from samples with expected values of 430 ng/mL and 470 ng/mL, respectively. The ratios between obtained and expected values were 94% and 123%. The results for adding different masses of feces to the starting solution are reported in Figure 2; variation coefficients were <2% for all measurements in duplicate. After an initial increase of the Hb concentration, the results were steady up to 10 mg. A further increase of values was observed at 20 mg of feces. The effects of different amounts of fecal material on the Hb measurements, investigated in 3 commercial buffers used by quantitative methods based on latex immunoagglutination and developed on the OC-Sensor system (OC sensor reagents and Diana instruments) are shown in Table II.
Effect on hemoglobin concentration by addition of different amounts of feces in 3 different commercial buffers
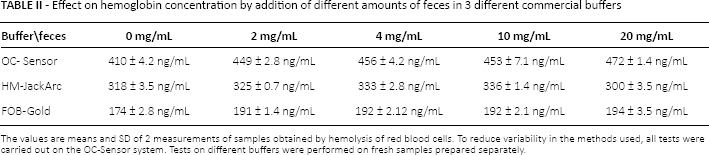
The values are means and SD of 2 measurements of samples obtained by hemolysis of red blood cells. To reduce variability in the methods used, all tests were carried out on the OC-Sensor system. Tests on different buffers were performed on fresh samples prepared separately.
An increasing of the Hb values was observed with the initial addition of feces, whereas no differences were registered in the range of 2 to 10 mg of feces. The means and SD for the control materials run on the analytical system used in the study period were LV1 = 119 ± 1.1 mg/L and LV2 = 386 ± 4.2 mg/L (acceptance limits reported by the manufacturer: LV1 = 104-150 mg/L; LV2 = 368-398 mg/L).
Discussion
The texture of fecal materials and design of the probes of the SCDs used in quantitative FIT-Hb analytical systems significantly affect the mass of collected materials. But the relationships between fecal texture and sampling devices are not reported in the literature, and requirements to harmonize fecal collection devices have not yet been recommended to manufacturers. All manufacturers have direct experience in fecal sampling and the effect of fecal materials on their analytical systems, but until now, used have not proposed any requirements. The relationships between the design of the sample collection region of the probes and the amount and imprecision of the feces collected with the different SCDs are confirmed by the present data. Significant differences were observed between the values declared by the manufacturers and the recovered materials. For the devices tested, the ratio between collected feces and target values reported by the manufacturers ranged from 71% to 119%.
It is probable that, considering the spread of the specific weight of fecal material, the overall variability of SCDs was higher than that reported in this study. However, exhaustively investigating this source of imprecision was not one of the aims of the present study. Based on these data, variations in the Hb results can be expected as a consequence of samples' texture. In fact, as reported in Table I, the texture of samples affected the overall amounts of collected material, and different amounts of feces gives rise to different analytical results (Tabs. I and II). It is important to note that the collection of different amount of feces positive for Hb can give different analytical results that may result in different clinical recommendations.
The harmonization of fecal sampling could be obtained using SCDs that are similar in design, with similar volumes of feces collected and similar sample to buffer ratios. Our results could be considered as providing support for the argument that manufacturers should design their devices to collect the same mass of materials. The main problem for supporting this strategy is related to the differences in relative densities of collected materials, and therefore, it is difficult to argue for requirements for this purpose. However, this requirement could be supported through consideration of the sample volumes collected in the devices. Such volumes could be reported in milliliters or cubic millimeters of feces, as recently suggested (14).
Considering the ratios between the mean amount of feces collected and the sampling volumes obtained (recovered, in Tab. I), it seems that no specific attention has been paid by manufacturers to correctly address the amount of collected materials.
The use of low target amounts may be a source of significant increases in sampling variability (the amount of feces is the denominator in the ratio). Moreover, when using low target values. The residual material, on the top of the probe, significantly affects the overall variability. As indicated by the data for the HM-JackArc sampling device.
The collection of large amounts of feces may be cause by a loss of handling of SCDs, and increase of interferences on analytical methods. Therefore, the choice of many manufacturers to use 10 mg of material seems to be an useful solution. A fruitful target would be a probe capable of collecting 10 mg of feces, corresponding to a fully accessible and clean sampling volume of 10 mm3.
The timing of the dissolution of the material is related to the shape of the SCD, and it may be up to 2 hours in the presence of lumps of about 1 mg. However, this is not a real problem, considering that FIT-Hb is intended for screening programs and for the assessment of symptoms, where samples are collected at home and transported to a laboratory for analysis. In consequence, considering the variability and difficulty to obtain an appropriate sample, how patients use the device is crucial to harmonizing the preanalytical phase, and great attention should be paid by those preparing instructions for use and by manufacturers for home-sampling support. This consideration should be strongly supported at a scientific level, and it should be better endorsed by specific legislation that makes it mandatory for companies operating in Europe. Addition of feces to the buffer in the SCDs induces significant variation in color, pH and ionic strength. In addition, enzymes and insoluble fibers are added to the solution. All of these factors have the potential to affect the chemical reactions and results of the analytical system. Data on the buffer investigation, reported in Table II, confirm the effect of feces concentration on the analytical results. As reported in Table II, an improvement in Hb values was observed after the addition of feces in all buffers. This change was probably related to the variation of protein structure due to the change of medium characteristics, and similar results may be expected performing samples on the related analytical systems. Other significant factors, arising from this data, include the adoption of an optimal feces to buffer ratio specific for each analytical system.
All of these characteristics have been taken into account by manufacturers, who have introduced specific solutions regarding feces to buffer ratio and master curves to assess the Hb concentrations in feces: as a consequence, different available SCDs have differences of up to 20 times between the sampled materials and the buffer used (2). All manufacturers have direct experience of fecal sampling and of the effects of fecal materials on their analytical systems, but until now, users have not proposed requirements.
The amount of collected material, buffer composition and measurement systems represent close systems, and it is therefore difficult to investigate performance characteristics from an analytical point of view using the standard comparative protocols usually adopted in laboratory medicine (10). Standardization of the analytical phase of FIT-Hb is linked to the use of the hierarchy of methods and materials for traceable analysis of Hb concentration (2), which should be feasible considering the knowledge we have of the Hb molecule. In addition, although obtaining a master calibration curve based on a reference Hb standard and a reference volume of Hb-free feces would be difficult to achieve, it would nevertheless be very important.
Finally, as in all other fields of laboratory medicine, preanalytical harmonization represents a basic prerequisite to ensure uniformity and comparability of epidemiological data, and it may be obtained by introducing a target volume of sampled material and, ideally, a single design for the SCDs. Problems related to textures, the effect of diet and physiology on relative density of feces, as well as the intermittency of bleeding and lack of uniformity of Hb in feces cannot, of course, be eliminated by harmonization of SCDs. Harmonization of sampling procedures represents the starting point in quantitative measurements. All efforts in this direction legitimate by the aim to reduce dispersion of results provided by different methods and facilitate clinical uses and the comparability of epidemiological data (15). Positive effect of sampling harmonization may arise from an increased uniformity of responses from the population studies (14), and in easier and faster procedures to develop reference and decision-making values for new diagnostic tests on fecal materials (15-17).
In 2018, the ISO 15189 standard should be adopted by medical laboratories in Europe. Considering the lack of information on the preanalytical phases of the FIT-Hb methods and the absence of consistent units of measure. In both preanalytical and analytical phases of fecal testing, the achievements of these standards would appear to be a difficult challenge for medical laboratories.
Standardization and harmonization steps for both preanalytical and analytical phases of fecal testing are not achieved by the available methods, and laboratories must themselves collect the large part of the information required to fulfill the ISO requirements. Metric parameters used in the preanalytical phase and in data reporting for FIT-Hb tests (μg Hb/g of feces), do not allow us to provide the information required to harmonize the sampling phase, whereas the use of volumes of feces collected may represent a consistent units of measure (13).
Scientific societies should make a significant effort to provide effective strategies to harmonize and assure the quality of the FIT-Hb and of other fecal tests.
Footnotes
Financial support: The present investigation was supported by a grant from the Italian Society of Clinical Biochemistry and Clinical Molecular Biology (SIBioC), on behalf of the Clinical Chemistry Harmonization Programmes.
Conflict of interest: None of the authors has any financial interest related to this study to disclose.