
Abstract
Purpose
Influence of therapeutic thoracentesis on the pleural pressure (Pp) has been discussed in many clinical studies, however reasons of Pp changes are not precisely established. The aim of the study was to use a previously elaborated virtual cardiopulmonary patient (VP) in analysis of impact of physiological factors on Pp during the procedure.
Methods
Simulations were performed on VP with default values of parameters for which VP simulated the respiratory system of the average 50-year-old healthy Polish woman according to spirometric examination. Alterations of Pp and the amplitude of Pp changes related to breathing (AP) were analyzed. Model parameters related to chosen factors were deviated from their default values to analyze the degree of their impact on Pp and AP. The analysis was based on and supported by our own clinical data.
Results
The Pp and AP alteration intensity appeared to be most sensitive to the compliances of the rib cage and mediastinum, and the nonlinearity of the dependence between the recoil pressure and the lung volume: the lower the compliances and the higher the nonlinearity were, the deeper the Pp fall during the procedure and the bigger the AP increase were observed.
Conclusions
Experiments in silico are very useful in analyzing sophisticated physiological and medical problems. They made it possible to show which factors are particularly responsible for changes in Pp during thoracentesis. In the future, they may be useful in establishing objective conditions under which thoracentesis needs to be stopped.
Introduction
It has been estimated that about 1.5 million patients with pleural effusions are diagnosed each year in the USA. Thoracentesis is a pivotal diagnostic and therapeutic procedure in patients with pleural effusion (1). The annual number of thoracenteses performed in United States was reported to be between 124,000 and 178,000 (2). Therapeutic thoracentesis may alleviate symptoms and improve respiratory system (RS) functioning but it is associated with the risk of various complications, including life threatening re-expansion pulmonary edema (3). Extreme and abrupt changes in pleural pressure can negatively affect the work of the cardiopulmonary system. Therefore, determinants of effective and safe pleural fluid withdrawal should be elucidated to improve patient comfort and to minimize the risk of complications.
A large body of data have already been published on different aspects related to therapeutic thoracentesis (4, 5) that also include our work (6). However, due to both ethical restrictions and technical limitations, not all types of studies can be performed in patients. Similarly, there are limitations in using animal models and with data transition from animal models to the clinical setting. Hence, experiments in silico have recently been recommended and intensively developed (7). In accordance with this trend, we undertook attempts to analyze phenomena associated with pleural fluid withdrawal using our virtual patient that was previously developed (8–12).
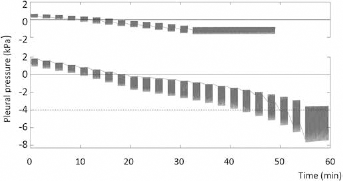
This study was based on our own clinical data. As shown in Table I, there was significant variability in the fall of pleural pressure since the standard deviation for the mean pressure just after the thoracentesis end increased over 3 times in comparison with the standard deviation for that pressure measured before the procedure. The pressure fall was very slightly correlated with the withdrawn fluid volume; thus, differences in this volume were not responsible for the pressure fall variability. Moreover, the correlation was negative, which suggested that some other factors determined the fall and if it was too big, the procedure had to be stopped because of patient's symptoms giving a lower withdrawn volume (Fig. 1), hence the negative correlation. Note that even the pressure measured after the procedure was not strongly correlated with the initial pressure. Also the effusion volume had no influence on the pressure fall (ANOVA, p>0.53). It thus appeared that some patient properties must have an impact on pleural pressure changes. Therefore, the aim of this study was to analyze which physiological factors could be responsible for such wide variability in patterns of pleural pressure changes during pleural fluid withdrawal (Fig. 1).
Clinical characteristics of real patients who underwent thoracentesis
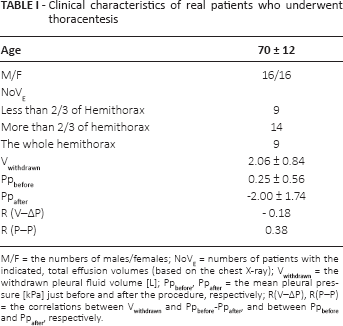
M/F = the numbers of males/females; NoVE = numbers of patients with the indicated, total effusion volumes (based on the chest X-ray); Vwithdrawn = the withdrawn pleural fluid volume [L]; Ppbefore, Ppafter = the mean pleural pressure [kPa] just before and after the procedure, respectively; R(V–ΔP), R(P–P) = the correlations between Vwithdrawn and Ppbefore -Ppafter, and between Ppbefore and Ppafter, respectively.
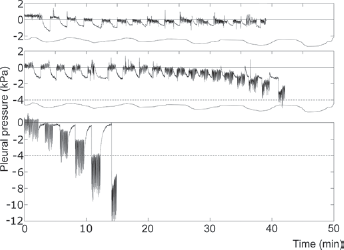
Examples of graphs of the pleural pressure measured in real patients showing variety of changes during therapeutic thoracentesis. The lower case is an example when the procedure had to be stopped earlier due to symptoms, hence the negative correlation in Table I.
Materials and methods
Virtual patient
Our virtual patient, which was previously developed, described and used in several applications (9–14), consists of several models cooperating with each other: models of the RS mechanics (9), gas transport and exchange (10), and the pulmonary circulation (8) are the main ones. According to spirometry (12), the virtual patient with the default values of models parameters corresponds with the average 50-year-old Polish woman according to the Polish reference values (15).
The model of the RS mechanics had to be modified to enable simulations of therapeutic thoracentesis. First, instead of the previous partition of lungs into 80 parts reflecting lung anatomy (12, 16), each lung was divided into horizontal layers, which enabled simulation of hydrostatic pressure exerted by the fluid column at different levels of the lung. The number of layers should be neither too big because of the simulation time nor too small due to simulation precision. Initial simulations showed that 100 is the optimal number.
Previously, the thoracic cavity was treated as 1 visco-elastic element, which was sufficient for earlier applications. However, effusion acts differently on the rib cage, diaphragm and abdomen, and therefore these 3 anatomical structures had to be included in the model as the following 3 separate compartments:
the rib cage: a visco-elastic element in series with a pressure source simulating the activity of intercostal muscles;
the abdomen: a visco-elastic element;
2 hemidiaphragms: elastic elements with variable compliance; the compliance change corresponds to the hemidiaphragm activity, which is analogous to heart modeling by means of the variable elastance function (17).
Parameters of the nonlinear equations related to elastic properties of the above elements were established on the basis of data published by Konno and Mead (18). Other details of our virtual patient have been presented elsewhere (9–14); however the equations most important for this study are briefly described in the Supplementary material available online at www.artif-organs.com.
Figure 2 presents the block diagram of the model of the RS mechanics that was used in this study.
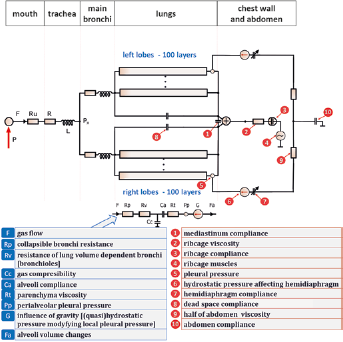
The block diagram of the used model of the respiratory system mechanics. The following elements represent nonlinear equations with 2–4 parameters: Ca, Rp, compliances of ribcage, abdomen, and hemidiaphragms; the other elements represents single-number parameters either constant (e.g., the resistance of the trachea R) or dependent on some variables (e.g., Cc depends on the current volume of alveoli). See the text for more details and the Supplementary material for equations.
Clinical data collection
The aim of the study was derived from our own clinical data (e.g., Fig. 1). They were collected during a prospective study (6) approved by the Institutional Review Board of the Medical University of Warsaw and registered at ClinicalTrial. gov (NCT02192138). The data were registered during 40 procedures of therapeutic thoracentesis performed in patients treated in the Department of Internal Medicine, Pulmonary Diseases & Allergy, Medical University of Warsaw (Tab. I contains data for only 32 patients because of some data lacking for the others). All procedures were performed in spontaneously breathing, conscious and able to communicate patients, in a sitting position.
Small pleural catheter (TurkelTM Safety System; Covidien) was inserted into the pleural cavity in the dependent region under direct control of transthoracic ultrasound. To avoid a displacement of the short intrapleural part of the catheter, it was tightly fixed to the chest wall with the skin suture. To measure the instantaneous pleural pressure, our digital manometer, developed previously (Nalecz Institute of Biocybernetics and Biomedical Engineering, Polish Academy of Sciences) was connected to the pleural catheter via a 3-way stopcock as described elsewhere (19). The pressure was measured and registered at baseline, and then immediately after withdrawal of the consecutive predefined volumes of the pleural fluid: every 200 mL up to a total volume of 1,000 mL and then every 100 mL (6) (see Fig. 1 for the time course).
Simulation procedures
To imitate the protocol of measurements applied during therapeutic thoracenteses in the clinical settings described above, intervals of pleural pressure registration alternated with periods of pleural fluid withdrawal. Only the end-expiratory pleural pressure, i.e., the pressure at the functional residual capacity (PFRC), and the amplitude of pressure changes during a respiratory cycle (AP) were analyzed. PFRC defines the current working point of the RS, and AP is a major determinant of breathing work. Thus, these 2 parameters are key variables describing the mechanical activity of the RS.
The impact of the following factors on PFRC and AP was assessed:
The abdomen compliance (component 10 in Fig. 2).
The specific compliance of the lung parenchyma characterizing elastic properties of the lung tissue. In the model, this compliance corresponds to a coefficient in the equation that is represented by ‘Ca’ in Figure 2 (see the Supplementary material for the equation available online at www.artif-organs.com).
Nonlinearity of the dependence between the lung volume and the transpulmonary pressure (Ptp). The nonlinearity degree depends on another coefficient in the equation represented by ‘Ca’ in Figure 2.
The rib cage compliance represented by the component 3 in Figure 2. Note that although the nonlinear dependence between the rib cage volume and the trans-wall pressure is described mathematically by means of an equation with 3 parameters (see the Supplementary material), only the parameter that has significant meaning for the dependence for bigger volumes is taken into account here.
The mediastinum compliance (rarely discussed by other authors) represented by component 1 in Figure 2.
Airway obstruction such as in asthma or COPD. The equation that describes the dependence of airflow on pressures has been derived previously (9), and obstruction is simulated by means of an increase in one of equation parameters (see the Supplementary material).
To investigate the influence of an individual factor on PFRC and AP, 2 simulations were performed for that factor. The model parameter corresponding to the factor was decreased from its default value in the first simulation and then increased in the second simulation; the other parameters had still the default values. In the case of obstruction, very severe obstruction was tested against normal airways. The degree of parameters changes are shown in the Table II. If noticeable differences between these 2 simulations for a factor were observed, this factor was recognized as having significant influence on the patient condition during the therapeutic thoracentesis. Additionally, such simulations were performed for moderate and large volume pleural effusions (1.5 and 3 L, respectively) to analyze whether the impact of a particular factor on PFRC and AP depends on the pleural fluid volume.
Differences in the end-expiratory pleural pressure and the amplitude between two simulations at the end of the procedure

% = decreased and increased parameter values shown as the percentage of the default value; C = compliance; LPSC = lung parenchyma specific compliance; ΔPFRC = the absolute difference between the end-expiratory pleural pressures at the procedure end for the increased and decreased values of the parameter; AP/AP = the ratio of the greater amplitude to the smaller one; 1.5 L, 3 L = the effusion volume.
During the presimulation period, the fluid was introduced into the pleural space in the right hemithorax. This maneuver resulted in collapse of those layers for which local pleural pressures were higher than the atmospheric pressure (Patm) because of the hydrostatic pressure of the fluid column.
The impact of the therapeutic thoracentesis on arterial blood gases was not considered, and therefore the minute ventilation during simulations was not controlled by the arterial tensions of CO2 and O2 but was adjusted to keep the alveolar ventilation at a constant level.
Although in real patients each factor deviates more or less from its population average, simulations for concurrent deviations of 2 or more factors cannot be present because of too great a number of combinations. Therefore, only 1 example will be shown.
Results and discussion
The clinical characteristics of patients who underwent therapeutic thoracentesis with pleural pressure measurement are presented in the Table I. The impact of the analyzed factors on PFRC and AP at the end of pleural fluid withdrawal is presented in Table II: (a) since the absolute value of the pleural pressure is related to the risk of such side adverse effects as edema, for example, the absolute fall of PFRC is shown; (b) as the AP value is approximately proportional to the breathing work, relative changes in AP present changes in the work.
Figure 3 shows differences in pleural pressure changes during the whole procedure. Variable effects were observed: from almost no impact (abdomen compliance) to very strong influence of the nonlinearity on AP (at the end of the procedure, AP was 2.8 ÷ 3.2 times greater for high nonlinearity) or of the lung parenchyma specific compliance on PFRC. The impact of the rib cage and mediastinum compliances was particularly stronger for the large volume effusion in comparison with the moderate one.
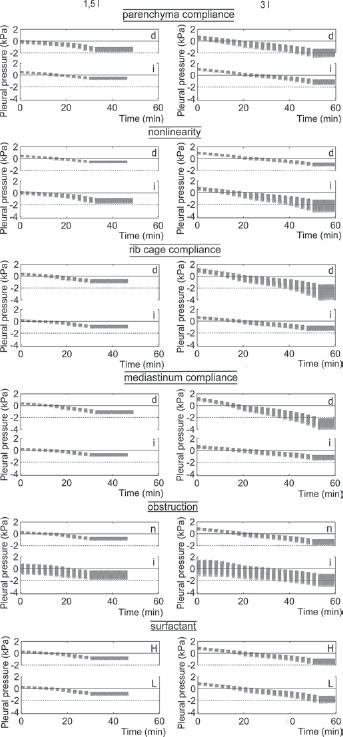
Results of simulations: graphs of the pleural pressure during thoracentesis. d, i = simulations for the value of the indicated parameter decreased and increased, respectively, in comparison with the default value; n = the default value (no obstruction); L, H = low and high rates of the surfactant production, respectively. The left and right columns = pleural pressure graphs for effusion of 1.5 L and 3 L, respectively.
Figure 4 shows examples of simulation for deviations of 2 parameters from their default values.
Results of simulations: examples of the pleural pressure graphs when 2 parameters were deviated from their default values. The upper and lower graphs show effusion at 1.5 L and 3 L, respectively; the examples concern high nonlinearity and low mediastinum compliance (the other parameters were set at their default values).
The fact that all the parameters are known and all variables can be observed is the main advantage of computer models. This fact enabled us to explain the results of the simulations. We believe that the same interpretation of pleural pressure changes is accurate for real patients as well.
Lung parenchyma specific compliance
Lung parenchyma specific compliance affected both PFRC and AP. For lower compliance: (a) lower PFRC and higher AP were observed, (b) PFRC fell and AP increased more significantly. That was because when this compliance was lower: (a) a higher AP was necessary to inspire the same tidal volume; (b) Ptp was higher for FRC, and thus PFRC had to be lower when Ptp was higher since PFRC = Patm - Ptp (in fact, PFRC = Patm - Ptp + PE, where PE is the hydrostatic pressure of the effusion at the point of measurement, however PE will be omitted in the discussion as it is not related to patient physiological properties).
Nonlinearity
Nonlinearity had a relevant impact on both PFRC and AP. That is because the space in the pleural cavity corresponding to the volume of withdrawn pleural fluid has to be replaced, at least in part, by expansion of the ventilated lung regions. If the nonlinearity is high, i.e., the lung compliance falls significantly with lung expansion, then this expansion is associated with: (a) a significant increase in Ptp, and thus PFRC has to decrease significantly since PFRC = Patm - Ptp; (b) inspiration of the same tidal volume requires higher AP.
Rib cage compliance
The compliance of the rib cage significantly affected changes of both PFRC and AP during therapeutic thoracentesis when large baseline pleural fluid volume was applied (Tab. II, Fig. 3). This is because if the compliance is low, the thoracic wall is unable to expand to increase sufficiently the hemithorax volume in response to large pleural fluid accumulation, which causes the collapse of more lung regions. After fluid withdrawal, ventilated regions of smaller total volume have to expand more, leading to a significant drop in PFRC and increase in AP due to the phenomena described in the above sections on lung compliance.
Mediastinum compliance
Although the role of mediastinum is rarely considered in the literature on pleural effusion and therapeutic thoracentesis, its low compliance seems to have a significant impact on both PFRC and AP in patients with large volume pleural effusion (Tab. II). The mechanisms of the impact of a stiff rib cage and mediastinum appears to be similar. A stiff and fixed mediastinum restricts expansion of the pleural cavity associated with pleural fluid accumulation, which causes the collapse of more lung regions. If this compliance is high, the pressure of pleural fluid causes the contralateral shift of the mediastinum and compression of the contralateral lung, and, in consequence, neither the ipsilateral nor the contralateral lung is compressed strongly enough to cause the collapse of larger lung volumes. Note that, on the one hand, radiation therapy of cancers can make the mediastinum stiff (20) and, on the other hand, a cancer is the most frequent reason for pleural effusion. Thus, mediastinum compliance should be always taken into account.
Airway obstruction
Airway obstruction affected both PFRC and AP. In comparison to healthy airways, severe obstruction was associated with an increase in PFRC. The rise of PFRC can be explained by lung hyperinflation, which is common in patients with severe COPD or asthma. The increase in PFRC was approximately equal to the intrinsic PEEP (positive end-expiratory pressure), since it is a consequence of hyperinflation.
Airway obstruction was also associated with higher AP because the hyperinflation resulted in a shift of the working point to a higher lung volume, for which the lung compliance was lower because of the nonlinearity. In consequence, a larger AP was necessary to maintain the same tidal volume. Additionally, increased inspiratory effort was necessary to overcome high airway resistance.
An interesting phenomenon was observed during simulation of large volume pleural fluid withdrawal: in contrast to the other simulations, a decrease in AP was observed. This seemingly surprising result can be explained when the volume of the anatomical dead space, i.e., the sum of all bronchi volumes, is taken into account (note that this is simple in the model but it would be impossible in real patients during the procedure). Namely, fluid withdrawal results in expansion of both ventilated lung regions and obstructed bronchi leading to a decrease in the obstruction severity. This phenomenon is analogous to the effect of lung volume reduction surgery (21), which improves ventilation in patients suffering from COPD.
It should be mentioned that an increase in the dead space required an increase of the minute ventilation (to maintain the alveolar ventilation), which was an additional cause of an AP increase in all simulations.
In general, with the exception of a few cases, lower PFRC and higher AP at the end of the withdrawal were observed in large volume pleural effusion in comparison with the moderate effusion. This was caused by the collapse of a greater part of the lung in the large effusion. In consequence, the total lung compliance decreased because it is equal to the specific compliance of lung parenchyma multiplied by the ‘amount’ of the parenchyma in ventilated lung regions (see the Supplementary material for explanation available online at www.artif-organs.com).
Study limitations
This study has some limitations related to both the model and the simulations. The fact that all layers are joined to the mediastinum is the main imperfection of the model. In real humans, the lower lung parts are not fixed to the mediastinum. In consequence, if small or moderate volume effusion accumulates in the pleural cavity, they float on the fluid with no significant compression or collapse. Unfortunately, it has been extremely difficult to take into account details of both the geometry and mechanics of the RS.
Keeping the respiratory rate and alveolar ventilation constant without respect to possible changes of the arterial CO2 and O2 tensions during the thoracentesis was the main limitations related to the procedure of simulation.
In our opinion, the rate of surfactant delivery during expansion of ventilated and recruited lung regions may have strong impact on both PFRC and AP. Indeed, as those regions expand, the surface of alveoli increases and, in consequence, the surface concentration of surfactant decreases leading to an increase of the lung compliance. If the surface concentration cannot attain a normal value quickly, changes in PFRC and AP similar to those for increased lung parenchyma specific compliance should be observed. Unfortunately, although the RS model contains a 3-compartmental module of the pulmonary surfactant (type II pneumocytes as the surfactant source, lamellar bodies and fluids as repositories, and surface film directly affecting the compliance), only initial simulations could be performed (Fig. 3) due to a lack of necessary data.
The above limitations would have significant meaning if a precise quantitative analysis was intended. However, this study was an initial qualitative analysis, rather, performed mainly to show and explain a variety of possible physiological factors affecting PFRC and AP during thoracentesis. In the future, simulations might help to establish the optimal objective conditions under which thoracentesis should be performed. Currently, they may have significant educational meaning.
Conclusions
Simulations showed that several physiological factors play a role in changes of the pleural pressure associated with therapeutic thoracentesis. The compliances of the rib cage and mediastinum along with the nonlinearity of the dependence between the transpulmonary pressure and lung volume seem to be the most important factors.
Footnotes
Acknowledgments
The authors thank Krzysztof Zieliński, PhD Eng., Krzysztof J Pałko, PhD Eng., and Monika Zielinska-Krawczyk MD, for their assistance during the clinical phase of the study.
Financial support: This study received financial support from the Polish National Science Centre (research project No. 2012/05/B/NZ5/01343) and the Nalecz Institute of Biocybernetics and Biomedical Engineering.
Conflict of interest: None of the authors has financial interest related to this study to disclose.