
Abstract
Background
Brain natriuretic peptide (BNP), N-terminal-proBNP (NT-proBNP), and high sensitive cardiac troponin T (TnT) are markers that are elevated in chronic kidney disease and correlate with increased risk of mortality. Data are conflicting on the effect of biomarker levels by hemodialysis (HD).
Our aim was to clarify to what extent HD with low-flux (LF) versus high-flux (HF) membranes affects the plasma levels of BNP, NT-proBNP, and TnT.
Methods and Materials
31 HD patients were included in a crossover design, randomized to start dialysis with a LF-HD or HF-HD dialyzer. Each patient was his/her own control. The dialyses included in the study were the first treatments of two consecutive weeks with each mode of dialysis. Patients normally on hemodiafiltration (HDF) also performed a HDF the third week. Values after HD were corrected for extent of ultrafiltration.
Results
During LF-HD the biomarkers NT-proBNP and TnT increased (15 versus 6%, P≤.001) while there was a slight decrease in BNP (P<.05). During HF-HD the NT-proBNP, BNP and TnT levels decreased (P≤.01 for all). During HDF all three markers decreased (P<.01 for all). The rise in TnT during LF-HD correlated with dialysis vintage (months on HD, r = .407, P = .026), Kt/V-urea (r = .383, P = .037), HD time in hours/treatment (r = .447, P = .013) and inversely with residual urinary output (r = -.495, P = .005). The baseline levels of BNP and NT-proBNP correlated with blood pressure.
Conclusions
Cardiac biomarkers increase slightly during LF-HD. A HF-HD eliminates the biomarkers and can mask increases caused by, e.g., myocardial infarction.
Introduction
Patients on chronic hemodialysis (HD) suffer from an increased risk for morbidity and mortality, and the main cause of death is cardiovascular disease (1). Many uremic solutes are retained in the body of these patients (2). Besides retention of uremic solutes, patients with poor urine output suffer from water retention. Excessive water retention results in interdialytic weight gain (IDWG) that is a prominent risk factor for cardiovascular events (3). Other variables are malnutrition and inflammation that by themselves increase the risk for atherosclerosis (4). In general, the heart suffers from these alterations and moves into a progressive congestive heart failure and cardiomyopathy (5). Natriuretic peptides, B-type natriuretic peptide (BNP), and N-terminal proBNP (NT-proBNP) are markers for such involvement (6).
BNP is a cardiac neurohormone that is secreted from the ventricles in response to ventricular volume expansion and pressure overload (6–9), and it is released in bursts due to upregulation of the BNP mRNA as a response to stretching of the myocardial wall (10, 11). A precursor is produced as a 108 amino acid long peptide and is cleaved into 2 parts, the active 32 amino acid BNP with a molecular weight of 3.5 kDa and the inactive NT-proBNP with a molecular weight of 8.5 kDa (12).
The main effects of BNP are vasodilatation, natriuresis, and diuresis (10). BNP is cleared by binding to the natriuretic peptide receptor C (NPR-C), which mediates receptor-mediated endocytosis and lysosomal degradation (8, 10, 12). BNP is also degraded by neutral endopeptidases that are present in renal tubular cells and cells in the vascular walls (8, 10, 12). The kidney is thought to excrete NT-proBNP, which has a half-life of approximately 120 min compared to 20 min for BNP. The different half-lives and clearance mechanisms explain why the levels in serum are much higher for NT-proBNP than BNP although NT-proBNP is excreted in a 1:1 ratio (10).
Patients with chronic kidney disease (CKD) and especially those on dialysis have increased levels of natriuretic peptides (13–17).
The changes in BNP levels over time may be a greater risk marker than baseline BNP (18). Of note is that NT-pro-BNP levels in renal failure are strongly inversely related with renal function (19). In patients with CKD the BNP and NT-proBNP levels were shown to correlate well with echocardiographic findings such as left ventricular filling pressure (20), left atrium size, and left ventricular mass index (14), although not with left ventricular ejection fraction (14, 21). Others, however, found no such correlations (22). The elevated levels of NT-proBNP and BNP in patients on dialysis have been explained not only by cardiac dysfunction/hypertrophy but also by volume overload (6, 17, 21, 23, 24). However, others found no correlation with ultrafiltration volume and excluded a role for acute fluid removal on BNP and NT-proBNP regulation (25). Another marker is the cardiac troponin T (TnT) that is frequently raised in HD patients. Notable is that TnT has molecular size of 37 kDa but also exists as fragments ranging in size from 8 kDa to 30 kDa (26, 27), and troponin I has size between 21 kDa to 24 kDa (28). The cardiac markers are all predictors of increased risk of mortality (13, 17, 18, 21, 24, 29–32).
Hemodialysis studies of cardiac biomarkers present conflicting results, with either increasing, decreasing, or stable values post-dialysis as compared to pre-dialysis (16, 17, 22, 33, 34) (16, 34–39). Even when measuring NT-proBNP and BNP in dialysate the results are conflicting (38, 40). The differences in results were interpreted as probably due to hemoconcentration (40). Previous studies included different groups of patients and dialyzers, and the question for the clinician remains whether the dialysis itself, the ultrafiltration, or some other variable within the individual patient affects changes in cardiac biomarkers during hemodialysis.
The aim of this study was to clarify to what extent the cardiac biomarkers mentioned above are altered by hemodialysis with low-flux versus high-flux membranes using the same group of patients and adjusting for volume changes.
Materials and Methods
The design was a randomized, cross-over study in which the same patient acted as his or her own control. The patients included were on chronic hemodialysis (HD). Patients unable to provide informed consent were excluded. All other patients were informed and invited to participate in the study. Out of 49 patients, 34 chose to participate. Of these, one received a transplant during the period and was therefore excluded. An additional patient was excluded due to acute illness and another due to an inability to keep up with the dialysis schedule. The remaining 31 patients (not selected but consecutively accepting to participate in the study) were eligible for participation in the study. All of these were included in the chronic hemodialysis program routinely ongoing at the local hospital. Each patient was randomized to start with either a low-flux (LF) or a high-flux (HF) dialyzer in a cross-over design to eliminate the inter-individual variations using paired analyses. For baseline data, see Table I. The local Ethical Committee approved the study (Dnr 2012-42-31M, approved March 6, 2012).
Baseline characteristics of patients participating in the study
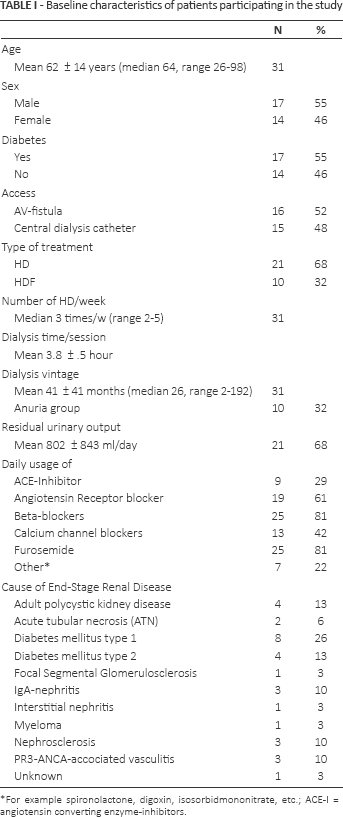
For example spironolactone, digoxin, isosorbidmononitrate, etc.; ACE-I = angiotensin converting enzyme-inhibitors.
The following polysulfone dialyzers were used: FX10 (low-flux, LF), FX 80 (high-flux, HF), and FX 1000 (high-flux used for hemodiafiltration, HDF) manufactured by Fresenius Medical Care, Hechingen, Germany. Their efficacy, tested in vitro by blood flow 200 ml/min, is according to the manufacturer for FX 10 an ultrafiltration coefficient (UFc) of 14 ml/h x mmHg with an effective surface of 1.8 sqm and for FX 80 an UFc of 59 ml/h x mmHg and effective surface of 1.8 sqm.
The dialyses included in the study were the first treatments each week of 2 consecutive weeks with each mode of dialysis. The following week, the dialyzer was exchanged randomly, so that all patients underwent 1 treatment using the LF filter and 1 using the HF dialyzer. For patients normally on hemodiafiltration (HDF), a third session was performed using HDF and a high-flux FX 1000 filter with an UFc of 75 ml/h x mmHg and effective surface of 2.2 sqm (Fresenius Medical Care, Hechingen, Germany). All tests were performed before and after the first dialysis of the week during 2 (3) consecutive weeks. All patients received dialysis using their individual regular schedule and regular dialysates. This means that each patient received hemodialysis to the same extent (duration in minutes/session, blood flow, dialysate flow, sodium and bicarbonate profiles). Throughout the study, blood samples for all analyses, except for BNP, were collected from the arterial part of the tubing system and immediately sent to the certified laboratory of the hospital. Analyses were based on the laboratory's ordinary routines. Blood samples for BNP analyses were drawn from the dialysis access before and after termination of the HD session, centrifuged and stored at −80°C until analysis.
Although some biological functions are the result of BNP release, these known effects are limited for NT-proBNP and TnT. We therefore decided to call these substances cardiac markers and not mediators. Others also use the terminology ‘markers’ widely. Thereby NT-proBNP (ng/l) is considered a marker for myocardial tissue tension, and high sensitive cardiac troponin-T (ng/l) as a sensitive marker for myocardial tissue damage (i.e., myocardial infarction). The Cobas® test for analysis of the high sensitive cardiac Troponin T (TnT) was provided by Roche (41). The molecular size of the cardiac TnT was by the manufacturer referred to be 39.7 kDa (41). Blood samples for BNP (ng/l) were collected separately into plastic plasma tubes, centrifuged, and kept in the freezer (-80°C) until analysis. BNP was analyzed using the Triage MeterPro (Alere, San Diego, California, USA). Other variables studied were serum urea, albumin, blood hemoglobin (Hb), and erythrocyte volume fraction (EVF).
Systolic blood pressure (SBP), diastolic blood pressure (DBP), mean arterial pressure (MAP), pulse pressure (PP), pulse, weight, and variables concerning the dialysis treatment (blood flow, dialysate flow, ultrafiltration rate (UF-rate), ultrafiltration volume (UF-vol), dialysate calcium, potassium, sodium, bicarbonate, dialysate temperature, treated blood volume and time) were recorded. Interdialytic weight gain (IDWG) is the increase in weight between dialyses due to fluid retention. If the target weight is achieved with the previous dialysis the IDWG is usually equal with the ultrafiltration volume. Background information concerning diagnosis, diabetes mellitus (all insulin dependent), daily usage of antihypertensive medication, dialysis vintage (time on hemodialysis, here in months), residual urinary output and dialysis access was retrieved from patient records. We decided to divide patients with a urine volume of ≤500 ml/day, and those with urine volumes above 500 ml/day.
Body weight was defined as the “target weight” prescribed by the physician at the dialysis unit.
Data were analyzed using SPSS 18 (PASW Statistics for Windows, Version 18.0. Chicago: SPSS Inc.). We used non-parametric tests, Wilcoxon signed rank test for paired samples and Mann-Whitney U test for independent samples. Correlations were made using Spearman's Rho to exclude false assumptions by outliers. Values are expressed as mean ± SD if not stated otherwise.
BNP, NT-proBNP, and cardiac troponin-T (TnT) values after dialysis were adjusted for changes in concentration due to eventual hemoconcentration caused by ultrafiltration; this was done using the change in the serum protein, here selectively the albumin concentration (42) and also by adjusting for the change in EVF. The following formula was used: adjusted NT-proBNP = actual NT-proBNP after/(serum albumin after/albumin before). The same formula was used for adjustment of ultrafiltration in erythrocyte volume fraction (EVF). These values were used for further calculations and expressed in the text as “NT-proBNP after”. The correlation between the correction methods was 0.85 (p<0.001).
Changes in NT-proBNP are expressed as ΔNT- proBNP = adjusted value of NT-proBNP after - NT-proBNP before. Changes in NT-proBNP levels in per cent were defined as (ANT-proBNP/NT-proBNP before) x 10. The same calculations were made for troponin-T and BNP. The relation between the filtered volume and the body weight of the patients (UF%) was calculated as (UF-vol in l/target body weight in kg) x 10. Differences were considered significant if P<.05.
Results
Baseline characteristics are described in Table I. Changes in the concentration of cardiac markers in plasma before and after various modes of dialyses are shown in Table II. All changes remained significant even after adjusting for changes in EVF or hemoglobin (43), or in change of albumin.
Mean concentration (± SD) of markers of cardiac strain
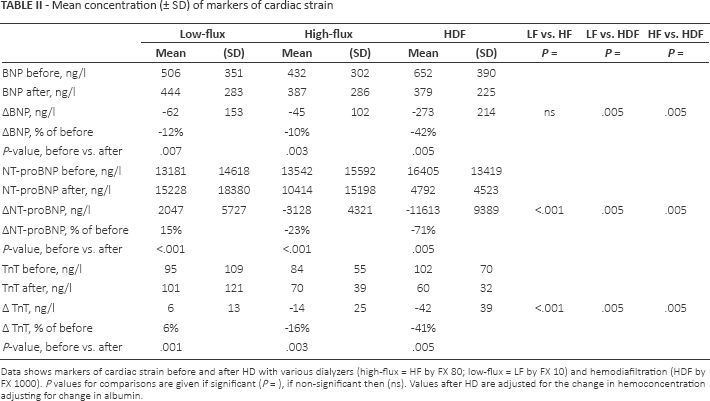
Data shows markers of cardiac strain before and after HD with various dialyzers (high-flux = HF by FX 80; low-flux = LF by FX 10) and hemodiafiltration (HDF by FX 1000). P values for comparisons are given if significant (P =), if non-significant then (ns). Values after HD are adjusted for the change in hemoconcentration adjusting for change in albumin.
Pulse, SBP, DBP, and MAP all remained unchanged during the dialysis treatments except for during HDF, where the SBP decreased with 25.1 ± 23.1 mmHg (P = .01).
Within the patient group, men had a significant longer prescribed dialysis time as hours/treatment (P<.001) than women. Men also had higher levels of TnT before dialysis (P = .007).
Compared to the others (n = 21), the patients normally on HDF (n = 10) had been on dialysis for a longer period (months, P = .012), had a smaller residual urinary output (P = .013), more need of ultrafiltration (P≤.01 for UF rate, total UF and UF%), longer dialysis time as hours/treatment (P = .002), and a higher Kt/V-urea in both the low-flux and high-flux series (P<.05 for both). They also had higher baseline levels of NT-proBNP (P = .017) and TnT (P = .01) before dialysis compared with those normally on LF or HF hemodialysis.
Low-flux dialysis
BNP decreased while NT-proBNP and TnT increased significantly after LF-HD (Fig. 1). During LF treatment men had higher SBP after treatment (P = .039) and higher TnT levels both before and after (P<.05) compared with women. Patients normally on HDF had significantly higher levels of all cardiac markers after LF dialysis (P<.05 for all) compared to those who did not have HDF as standard treatment. The patients usually on HDF also had a more extensive increase of NT-proBNP and TnT (P<.001) compared with those normally on HD during LF dialysis. Also patients using beta-blockers had a significantly larger Δtroponin-T (P = .005) than those without. Usage of other antihypertensive medications or the presence of diabetes did not influence the cardiac markers. There was no significant difference in the cardiac variables in those with anuria versus those with urine production (including oliguric patients).
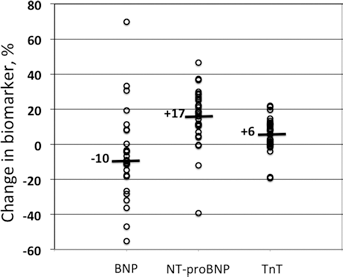
Median change (%) in biomarker after low-flux dialysis. Data of each patient is given separately (open circle).
Univariate correlation analyses
Levels of BNP before dialysis showed positive correlations with all measurements of blood pressure before dialysis (r = .428, P = .001 for SBP, r = .295, P = .026 for DBP r = .387, P = .004 for MAP and r = .294, P = .027 for PP).
Levels of NT-proBNP before dialysis correlated with blood pressure (r = .389, P = .002 for SBP, r = .265, P = .039 for DBP, r = .343, P = .009 for MAP and r = .262, P = .041 for PP).
Troponin-T (TnT) levels before dialysis correlated with the need of ultrafiltration (r = .296 P = .022 for UF rate, r = .262, P = .043 for UF tot and r = .278, P = .032 for UF%), the dialysis time as hours/treatment (r = .385, P = .002) and inversely with the residual renal function (r = -.271, P = .040).
There were also significant correlations between the baseline levels of TnT and BNP (r = .394, P = .002) and NT-proBNP (r = .460, P<.001).
Univariate correlation analyses during LF dialysis
During the LF-treatment there was a significant inverse correlation between ΔBNP and SBP before (r = -.423, P = .025) and after treatment (r = -.506, P = .006) as well as PP after treatment (r = -.532, P = .004), meaning that those with the highest blood pressures had the largest decrease in BNP.
During LF dialysis the change in ΔNT-proBNP did not correlate with any other variable in this group.
The change in TnT during LF dialysis (the rise in TnT) correlated positively with dialysis vintage (r = .407, P = .026), Kt/V-urea (r = .383, P = .037), and prescribed dialysis time as hours/treatment (r = .447, P = .013), and inversely with the residual urinary output (r = -.495, P = .005). Troponin-T after LF dialysis also correlated with time/treatment (r = .436, P = .023 for actual time and r = .468, P = .009 for prescribed time). BNP-levels after treatment correlated with PP after treatment (r = .380, P = .046).
Comparison was made between patients with a history of cardiovascular disease (n = 14) and patients without a history of cardiovascular disease (n = 16). After low-flux HD the increases in TnT and ΔNT-proBNP, as well as the reduction in BNP were similar in both groups. We also compared patients with residual urinary output (>500 ml/d, n = 15) with those with ≤500 ml/d (n = 15). The differences between the groups were not significant (ΔTnT: 9.1 ± 18 versus 3.1 ± 4 ng/l; ΔNT-proBNP: 3486 ± 7807 versus 608 ± 1596 ng/l; BNP: −46 ± 187 versus-76 ± 121).
Discussion
The present study is the first to our knowledge that compares data from BNP, NT-proBNP, and TnT during dialysis of the same patients with different types of dialyzers, thereby eliminating the risk of statistical error by interindividual differences. Our results showed significant reductions in all 3 cardiac markers during HF-HD and even more by the HDF treatment. A main reason for reduction of the various markers in plasma is that the approximate 97% cutoff level of the HF dialyzers that we used, i.e., 40 kDa, while for the LF cut off was 6 kDa (44). The effects of the dialyzers have to be related to the molecular weight of BNP (3.5 kDa), NT-proBNP (8.5 kDa) and troponin-T (37 kDa and fragments ranging in size from 8 to 25 kDa).
Others have also shown that hemodialysis results in a reduction in BNP (35–37, 39, 40, 45) and that using HF dialyzers results in a reduction in NT-proBNP (16, 34) and of TnT (16).
Is the reduction of cardiac markers during HF and HDF only a question of more efficient removal or does HDF especially affect the heart less negatively than for low-flux session? The present study showed that the lowered values of the markers after the HF and HDF hemodialysis sessions had returned to baseline by the next dialysis. Since the markers were reduced most for the HDF session these markers also increased most by the next dialysis. In a recent study Ingec et al (46) found an increase of troponin I during high-flux dialysis (46). Although data were not corrected for eventual effects of hemoconcentration, this indicates that high-flux dialyses may cause a net burden to the heart.
However, the most important finding of the present study was that when dialysis was performed using a low-flux dialyzer, there was a significant increase of both TnT and NT-proBNP. This significant increase was retained even when correcting for the effect of hemoconcentration, induced by withdrawal of fluid during dialysis. In contrast to what we expected, the increase in these markers was not different in patients with or without a cardiovascular problems. Others also found that NT-proBNP increased in LF dialysis, although no adjustment for changes in hematocrit was made in those studies (39, 40). The present study also showed a significant relation between a greater increase in TnT if the dialysis vintage was longer and even if each dialysis session was longer, while the effect of improved dialysis based on Kt/V measurement was inversely related. This indicates that the patients get more prone to increase TnT over time and also during each dialysis session. Those with greater residual renal function had less increase, indicating that the TnT might be partially eliminated by the kidneys. However, patients with residual renal function are often prescribed less dialysis (shorter sessions) and have less fluid retained in the body between dialysis.
The significant increase in NT-pro-BNP and TnT during low-flux HD strongly indicates that the dialysis process does not improve the myocytes of the heart, but instead the dialysis process may induce a negative effect on the myocardium. Even if this limited rise in TnT after dialysis does not reflect myocardial damage, it could be a sign of reduced myocardial blood flow and myocardial stunning during HD, impairing the prognosis of the patient, such as described by Selby and McIntyre (47). These authors also found ultrafiltration volumes to be a risk factor for the development of myocardial stunning during dialysis (48). Over time this stress of myocardial cells may result in partial apoptosis and subsequently in a progressive fibrosis that may develop in small areas of ischemia. Such extensive fibrosis is a further bad prognostic criteria in hemodialysis patients (49).
We found that patients at risk, to get more extensive increase of cardiac markers than others after LF-HD, had longer dialysis vintage, and a longer time on each separate dialysis session (also indicated by a higher Kt/V). In contrast, patients with higher urine output had less increase in TnT concentration after LF dialysis, indicating clearance of TnT by kidneys and/or less IDWG. These latter patients did not have as much fluid retained in the body between dialyses, which was also found to correlate with lower baseline TnT.
In the present study, baseline TnT was 95 ng/l and a small rise of 6 ng/l was present. Myocardial infarction diagnosis requires larger changes and the presence of symptoms and/or changes in ECG. However, even small rises may be independently associated with the occurrence of major adverse cardiac events. This was supported in a post surgical study (50), where a pre-operative high-sensitive cardiac TnT was greater than or equal to 17.8 ng/l and a perioperative high-sensitive cardiac TnT change greater than or equal to 6.3 ng/l (50).
Patients on beta-blockers had a higher increase in TnT than the others. Whether this effect is due to a side effect of beta-blockers, or if this is due to a worsened heart condition should be clarified. The correlation found in the present study between the blood pressure and NT-proBNP and also with BNP indicates that a larger expansion of the heart, due to volume overload by excessive interdialytic weight gain (IDWG), is present. This correlation was expected and is in line with others (6, 17, 21, 23, 24). The baseline TnT level was also higher in patients with more IDWG supporting such assumption, together with the significant correlation with the BNP and NT-proBNP levels. The beneficial effect of withdrawal of fluid from the volume expanded body can be seen by the inverse correlation between the change in BNP by LF dialysis and the baseline systolic blood pressure. Thereby a higher blood pressure at baseline, indicating fluid overload, resulted in a greater reduction of BNP by dialysis than vice-versa.
Another reason for increase of the cardiac variables could be exposure to microemboli of air that are present during HD (51, 52). A previous study verified that such microembolis are deposited not only in the lung but also in arteries such as coronary arteries and brain arteries (53).
A limitation of the study was that we were not able to perform imaging studies or functional studies during the 3 modes of dialysis.
This concept of investigation, using LF hemodialysis, seems very plausible to develop the technique of HD into a more compatible treatment model.
Conclusions
The results show that there is a slight increase in NT-proBNP and troponin T during Low flux HD. The clinicians should be aware of the fact that high flux dialysers eliminate the markers and can mask pathological increase of, e.g., TnT caused by, e.g., myocardial infarction. The rise in NT-proBNP seems to be affected by the blood pressure, and the increase of TnT by the dialysis vintage and the need for ultrafiltration.
Footnotes
Financial Support: The Västerbotten County Council (ALF), and Njurföreningen Västerbotten, Sweden, funded the study.
Conflict of interest: None of the authors has any conflict of interest.