
Abstract
Introduction
EGFR analyses allow for better correlation between genotype and phenotype in astrocytomas and represent an attractive therapeutic target. Most studies emphasize analyses of EGFR in glioblastomas (GBMs) but do not analyze all grades of astrocytomas (from pilocytic to GBM). The purpose of our study was to evaluate the status of EGFR (expression, deletion, and amplification) and EGFR protein expression in all grades of astrocytomas.
Patients and Methods
We analyzed a total of 145 surgical tumor specimens that included: 22 pilocytic astrocytomas, 22 grade II astrocytomas, 17 grade III astrocytomas and 84 GBMs. The specimens were compared to 17 non-neoplastic brain tissues obtained from epilepsy surgery. EGFR expression, EGFR amplification and EGFRvIII analyses were performed by quantitative real-time PCR, and protein expression was evaluated by immunohistochemistry.
Results
EGFR relative overexpression and EGFR amplification were observed, respectively, in 50% and 20% of astrocytomas, while EGFRvIII was only found in GBMs (34.5%, p=0.005). Amongst EGFR-amplified GBM cases, 59% also presented EGFRvIII (p<0.001). Cytoplasmic accumulation of EGFR protein was detected in 75% of astrocytomas, and 21% of the astrocytomas showed nuclear localization (p=0.003).
Conclusions
EGFR alterations were found in all grades of astrocytomas, from pilocytic to GBMs, while EGFRvIII was exclusively found in GBMs. These findings provide important information on the mechanisms involved in the progression of astrocytomas for determining whether EGFR status can be used for effective and specific therapy.
Introduction
Astrocytomas are the most common primary brain tumors (1). The World Health Organisation (WHO) classifies astrocytomas into 4 grades: grade I or pilocytic astrocytoma (AGI), grade II astrocytoma (AGII), grade III astrocytoma (AGIII) and grade IV astrocytoma or glioblastoma multiforme (GBM). GBMs are the most malignant and frequent brain tumors in adults, and GBMs can be further divided into 2 subgroups: primary GBM, which arise de novo, and secondary GBM, which result from the progression of a lower grade astrocytoma (1–4).
Treatment outcomes of GBM patients, even after multimodal therapies including surgical resection, radiotherapy and chemotherapy, remain poor; the median survival is approximately of 1 year (1–6). Advances in molecular biology have uncovered multiple molecular alterations in gliomas that have stimulated investigations toward the detection of genetic markers (7). Many growth factors and their receptors play important roles in modulating cell division, proliferation and differentiation. These receptors are often overexpressed on the surface of cancer cells (8, 9). Among these, the epidermal growth factor receptor (EGFR or ErbB1), which belongs to the ErbB family of receptor tyrosine kinases (RTK), is expressed in a broad spectrum of tumor types, including brain tumors (9–11). Despite some discrepancies among previous reports, patients with tumors that show high expression of EGFR tend to have a poorer prognosis (6, 9).
The human EGFR gene is located on chromosome 7p11-13 and encodes 4 different isoforms. Isoform 1 is a 170-kDa transmembrane glycoprotein with tyrosine kinase activity in the cytoplasmic domain (encoded by exons 16 to 28), an extracellular domain (encoded by exons 1 to 14) containing the ligand-binding site, and a transmembrane domain (encoded by exon 15) (9–15).
EGFR amplification is detectable in 40% of human gliomas (9) and occurs in 36% of primary GBMs and 8% of secondary GBMs (5). This event leads to EGFR mRNA and/or protein overexpression in over 60% of primary GBMs, but in less than 10% of secondary GBMs (5, 9, 13, 16). In most cases, EGFR amplification is also accompanied by gene rearrangement, which results in 7 classes of EGFR transcript variants (5, 9, 13, 16, 17). In malignant gliomas, the most common mutation of EGFR is an inframe deletion of 801 bp (exons 2-7), which is denoted as EGFRvIII, del2-7 EGFR or deltaEGFR and is reported to occur in 30-50% of GBMs (5, 6, 9, 13, 18–22). This deletion occurs in the extracellular region, resulting in constitutive activation of the receptor in the cell (5, 8, 9, 17–21). EGFRvIII also confers therapeutic resistance and poorer prognosis in GBM patients (18).
The majority of EGFR analyses from gene to protein status are described in GBM cases (5–7, 11, 13, 17, 18, 21, 23–27); few analyses extend to AGIII (7, 11, 13, 23, 25–27), AGII (11, 13, 17, 25–26), and AGI (11, 25).
Studies on EGFR status provide important information on the mechanisms involved in the progression of astrocytomas. EGFR represents an attractive therapeutic target for GBM patients. Monoclonal antibodies (mAbs) were first introduced for therapy against EGFR. Therefore, the specific patients who should benefit from this therapy are those with overexpression of EGFR on the cell surface but not those with EGFRvIII. In recent years, small molecule inhibitors targeting tyrosine kinases (TKIs), such as erlotinib and gefitinib, have been introduced in clinical practice (28). However, a low response to TKI therapy was observed in GBMs due to the low frequency of mutations in the intracellular domain in this kind of tumor (21, 29–31).
These findings highlight the need to analyze the status of the EGFR gene (expression, deletion and amplification), EGFR protein expression, and prognostic significance in astrocytoma patients. Therefore, we aimed at analyzing EGFR alterations in a series of astrocytomas at all malignant grades to better understand the mechanisms of progression of these tumors. In addition, this study may prove very useful as a part of the characterization of astrocytoma patients for effective and specific therapy.
Materials and Methods
Tissue samples
We obtained astrocytoma samples from 145 cases. Tumors were graded according to the WHO classification into AGI (n=22, mean age at diagnosis 19.4±9.4 years, 14 males and 8 females), AGII (n=22, mean age at diagnosis 34.5±8.6 years, 13 males and 9 females), AGIII (n=17, mean age at diagnosis 33.6±12.0 years, 10 males and 7 females) and GBM (n=22, mean age at diagnosis 52.9±13.7 years, 56 males and 28 females). The non-neoplastic control group consisted of 17 samples from individuals undergoing temporal lobe resection during epilepsy surgery. All samples were collected during surgical procedures by the Neurosurgery Group of the Department of Neurology at the Hospital das Clínicas of the School of Medicine, University of São Paulo, Brazil. Fresh surgical samples were immediately snap-frozen in liquid nitrogen upon surgical removal. Before RNA extraction, a 4-μm-thick section of each sample was obtained for histological assessment by using a cryostat at −25°C. The samples were stained with hematoxylineosin and examined under a light microscope. Necrotic and non-neoplastic areas were removed from the frozen block of tumoral tissue by microdissection prior to RNA extraction.
Total RNA extraction and cDNA synthesis
Total RNA was extracted from each sample using the RNeasy Mini Kit (Qiagen, Hilden, Germany). Evaluation of RNA concentration and purity were performed by measuring absorbance at 260 nm and 280 nm. Ratios of 260/280 values ranging from 1.8 to 2.0 were considered satisfactory for purity standards. Denaturing agarose gel electrophoresis was used to assess the quality of the samples. cDNA synthesis was performed by conventional reverse transcription using oligo (dT), random primers for extension, RNase OUT and Super Script III according to the manufacturer's specifications (Invitrogen, Carlsbad, CA, US). The resulting cDNA was then treated with RNase H (GE Healthcare, Piscataway, NJ, US), diluted with TE buffer and stored at −20°C for subsequent analyses.
DNA extraction
DNA from tissue samples was extracted with the phenol/chloroform method using standard procedures.
Quantitative real-time PCR (qRT-PCR) for EGFR gene expression
The relative expression of EGFR was determined by qRT-PCR using the SYBR Green I approach, and the following genes were used as housekeeping genes: hypoxanthine guanine phosphoribosyltransferase (HPRT) and beta-glucoronidase (GUSB). The primer sequences were the following (indicated from 5′ to 3′): EGFR F, TGCAGCGATACAGCTCAGACCC and EGFR R, TTTGGGAACGGACTGGTTTATG; HPRT F, TGAGGATTTGGAAAGGGTGT and HPRT R, GAGCACACAGAGGGCTACAA; and GUSB F, GAAAATACGTGGTTGGAGAGCTCATT and GUSB R, CCGAGTGAAGATCCCCTTTTTA. The minimum concentration of primers was determined by the lowest threshold cycle (Ct) and maximum amplification efficiency while minimizing non-specific amplification (200 nM for EGFR and HPRT, and 400 nM for GUSB). A standard curve was established to ensure amplification efficiency, and analysis of melting curves demonstrated a single peak for all PCR products. SYBR Green I amplification mixtures (12 μL) contained 3 μL of cDNA, 6 μL of 2X Power SYBR Green I Master Mix (Applied Biosystems, Foster, CA, US), and 3 μL of a mixture of forward and reverse primers. Reactions were run on an ABI Prism 7500 sequence detector (Applied Biosystems, Foster, CA, US). The PCR was performed as follows: 2 minutes at 50°C; a 10 minutes period of polymerase activation at 95°C; 40 cycles at 95°C for 15 seconds and 60°C for 1 minute. Quantitative data were normalized relative to the internal housekeeping control genes. The equation 2-ΔΔCt was applied to calculate the relative expression of EGFR in tumor samples versus the mean of non-neoplastic tissues, where ΔCt=Ct EGFR gene – mean Ct of housekeeping genes, and ΔΔCt=ΔCt tumor – mean ΔCt non-neoplastic tissues (32). The qRT-PCR reactions for each sample were performed in duplicates and repeated when the Ct values were not similar. The results are presented on a log10 scale for better visualization. EGFR expression was scored according to the median relative expression values of each astrocytoma grade. For statistical analysis, scores equal or higher than the median values were defined as EGFR overexpression.
qRT-PCR for EGFR gene amplification
To determine EGFR amplification, qRT-PCR was performed to amplify a 92 bp amplicon (at intron 1). The primer sequences were as follows (indicated from 5′ to 3′): EGFR ampl F, GCCGGTCCTGTTAGTCAGGT and EGFR ampl R, TGCTTTGGTGGTGCTCTGA. The final primer concentration was 200 nM. Reactions were performed as described for gene expression, except that DNA was used as the template. Quantitative data were normalized relative to the hemoglobin beta gene (HBb), which is described as a single copy gene (12), with the following set of primers (indicated from 5′ to 3′) at a final concentration of 400 nM: HBb F, GTGAAGGCTCATGGCAAGA and HBb R, AGCTCACTCAGTGTGGCAAAG. All reactions were performed in duplicates. The equation ΔCt=Ct HBb – Ct EGFR was used to calculate gene amplification. Values ≤2.0 were considered “no amplification”, while values >2.0 were considered as “EGFR amplification”.
qRT-PCR for EGFR deletion (EGFRvIII)
The deletion EGFRvIII was detected by qRT-PCR by amplifying a 352 bp amplicon (20). Primer sequences were as follows (indicated from 5′ to 3′): EGFRvIII F, GAGTCGGGCTCTGGAGGAAAAG and EGFRvIII R, CCACAGGCTCGGACGCAC. The final primer concentration used was 800 nM, and all reactions were run in duplicates as described for EGFR expression. The deletion analysis was performed using a qualitative method, and reactions of all positive cases were repeated to confirm the result. All primers were synthesized by IDT (Integrated DNA Technologies, Coraville, IA, US).
Immunohistochemistry for EGFR protein expression
For immunohistochemistry (IHC) analysis, paraffin-embedded tissue sections (4 μm) were subjected to deparaffinization, rehydration and endogenous peroxidase activity blocking. After trypsinisation for 20 minutes at 37°C and endogenous peroxidase activity blocking, sections were incubated with a primary monoclonal mouse anti-EGFR antibody (clone 31G7, Zymed Laboratories Inc., CA, US) (33) diluted 1:50. The incubation was performed for 30 minutes at 37°C, followed by overnight incubation at 4°C. Slides were incubated with a secondary biotin-labeled goat anti-mouse IgG antibody diluted 1:200 for 30 minutes at 37°C; these conditions were optimal for achieving high staining intensity with minimal background staining. Next, slides were incubated with streptavidin-biotin-peroxidase complex (Dako, Carpinteria, CA, US) diluted 1:200 for 30 minutes at 37°C (34). We used 3,3′-diaminobenzidine tetrahydrochloride (Sigma-Aldrick Co., St. Louis, MO, US) as the chromogen, and the sections were lightly counterstained with Harris hematoxylin (Sigma-Aldrick Co., St. Louis, MO, US). A positive breast cancer tissue was used to confirm the consistency of the immunostaining, and all samples were stained in a single batch. EGFR expression was scored according to the intensity of the structures that were stained: 0 (no staining), 1 (10%-25% of staining intensity), 2 (26%-50%), 3 (51%-75%) and 4 (76%-100%). For statistical analysis, scores between 1 and 4 were defined as positive protein expression. For nuclear accumulation, the intensity of the immunoreactions was analyzed and scored as 1, 2, and 3, respectively for weak, medium, and strong staining. All cases were analyzed by 2 independent observers.
Statistical analysis
For the analysis of the outcome, patients were classified according to the presence or absence of EGFR over-expression, EGFR amplification, EGFR deletion and EGFR protein overexpression. The statistical analysis of relative gene expression in different grades of astrocytoma was assessed using the Kolmogorov-Smirnov normality test and the non-parametric Kruskal-Wallis and post-hoc Dunn's test. Correlation between EGFR gene and/or protein status and clinical data was assessed using the non-parametric Spearman-rho correlation test. The statistical analyses and their association with patient characteristics were performed with the chi-square test (χ2). Overall survival (OS) was calculated as the interval between surgery and the day of death. The log-rank test was used for univariate analysis to estimate differences in survival time for these variables, using the Kaplan-Meier method. The relapsed cases (n=5) were excluded from this analysis. All analyses were performed using STATA, version 7 (STATA Corp., College Station, TX, US), and SPSS 15.0 software (SPSS, Chicago, IL, US). Values of p<0.05 were considered statistically significant.
Results
EGFR gene (expression, amplification and deletion) analyses
EGFR overexpression was observed in 73 out of the 145 cases of all malignant grades of astrocytomas (50.4%), as shown in Figure 1. EGFR relative expression levels were higher in all astrocytoma groups when compared to non-neoplastic samples (p<0.0001). EGFR amplification was found in 20% of the cases (29 out of 145 astrocytomas), corresponding to 1 case each of AGI, AGII, and AGIII, and to 26 GBM samples. However, the presence of EGFRvIII was detected exclusively in GBM cases; EGFRvIII was detected in 34.5% of GBM samples and 20% of all astrocytoma samples (Tab. I).
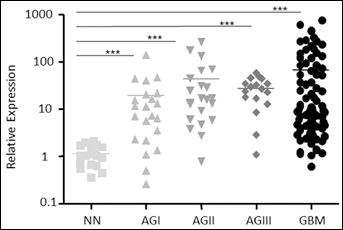
EGFR relative expression. Expression levels of EGFR in all grades of astrocytomas (AGI, AGII, AGIII, GBM) relative to non-neoplastic tissues. Total RNA was reverse transcribed into cDNA and analyzed by quantitative real-time PCR (qRT-PCR) using the SYBR Green method. Horizontal bars show the mean relative expression levels of non-neoplastic (1.18), AGI (24.92), AGII (75.95), AGIII (46.31) and GBM samples (74.10). The differences in EGFR relative expression among the groups were statistically significant (Kruskal-Wallis test, p<0.0001). A post-hoc Dunn's test was used to calculate the differences in expression among the groups separately (***p<0.0001).
Association of Histopathological Characteristics with EGFR Gene Expression, EGFR Gene Amplification, EGFRvIII, and EGFR Protein Expression in Astrocytoma Cases
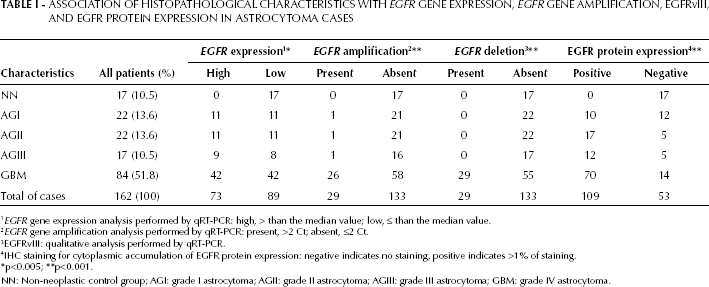
EGFR gene expression analysis performed by qRT-PCR: high, > than the median value; low, ≤ than the median value.
EGFR gene amplification analysis performed by qRT-PCR: present, >2 Ct; absent, ≤2 Ct.
EGFRvIII: qualitative analysis performed by qRT-PCR.
IHC staining for cytoplasmic accumulation of EGFR protein expression: negative indicates no staining, positive indicates >1% of staining.
p<0.005
p<0.001.
NN: Non-neoplastic control group; AGI: grade I astrocytoma; AGII: grade II astrocytoma; AGIII: grade III astrocytoma; GBM: grade IV astrocytoma.
EGFR protein expression analysis
Overexpression of EGFR protein was observed as cytoplasmic accumulation in 75.2% of the tumors analyzed (109 out of 145) corresponding to, respectively, 45.5%, 77.3%, 70.6%, and 83.3% of AGI, AGII, AGIII, and GBM samples (Tab. I). All positive cases showed strong immunoreactivity in the majority of neoplastic cells. Endothelial cells and necrotic areas were negative for EGFR expression. Nuclear accumulation of EGFR was only observed in AGII, AGIII, and GBM (24%), and corresponded to 2 out of 22 AGII samples with weak staining, 2 out of 17 AGIII samples (one case with weak staining and the other with stronger staining), and 26 out of 84 GBM samples (15 cases with weak staining, 5 with medium staining and 6 with strong staining). Figure 2 illustrates the cytoplasmic (A) and nuclear (B) accumulation of EGFR protein in 4 different GBM samples.
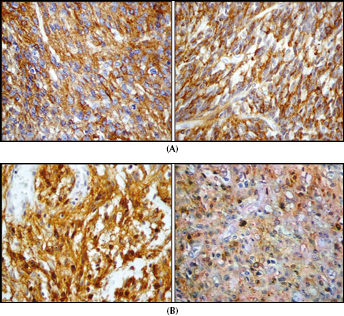
EGFR protein expression analyzed by IHC in GBM samples.
Correlation between EGFR gene and/or protein status and clinical data
EGFR relative overexpression was significantly correlated to the cytoplasmic accumulation of EGFR protein (r=0.627, p<0.0001, 64.9% concordance). Nonetheless, EGFR relative expression was not associated with nuclear localization (p=0.437, 52.4% concordance). No significant impact on OS for EGFR relative expression or cytoplasmic and nuclear accumulation of EGFR protein was found (p>0.05, data not shown). Furthermore, cytoplasmic localization of EGFR protein was associated with nuclear accumulation (p<0.001, 45.5% concordance). However, no differences in OS time for this combination were observed (p>0.05, data not shown).
EGFR expression and EGFR amplification presented 71.6% concordance (r=0.599, p<0.0001). Additionally, we found a statistically significant correlation between EGFR expression and EGFR protein expression (r=0.627, p<0.0001), and between EGFR amplification and EGFR protein expression (r=0.436, p<0.0001). These EGFR gene and/or protein expression and EGFR amplification correlations are presented in Figure 3. EGFR expression and EGFR amplification were associated with cytoplasmic accumulation (p=0.001), but not with EGFR protein accumulation (p=0.124). EGFR amplification alone or in combination with EGFR expression, cytoplasmic accumulation, and nuclear accumulation had no impact on OS (p>0.05, data not shown). EGFRvIII was associated with EGFR expression (p=0.004, 63% concordance), EGFR amplification (p<0.001, 76% concordance) and cytoplasmic accumulation (p=0.002, 48% concordance), but not with nuclear protein accumulation (p=0.666, 61% concordance). In addition, EGFRvIII alone or combined with EGFR relative expression, EGFR amplification, or cytoplasmic and nuclear accumulation of EGFR protein had no impact on OS (p>0.05, data not shown).
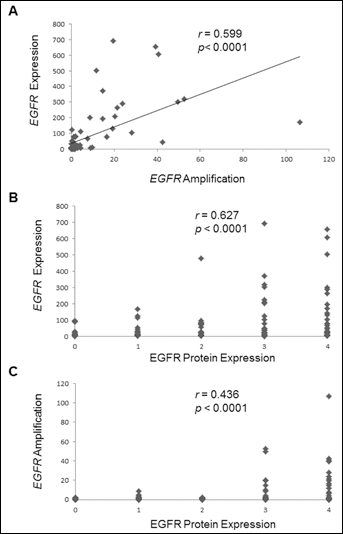
Correlation between EGFR gene expression and amplification, EGFR gene and
protein expression, and EGFR amplification and protein expression.
An overview of the results comparing positive and negative EGFR overexpression, amplification, EGFRvIII, and cytoplasmic and nuclear protein accumulation of EGFR in GBM cases is presented in Figure 4.
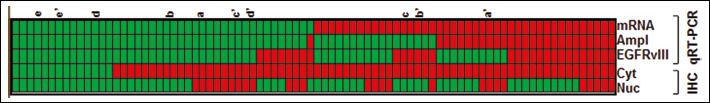
Heat map of the EGFR analyses in glioblastoma samples. EGFR relative expression levels (mRNA), EGFR amplification and EGFRvIII status determined by qRT-PCR were considered as follows: relative expression, low (green squares) or high (red squares); amplification status (Ampl), absent (green squares) or present (red squares); and EGFRvIII status, absent (green squares) or present (red squares). Protein expression status determined by IHC was evaluated as follows: cytoplasmic (Cyt) or nuclear (Nuc) localization, negative expression (green squares) or positive expression (red squares). The letters (a/a′; b/b′; c/c′; d/d′; e/e′) represent samples from the same cases (relapses).
Discussion
This is the largest study analyzing EGFR mRNA and protein expression, gene amplification, and gene deletion in correlation with the clinical and histopathological characteristics of all 4 grades of astrocytomas. Interestingly, EGFR alterations at the gene and protein levels were found in all grades of astrocytomas, confirming that the EGFR signaling pathway is relevant not only in the most malignant grade IV, GBM, but also in grade I, pilocytic astrocytoma.
Although the assessment of gene expression could be affected by our choices of endogenous controls for target gene normalization (35) and by the criteria defining high and low gene expression, 16 out of the 22 pilocytic astrocytomas presented unequivocal EGFR mRNA over-expression compared to the highest expression level of non-neoplastic brain samples. Moreover, all AGII and AGIII samples, except for one case in each of these grades, presented EGFR mRNA overexpression, suggesting that this alteration begins in an early phase of the tumorigenic process in astrocytomas and is maintained in GBMs. In contrast, the EGFRvIII deletion was observed only in 34.5% of GBM cases, a frequency similar to those previously reported (5, 6, 9, 13, 21). Interestingly, EGFR amplification was detected in 20% of astrocytomas distributed from pilocytic astrocytomas (5%) to GBMs (20%), and this finding correlated with the tumor grade (p<0.001). All 26 GBMs with EGFR amplification presented EGFR protein overexpression. Among these samples, 25 (96%) also presented relative overexpression of EGFR mRNA and 16 (59%) presented EGFRvIII. These findings are similar to those previously reported by others (5, 13, 36). Although EGFR amplification has been reported as an independent predictive factor of prolonged survival in older patients (5, 6), such a finding was not observed in the present study. Our previous study also demonstrated the lack of an association between overexpression of EGFR mRNA and polymorphisms in the EGFR promoter region (26).
The EGFR protein was accumulated in the cytoplasm in 75% of all grades of astrocytoma, including 45% of pilocytic astrocytomas. Particularly, in GBMs only 30% of cases with EGFR protein overexpression presented EGFR amplification, and 35.8% presented EGFRvIII. Therefore, other translational and post-translational hits in the EGFR signaling pathway should be identified to explain the mechanisms of gene and protein overexpression in our remaining cases that lack EGFR amplification or EGFRvIII (8, 37).
In addition to cytoplasmic accumulation of EGFR protein, nuclear accumulation of EGFR was found exclusively in 24% of diffusely infiltrative astrocytomas (AGII to GBM). Previous publications (37, 38) described the translocation of the EGFR protein to the nucleus, as well as other ErbB family member proteins, through different mechanisms. In fact, EGFR nuclear accumulation has been detected in several solid tumors, such as adrenocortical, bladder, breast, oral cavity, ovarian, thyroid, and head and neck carcinomas (39–47). The shuttling of the EGFR protein from the cell surface to the nucleus by endocytosis has been ascribed to different roles in cell proliferation, tumor progression, DNA repair, replication (48), as well as resistance to adjuvant therapy, such as cisplatin (49, 50), radiation (51, 52), cetuximab (53) and gefitinib (54). Particularly, in astrocytomas only EGFRvIII nuclear translocation was described in GBMs, where EGFRvIII formed an oncogenic complex with STAT3 and mediated EGFRvIII-dependent glial transformation (55). In our study, cytoplasmic EGFR protein accumulation occurred in 35.8% of GBM cases with EGFRvIII, and nuclear accumulation occurred in 32.1% of these cases. The presence of nuclear EGFR significantly impacted OS in invasive ductal breast, oral squamous cell, oropharyngeal, and ovarian carcinomas (41–45). However, we did not find any impact on OS time in relationship to nuclear EGFR in our GBM patients. Interestingly, in the above mentioned carcinomas, no expression of EGFR in the non-nuclear compartment was observed. This result is in contrast with our GBM cases that presented concomitant nuclear and cytoplasmic localization of the protein, and this difference may partially explain the discrepancy observed in the impact on the clinical outcome.
Moreover, none of the EGFR alterations, amplification, mRNA overexpression, and/or gene deletion had an impact on OS time in GBM patients, even when these alterations were analyzed in different combinations. However, the present findings should be further analyzed by combining the result with other hits, such as p53 alterations (24), phosphorylation of protein kinase B/Akt pathway (29, 56), or PTEN loss (21, 30, 56), which have been reported as predictors of a lack of response to therapy and result in poorer prognosis.
Particularly, the phosphorylation of PTEN has been implicated as a major obstacle for EGFR-targeted therapy (57). As a consequence to the only modest clinical efficacy of EGFR-targeted therapy in GBM, extensive investigations have been conducted to test combinatorial regimens (58–60). In these attempts to determine a personalized treatment strategy, the heterogeneous EGFR alteration status presented by patients with astrocytomas, especially GBMs, should be considered as presented here.
Footnotes
Acknowledgements
We are grateful to Celia K. Miyagui, Thais Galatro, and the Neurosurgery Group of the Department of Neurology at Hospital das Clínicas of School of Medicine, University of São Paulo, Brazil. This work was supported by FAPESP, Ludwig Institute for Cancer Research, CNPq and FFM.