
Abstract
Research on social impairments in psychopathology has relied heavily on the face processing literature. However, although many sub-systems of facial information processing are described, recent evidence suggests that generalizability of these findings to social settings may be limited. The main argument is that in social interaction, the content of faces is more dynamic and dependent on the interplay between interaction partners, than the content of a non-responsive face (e.g. pictures or videos) as portrayed in a typical experiment. The question beckons whether gaze atypicalities to non-responsive faces in certain disorders generalize to faces in interaction. In the present study, a dual eye-tracking setup capable of recording gaze with high resolution was used to investigate how gaze behavior in interaction is related to traits of Autism Spectrum Disorder (ASD), and Social Anxiety Disorder (SAD). As clinical ASD and SAD groups have exhibited deficiencies in reciprocal social behavior, traits of these two conditions were assessed in a general population. We report that gaze behavior in interaction of individuals scoring high on ASD and SAD traits corroborates hypotheses posed in typical face-processing research using non-responsive stimuli. Moreover, our findings on the relation between paired gaze states (when and how often pairs look at each other’s eyes simultaneously or alternately) and ASD and SAD traits bear resemblance to prevailing models in the ASD literature (the ‘gaze aversion’ model) and SAD literature (the ‘vigilant-avoidance’ model). Pair-based analyses of gaze may reveal behavioral patterns crucial to our understanding of ASD and SAD, and more general to our understanding of eye movements as social signals in interaction.
Introduction
Research on social impairments in psychopathology has relied heavily on the face processing literature, as faces carry information that is crucial to social interaction. Faces convey information on one’s identity and emotional expression, for example, which are crucial to our willingness to engage in, or respond to bids for, social interaction. Over the last decades, researchers have investigated face processing by compartmentalizing face processing into smaller problems. For example, researchers have investigated how gaze direction is inferred from one’s eyes and head orientation (e.g. Langton et al., 2000; Langton, 2000), how shifts of attention occur based on that gaze direction (Frischen et al., 2007), how emotion from a face is perceived or processed (Leppänen & Nelson, 2009), how one’s mental state may be conveyed in the eye region (Baron-Cohen et al., 2001a), in what manner information is retrieved when viewing faces (e.g. Yarbus, 1967; Võ et al., 2012), which information is favoured when learning faces (Henderson et al., 2005), and many more. This has for the greater part been done by manipulating specific aspects of static faces. While this compartmentalization has resulted in a wealth of knowledge on the subsystems of face processing, this approach has recently been questioned by several researchers for its lack of generalizability to social settings, where the content of faces is more holistic, dynamic and dependent on the interplay between interaction partners (Smilek et al., 2006; Kingstone et al., 2008; Kingstone, 2009; Risko et al., 2012).
The concern for the lack of generalizability of studies on face processing to social settings is based on several arguments. First, the context of a social setting appears to play an important role in face processing, and particularly in gaze behavior to faces (e.g. Birmingham et al., 2008). Second, the presence of an actual person as opposed to a representation (e.g. a photograph, video, or animated model), or the belief that one may be observed by others, modulates gaze behavior (e.g. Laidlaw et al., 2011; Gobel et al., 2015). Third, the eyes of the observer are not only for information uptake, but may also provide valuable signals to others (e.g. Freeth et al., 2013). These arguments may be summarized as the presence of another person, as well as the behavior of that person, having an effect on gaze behavior. In a recent review, Risko et al. (2012) stated that merely investigating passive viewing of representations of others may overlook important dynamics of gaze behavior to faces, compared to when social partners are physically present.
The insight that gaze behavior in social interaction is likely to be quite different from gaze behavior to non-interactive representations of others (pictures, videos, etc.) is important for face processing in general, but also specifically for research in psychopathology where social impairments are fundamental to certain disorders, e.g. Autism Spectrum Disorder (ASD) and Social Anxiety Disorder (SAD). Social impairments in these disorders have often been investigated by using eye-tracking technology to gain insights into gaze behavior to representations of others (e.g. Guillon et al., 2014). In these studies, looking at the eyes of a representation of a person is considered as ‘eye contact’ and is studied as a model for social interaction (Senju & Johnson, 2009a, b). Given that a plethora of knowledge on these disorders derives from research using such simple representations of persons, the question beckons whether this generalizes to behavior in social interaction. Although researchers have tried to tackle this problem by investigate gaze behavior between interacting people using wearable eye-tracking technology (often in the form of glasses called ‘mobile eye trackers’), there are several drawbacks to this method. First, when these mobile eye trackers are applied to gaze in interaction, the resolution of the eye-trackers is limited to whether one looks at a face or not, and precludes more detailed information of gaze on facial features (e.g. Gullberg & Holmqvist, 2006; Broz et al., 2012; Damm et al., 2013). Even if resolution should improve with new models, a second drawback may still limit its use for fine-grained analysis: analyzing eye-movement data from mobile eye-trackers is often a time-intensive manual coding process (which generally requires knowledge of the locations of all objects of interest in space). Thus the trade-off of a controlled laboratory study with high resolution eye-tracking data and automatic analysis, and a lower-resolution mobile eye-tracking study in which people can interact but with poorer data quality and often manual analysis, seems a difficult one to break. Here we do so by investigating gaze behavior using high-resolution eye-tracking technology to faces in dyadic interaction. Using a dual eye-tracking setup, we aim to link gaze behavior to traits of ASD and SAD. First, research on gaze behavior to faces in ASD and SAD is reviewed, after which we introduce the specific research questions.
Gaze behavior to faces in Autism Spectrum Disorder
Autism Spectrum Disorder (ASD) is a neurodevelopmental disorder characterized by “
One explanation for the inconsistencies in gaze behavior to faces in ASD was posited by Speer et al. (2007). They suggest that the social context of the stimuli used may be very important. In their study photographs and videos of either one or more persons were employed. Individuals with ASD differed only from TD individuals in the social dynamic (videos of more people) condition, in which reduced looking time to the eyes was observed. While the social context may appear to reconcile differences in looking time to the eyes across studies, this does not reconcile differences in increased looking time to the mouth (Klin et al., 2002; Rice et al., 2012). However, one may question how ‘social’ the context was even in the condition where videos of more people were used. Moreover, a recent review on this topic concludes that “
Gaze behavior to faces in Social Anxiety Disorder
Social Anxiety Disorder (SAD) is characterized in the DSM-5 as marked fear or anxiety about social situations where one is under possible scrutiny by others. Importantly, the fear or anxiety is out of proportion to the threat posed by the social situation. Moreover, individuals with SAD may show
Although these studies show altered gaze behavior to faces in SAD, particularly with regard to the eye region, the SAD research field also calls for
One problem in investigating the link between ASD and SAD and gaze behavior to faces, is that of dissociating between ASD and SAD traits. Several studies have shown that many individuals fulfill criteria for both conditions (e.g. Cath et al., 2007; Simonoff et al., 2008), and discriminating between the two is difficult (South et al., 2017). In experimental studies, reduced looking time to the eyes has been observed in both ASD and SAD subjects (Pelphrey et al. 2002; Horley et al. 2004), but little is yet known about the qualitative differences in measures of gaze behavior to faces between the two conditions. Several cognitive models have been posed as explanations for atypical face processing in ASD and SAD (e.g. Senju & Johnson, 2009a; Horley et al. 2004). Reduced looking time to the eyes in ASD has either been explained as
The present study
In the present study, we investigate gaze behavior in a social setting, by concurrently recording eye movements of two people in dyadic interaction. We do so by using a social interaction dual eye-tracking setup that allows for the registration of high-resolution gaze behavior of two observers looking at each other’s faces. Importantly, this setup allows for largely automatic data analyses. We investigate whether gaze behavior in interaction relates to ASD and SAD traits in a general population. This is highly relevant given the tendency over the last decades of compartmentalizing face processing in sub problems, and the inconsistencies on gaze behavior to faces in ASD and SAD. Investigating gaze behavior in interaction in relation to traits of ASD and SAD might prove very valuable as a first step in assessing the sensitivity of gaze in interaction to (subclinical) psychopathology in general, as differences between clinical and control groups are not always clear. By assuming ASD and SAD traits lie on a continuum, where individuals may exhibit characteristics of a syndrome to a certain extent (without them necessarily reaching any clinical criteria), we can investigate the link between gaze behavior and these conditions before testing clinical groups.
By concurrently recording eye movements of two participants, we are able to investigate gaze behavior one-way – where does one look on the face of another and how is this related to ASD and SAD traits? Second, it allows us to investigate gaze behavior two-way – how is gaze behavior in interaction related to ASD and SAD traits? Specifically, it allows us to investigate paired gaze states – the combination of gaze of two participants to the facial regions of each other (note that such states may sometimes have been referred to as ‘eye contact’ or ‘gaze aversion’ in the literature; see e.g. Kleinke, 1986). For the one-way analysis, we hypothesize scores on ASD and SAD questionnaires to be negatively correlated with the time spent looking at the eyes. Participants scoring higher on either trait look less at the eyes compared to participants scoring lower on that trait. Given the contrasting evidence in previous research we will investigate whether ASD and SAD traits are positively correlated with time spent looking at other facial areas (nose and mouth). Specifically, the following four hypotheses are posited:
For the two-way analysis, we will explore the relation between ASD and SAD traits and the total time, duration and frequency of paired gaze states. As this is the first study (to the best of our knowledge) investigating the relation between gaze behavior to faces in interaction and ASD and SAD traits with high resolution eye-movement recordings, no specific hypotheses are posited on the paired gaze states. If paired-gaze states are related to ASD and SAD traits, this may not only inform the study of ASD and SAD in itself, but also the study of eye movements as social signals in interaction in general.
Method
Participants
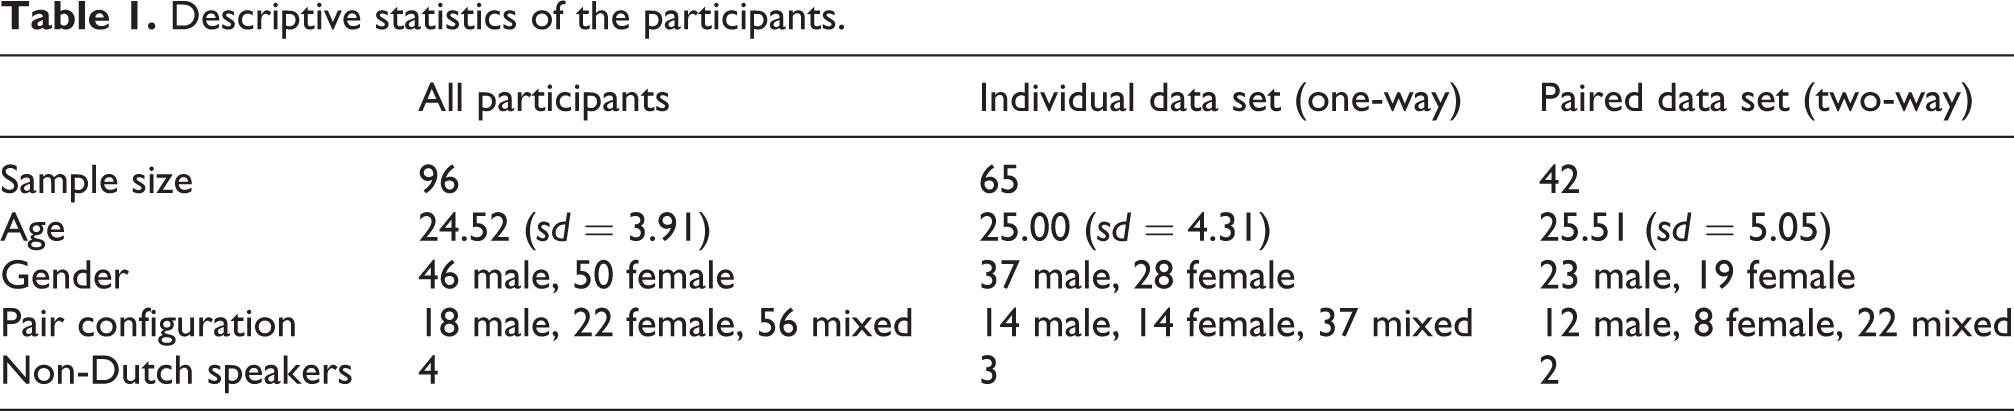
One-hundred participants were recruited amongst the students, employees and visitors at the Faculty of Social and Behavioral Sciences of Utrecht University. All participants gave written informed consent prior to the experiment. Data of 4 participants was lost due to either an incorrect eye-tracking protocol (
Descriptive statistics of the participants.
Apparatus & Stimuli
We wanted to map gaze positions of two observers to the face of the other. We chose to do this using a Skype-like two-way video setup, in which a live feed from one observer was presented to the other, and vice versa. However, a Skype setup features the problem that a person does not appear to look one in the eye. The main reason for this is that the camera is placed above the screen. One can only appear to look another in the eye by looking straight into the camera. However, when looking in the camera, one cannot look at the image of the other at the same time. To circumvent this problem, we designed a setup similar to an autocue system TV presenters use, which allows a person to look straight into the camera and unto the image at the same time. This was done by placing a camera behind a half-silvered mirror reflecting the image of the other observer (see Figure 1).

Schematic side view of the dual eye-tracking setup. Observer A is recorded through a half-silvered mirror by Camera A. The solid line represents the flow of the video image of Observer A to Screen B, and is subsequently reflected of the half-silvered mirror to Observer B. As the eyes of Observer A are depicted on Screen B at the same height as Camera B is recording (and vice versa for Observer B to Observer A), both observers appear to look straight ahead when they look at the eyes of the other. Both sides of the setup were placed in the same room, with the observers at either side.
The social interaction dual eye-tracking setup used in this study, introduced in Hessels et al. (2017), is depicted in Figure 1. The setup consists of two wooden boxes placed at either end of an office table. Inside of each wooden box was a half-silvered mirror, which reflected the screen lying in the bottom of the box. Behind the half-silvered mirror a webcam was placed. The webcam could record video of the participant through the mirror. This video image was subsequently presented on the screen of the other participant. Two Logitech webcams recorded video frames of 800 by 600 pixels at 30 Hz, and were presented at a resolution of 1024 by 768 pixels in the center of the 1680 by 1050 pixels available on the screen. The video frames were surrounded by a black border. The live-feeds were concurrently presented to the other participant and recorded to disk. Two SMI RED eye-tracking systems running at 120 Hz were used for the collection of eye-tracking data during the presentation of the live-feed of the observers. A parallel port connection was used to communicate to the eye-tracker computers that the video stream began and ended. Further technical details are provided in Hessels et al. (2017). Participants could see each other only through the dual eye-tracking setup as if they were positioned at a distance of 1.36 m. Participants could hear each other, as they were in the same room.
ASD and SAD traits assessment
ASD and SAD traits were assessed using short questionnaires. ASD was assessed using the Autism-spectrum quotient (AQ) developed by Baron-Cohen et al. (2001b), using the Dutch translation by Hoekstra et al. (2008). The AQ was developed to be a brief, self-administered instrument capable of assessing autism-spectrum traits in adults with normal intelligence. The AQ contains 50 questions, 10 of which each assess a different area: social skill, attention switching, attention to detail, communication, and imagination. AQ scores were calculated as described in Baron-Cohen et al. (2001b), range between 0 and 50, and higher values indicate more ‘autistic-like’ behavior associated with that particular area.
SAD was assessed using the Dutch social anxiety scale (SAS) developed by Willems et al. (1973). The SAS was developed to measure social anxiety as a disposition, and in particular the fear or anxiety of negative evaluation in social situations. The 24 questions tap into situations where the person stands out, situation in which evaluation or judgement of a person may occur, new and unexpected situations, and informal contact situations. Scores may vary between 0 (not socially anxious at all) to 96 (extremely socially anxious).
Subjects were not explicitly screened for prior diagnoses of ASD, SAD, or any other psychiatric disorder, nor were they screened for medication use. Although every subject was debriefed about the purpose of the study and the relation to ASD and SAD, none of the subjects reported being diagnosed for any psychiatric disorder. Insofar as the suggested cut-offs for the questionnaires are concerned: only one female participant scored above the cut-off for the AQ of 32 (Baron-Cohen et al., 2001b). For the SAS, no cut-offs are suggested, as its goal is not to serve as a diagnostic instrument (or aid in the diagnostic process).
Given the international character of the University setting, a few international participants were recruited, and English translations of the questions were used for these participants. Depending on the specific analysis, this number was 4 or less (see Table 1 ).
Procedure
Upon entering the lab, participants were placed at a table with a screen in between them to privately read and sign informed consent forms. Hereafter, participants entered the experimental room and were seated at each end of the dual eye-tracking setup. Using a height-adjustable chair, participants were placed such that their eyes were at the same height as the webcam filming them and the distance of their eyes to the eye tracker was approximately 70 cm. By placing participants with their eyes at webcam height, we ensured that when they looked straight ahead they would look directly into the camera. Moreover, this ensured that participants would also look directly on the eyes of the image of the other person portrayed on the half-silvered mirror. After positioning, a 5-point calibration procedure was run, succeeded by a 4-point validation procedure.
After validation, participants were instructed to ‘look at each other’ for a total of 5 minutes, identical to Hessels et al. (2017). No specific instructions were given to maintain eye contact, nor were there any restrictions on talking or other behaviors. The instructions were kept to a minimum to allow participants to behave as they wanted in spite of the experimental setting. Post hoc assessments of the videos of the included participants revealed that periods of smiling were common in most participants, whereas laughter and conversation occurred very infrequently. Critically, the occurrence of these behavior was not related to AQ or SAS score. After the instruction, the live-video stream and data recording were started. After 5 minutes the experimenter manually ended the experiment. Following the experiment participants were again seated at the table with the screen in between participants. Participants were then asked to fill in the self-report questionnaires through LimeSurvey, an online-survey tool.
Data analysis
In order to map gaze coordinates of both observers to the video recorded from the other observers without manually coding gaze location on a frame-by-frame basis, eye-tracking data were analyzed as outlined in Hessels et al. (2017). In short, eye-tracking data were automatically trimmed to the start and end of the videos, and processed using custom software written in MATLAB R2014b. Area of Interest (AOI) centers were manually determined for the left eye, right eye, nose, and mouth. Hereafter, face-tracking software automatically tracked the location and orientation of the participant’s face throughout the video and updated the location of the eyes, nose, and mouth for each video frame. As the video was recorded at 30 Hz, and eye-tracking data needed to be mapped to this video, eye-tracking data were down sampled using a moving-window average. For each video frame, the corresponding down-sampled gaze coordinate of the participant was assigned to one of four AOIs – left eye, right eye, nose, and mouth – using the Limited-Radius Voronoi Tessellation (LRVT) method (Hessels et al., 2016). The LRVT method assigns a gaze coordinate to the nearest AOI provided that its distance does not exceed the limited radius. Previous research has shown that AOI size and AOI-based measures are not linearly related, and large AOIs implemented using the LRVT method with large radii are thereby most robust to noise in sparse stimuli such as faces (Hessels et al., 2016). The LRVT-radius was set to 4.0º. To compare, the average distance between the left eye and right eye AOI center across all videos was 3.0º, and the average distance from each AOI to its closest neighbor (or AOI span) was 1.9º 1 .
After gaze was assigned to the AOIs by the analysis software, dwells were computed in order to determine how long and how often observers looked at the AOIs. Dwells on the same AOI interspersed with a dwell of one video frame (e.g. a 33 ms dwell on the nose between two dwells on the left eye) were merged into one dwell. As fixations are generally longer than 100 ms, dwells shorter than 120 ms were excluded. Total dwell times (Holmqvist et al., 2011, p. 389) to the left eye, right eye, nose, and mouth were calculated by summing the durations of all dwells to the corresponding AOI. The total dwell times to the left and right eye were also summed to create a combined AOI for the eyes. A non-AOI was used for all frames in which gaze was available, but not on any of the three other AOIs; this included all gaze data on or off the screen, but not lost data.
For the two-way gaze analysis, three gaze states were defined. Two-way eye gaze refers to the situation where both participants look at the eyes AOI. One-way eye gaze refers to the situation where one participants looks at the eyes AOI, but the other does not. No eye gaze refers to the situation where both participants look somewhere else (e.g. nose, mouth, or non-AOI). While two-way gaze is sometimes referred to as ‘eye contact’, and no eye gaze as ‘averted gaze’, we refrain from using these terms, as it may imply something special or intentional about these gaze states. For all three gaze states, the frequency of occurrences, the mean duration of an occurrence, and the total time of the occurrences were calculated.
Eye-tracking data quality
Prior to eye-movement data analysis in relation to ASD and SAD traits, the data quality was assessed. Validation error after calibration was approximately 0.7º, which was well below the inter-AOI distance. Upon inspection of the raw eye-tracking data, two problems were identified in some of the observers. First, it appeared that there was a large proportion of data loss for a number of observers (i.e. no gaze coordinate was reported). Second, for some observers the gaze coordinate appeared to be highly unstable, and changed position very rapidly. In order to quantify these problems, two measures were calculated. First, the amount of time without dwells on any of the AOIs was calculated by subtracting the total dwell times on the left eye, right eye, nose, mouth and non-AOI from 300 s (the duration of the experiment). The measure contains periods of data loss due to e.g. blinks or tracking problems. Second, the root mean square (RMS) displacement was computed as an estimate for the rapid position change observed in the raw data. This RMS displacement was calculated as the root of the average squared position change from one video frame to the next 2 . Each participant is represented as one point in Figure 2 based on these two measures. A cluster of participants can be seen in the bottom left corner. These participants had short times without dwells on any AOI and small RMS displacement, and represent recordings with high data quality. The other participants were excluded in the analysis. The numerical criteria corresponding to the selection of excluded participants were (1) over 70 s without dwells on any AOI or (2) RMS displacement above 3º. For the analysis on paired gaze states, only pairs with both participants in the individual analysis were selected. Descriptives of the individual and paired data sets are given in Table 1.

Data quality measures for all participants. Each participant is depicted by a circle. Open circles represent included participants, closed circles excluded participants, based on the exclusion criteria marked with dashed lines.
In order to verify that inclusion of participants was not related to ASD or SAD traits, independent-samples t-tests on AQ and SAS scores were conducted between the included and excluded participants. Both AQ scores (
Results
Individual gaze data
The individual gaze data were used to answer the question where people look on the face of another person and how this is modulated by ASD and SAD traits. Four hypotheses were outlined in the introduction. We hypothesized that scores on the ASD and SAD questionnaires would be negatively correlated with the total dwell time at the eyes. As the duration of the experiment is fixed, a decrease in total dwell time at the eyes should be accompanied by an increase in total dwell time at another location. Therefore, we hypothesized that ASD and SAD traits would be positively correlated with total dwell time at the other facial areas (nose and/or mouth).
Pearson product-moment correlations were used to investigate the four hypotheses. As our hypotheses were directional, correlations were one-tailed. Correlations were computed using JASP (JASP Team, 2017). Moreover, evidence in favor of the hypotheses was quantified using the Bayes’ Factor, although frequentist p-values are provided in full as well. Bayes’ Factors represent relative evidence in favor of the correlation being in the expected direction versus the opposite direction. For example, the Bayes’ Factor for H1 represents the relative evidence in favor of the correlation between ASD traits and total dwell time at the eyes being negative compared with the correlation being positive. Correlations for the four hypotheses between the AQ and SAS scores and total dwell times at the AOIs are given in Table 2. As one participant did not complete the SAS questionnaire, correlations for the SAS scores are based on 64 instead of 65 participants.
Pearson product-moment correlations between AQ and SAS scores and total dwell times on Areas of Interest (AOI). BF = Bayes Factor in favor of the correlations being in the predicted direction versus the opposite direction. Significant correlations are bold-faced. BFCB = Bayes Factor of the combined AQ and SAS linear regression model to the best model for the AOI in question.

For both the AQ and SAS scores, significant negative correlations were observed for the total dwell time on the eyes AOI. As the eyes-AOI is a composite of two separate eyes, correlations were also examined per eye. This indicated that total dwell time was negatively correlated with the total dwell time on the right eye AOI, but not the left eye AOI. Although a significant negative correlation between AQ and SAS score and total dwell time to the eyes was observed, evidence in favor of these hypotheses was relatively weak (Bayes’ Factors of 2.05 and 2.50, respectively) compared to evidence in favor of these hypotheses based on the right eye only (Bayes’ Factors of 6.30 and 7.81 respectively). Nonetheless, both
Given that the pattern of results for the AQ analysis looks very similar to that of the SAS analysis, this was further investigated. First of all, the Pearson product-moment correlation between the AQ and SAS scores was 0.51 (
Pearson product-moment correlations between AQ sub-scale scores and total dwell times on right eye and nose.
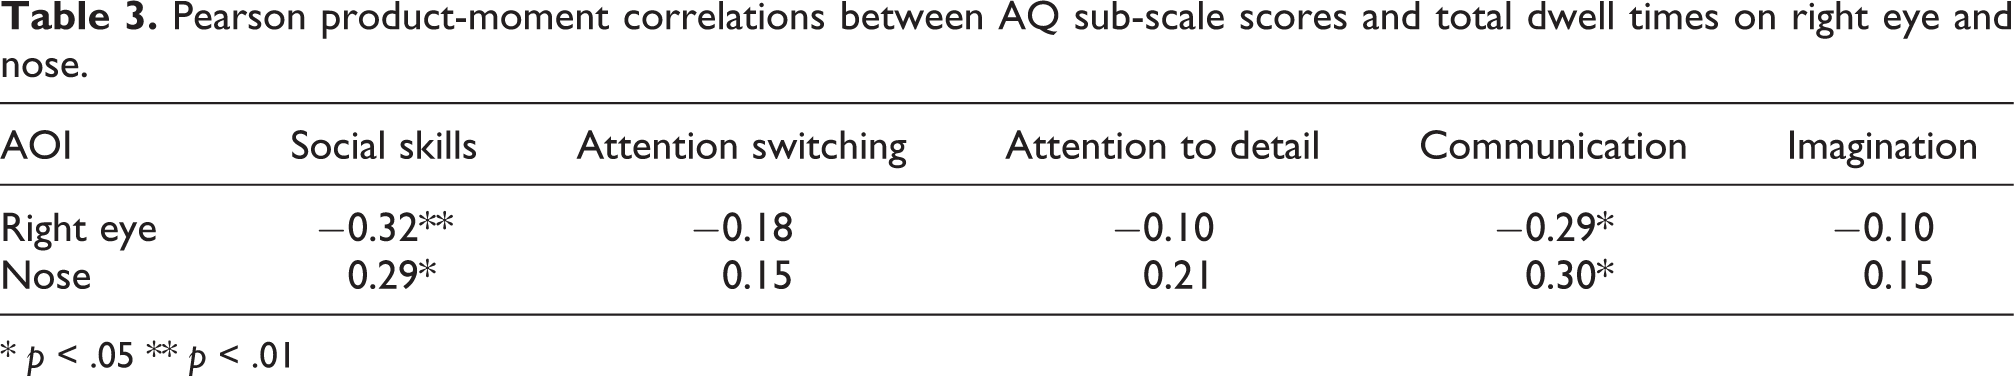
*
In sum, the one-way analysis revealed that gaze behavior to faces in interaction was significantly correlated with ASD and SAD traits, supporting our four hypotheses. As expected, AQ and SAS scores were negatively correlated with total dwell time to the eyes, and particularly for the right eye. AQ and SAS scores were positively correlated with total dwell time to the nose AOI. Patterns were similar for the AQ and SAS scores, likely due to the fact that the relation with the AQ score was only in the social skills and communication sub-scales.
Paired gaze data
The paired gaze data were used to explore the relation between the paired gaze states as defined in the
Pearson product-moment correlations between paired AQ and SAS scores and total duration, mean duration and frequency of paired gaze states. Correlations significant at p < .05 are bold-faced.

In sum, the two-way analysis revealed that paired gaze states were differently related to paired AQ and SAS scores. Pairs of observers scoring high on the AQ were engaged in less two-way eye gaze, yet more in one-way eye gaze compared to pairs of observers scoring low on the AQ. Pairs of observers scoring high on the SAS were more frequently engaged in one-way eye gaze, yet of shorter duration, compared to pairs of observers scoring low on the SAS.
Discussion
A social interaction dual eye-tracking setup introduced by Hessels et al. (2017), was used to investigate the relation between gaze behavior in dyadic interaction and traits of Autism Spectrum Disorder (ASD) and Social Anxiety Disorder (SAD). Research over the last decades has tended to compartmentalize face processing in sub problems, and while this has resulted in a plethora of knowledge, questions have been posed about its generalizability to everyday social situations. This is particular relevant for gaze behavior in clinical psychopathology, where differences between clinical groups and controls have been inconsistently found, while social impairments are fundamental to certain disorders. By investigating the sensitivity of gaze behavior in interaction to ASD and SAD traits in a general population, we aimed to assess the fruitfulness of this interactive approach to gaze behavior for understanding processes underlying behavior in several psychopathologies. The social interaction dual eye-tracking setup we employed allows for the registration of high-resolution gaze behavior to faces in interaction. Eye-tracking data were analyzed in two ways. First, individual gaze data were used to test four hypotheses regarding the link between ASD and SAD traits and gaze behavior to faces. We hypothesized that observers scoring high on ASD and SAD traits would show shorter total dwell times to the eye region, as evidenced by a negative correlation, and longer total dwell times to the other facial features (nose and/or mouth), as evidence by a positive correlation. Second, paired gaze data were used to explore how gaze behavior of a pair in interaction is related to ASD and SAD traits. This was examined by exploring the relation between average ASD and SAD traits in a pair and the total time, frequency, and duration of paired gaze states (e.g. simultaneously looking at the eye region of the other).
The individual gaze analyses revealed that ASD and SAD traits were indeed negatively correlated with total dwell time at the eyes. While this was true for the area comprising both eyes (Bayes’ Factors in favor of these hypotheses were small at only 2.05 and 2.50 for ASD and SAD traits respectively), it appeared to be largely due to the total dwell time to the right eye (Bayes’ Factors of 6.30 and 7.81 for ASD and SAD traits respectively). Moreover, both ASD and SAD traits were positively correlated with the total dwell time at the nose (Bayes’ Factors of 12.5 and 10.8 for ASD and SAD traits respectively). All our four hypotheses were supported by the data. As the pattern of relations between total dwell time and AQ score was very similar to that with the SAS score, we investigated this further. Correlations between total dwell times on the right eye and nose and the sub-scales of the AQ revealed that gaze behavior was related mainly to the social skills and communication sub-scales. Additionally, scores on the AQ and SAS were positively correlated, indicating that both questionnaires might have tapped into similar traits. Concluding, the individual gaze data analysis corroborates the hypotheses that ASD and SAD traits modulate total dwell time to facial features in dyadic interaction, specifically for the eye and nose region.
The main benefit of the eye-tracking setup employed was the ability to investigate the gaze behavior of pairs of observers. For the paired gaze analyses, three gaze states were defined: two-way eye gaze (both participants looking at the eyes of the other, sometimes termed ‘eye contact’), one-way eye gaze (one participants looking at the eyes, but not the other) and no eye gaze (both participants not looking at the eyes of the other, sometimes termed ‘averted gaze’). Two main patterns emerged. First, high-AQ pairs of observers were engaged in less two-way eye gaze, yet more in one-way eye gaze compared to low-AQ pairs of observers. Second, high-SAS pairs of observers were more frequently engaged in one-way eye gaze, yet of shorter duration, compared to low-SAS pairs of observers. These findings are particularly relevant given several proposed models on gaze behavior in ASD and SAD.
Although there is still no consensus on whether fixation to the eyes is in fact reduced in ASD compared to controls (Senju & Johnson, 2009a), several models for this apparent lack of eye fixation have been proposed. Briefly, a distinction between ‘gaze aversion’ and ‘gaze indifference’ is being posed in the literature, where the ‘gaze aversion’ model states individuals with ASD actively avoid the eye region of other and the ‘gaze indifference’ model states there is no particular avoidance, but mere omission of fixating the eye region (Moriuchi et al., 2017). The findings obtained in the present study may be easiest to explain in a ‘gaze aversion’ model. Pairs of observers scoring higher on the AQ were more often engaged in one-way eye gaze, yet less often in two-way eye gaze compared to low-AQ pairs of observers. If high AQ scores are only predictive of time spent looking at the eyes, but not of an avoidance of two-way eye gaze (which is sometime referred to as ‘eye contact’), one would expect high-AQ pairs of observers to show both diminished two-way and one-way eye gaze. It should be noted, however, that ASD is here investigated as a (sub)-clinical trait in a general population, and not in a clinical group. Moreover, it is impossible to completely disentangle ASD from SAD traits here, given the positive correlation between the scores on the two questionnaires observed in the present study. Investigating gaze behavior in interaction may, however, provide valuable insights in the context of these ‘gaze aversion’ and ‘gaze indifference’ models of eye fixation in ASD.
In SAD, a ‘vigilant-avoidance’ hypothesis is described that states that individuals with SAD are initially more attentive to ‘social threat cues’ compared to TD individuals, but hereafter actively avoid these ‘social threats’ (e.g Horley et al., 2004). Although the ‘vigilant-avoidance’ hypothesis has not been specified as such for gaze behavior in interaction, the findings here bear resemblance to this hypothesis; i.e. pairs scoring high on SAD traits were more often engaged in the situation where one of the partners looked at the eyes of the other, while that other did not reciprocate (vigilance), yet of shorter duration (avoidance), than pairs scoring low on SAD traits. This seeming corroboration of the ‘vigilance-avoidance’ hypothesis indicates that much more specific predictions may be made on the interplay of gaze between two partners.
Before we conclude, we elaborate on the paired-gaze patterns observed for both ASD and SAD traits. While the pattern that high-scoring pairs on ASD traits are involved longer in one-way eye gaze and shorter in two-way eye gaze compared to low-scoring pairs is informative in itself, it doesn’t shed light on how this behavior develops over time. The same holds for the pattern that high-scoring pairs on SAD traits are more often involved in one-way eye gaze yet of shorter duration than low-scoring pairs. In order to give these patterns more meaning, example scarf plots for low- and high-scoring pairs on ASD and SAD traits are provided in Figure 3. A low-scoring pair on ASD traits is depicted in Panel A in Figure 3. As can be seen, both observers looked at the eyes of the other at the same time, more often than may be observed for the high-scoring pair on ASD traits depicted in Panel B. For the latter pair, observer 1 looked at the eyes more often in the first half of the experiment, whereas the reverse is observed for the latter half of the experiment. In this manner, the pattern of more one-way eye gaze and less two-way eye gaze for high-scoring pairs on ASD traits may be constituted. As can be seen in Panels C-D in Figure 3, the low-scoring pair on SAD traits looked at the eyes of the other for longer periods of time, whereas the high-scoring pair looked at the eyes of the other more often but for shorter duration. In this manner, the pattern of more frequent, but shorter, periods of one-way eye gaze may be constituted. Future research may look into the more fine-grained coupling of gaze behavior between interacting partners and its relation to ASD and SAD traits.

Scarf plots of dwells to the Areas of Interest (AOI) for a low-scoring pair on ASD traits (A), a high-scoring pair on ASD traits (B), a low-scoring pair on SAD traits (C), and a high-scoring pair on SAD traits (D). Each filled rectangle represents one dwell, with its length equal to the duration of that dwell. The dark-colored bars in each scarf plot belong to Observer 1, whereas the lighter-colored bars belong to Observer 2. Bars are grouped by each AOI: eyes, nose, mouth, and non-AOI (contains all gaze on screen but not on the other AOIs).
Although there are promising findings reported here, several caveats are to be noted. First, a general population was assessed on ASD and SAD traits. The question remains how this generalizes to gaze behavior in clinical groups. More specifically, future research may uncover how gaze behavior manifests itself within pairs observers from clinical groups, and between observers from clinical groups and typically developing individuals. Second, the individual gaze analyses were based on eye-tracking data that were also used in the paired gaze analyses. While the individual gaze analyses do allow for good comparison to research with static pictures or videos of faces, the findings from the individual gaze analyses cannot be 100% separated from the findings from the paired gaze analyses. Investigating gaze in interaction allows gaze behavior to be modeled as the output of a system composed of two people. However, disentangling these two individuals is a challenge. This is highly important, as it would allow one to investigate how paired gaze states may arise. It may be the case, for example, that one participant with relatively low ASD traits attempts to ‘compensate’ for the gaze behavior on a participant with relatively high ASD traits. A first attempt of disentangling the gaze patterns of two interactants has recently been made (Hessels et al., 2017), and we welcome research investigating the close interplay of gaze between interaction partners. Third, ASD and SAD traits were highly correlated and showed a large overlap in the one-way analysis of gaze behavior. While this was to be expected as ASD and anxiety symptoms have been suggested to be related (see e.g. Gillott et al., 2001; Bellini, 2006), we could not establish independent contributions of ASD and SAD on gaze behavior. Groups comprising low ASD and high SAD traits (or vice versa) would be limited to 6 or 7 participants only. However, two-way analyses of gaze behavior revealed diverging links to ASD and SAD traits. Future research might benefit from a larger sample where independent contributions from ASD and SAD traits may be reliably separated. Finally, while we wanted to investigate gaze behavior in social interaction, we were still limited to a two-way video setup in a lab, which may not mimic everyday social interactions. Moreover, we know from previous research that gaze behavior is linked to, for example, speech (Võ et al., 2012), which we did not consider in detail here. Future research may benefit from more controlled procedures (e.g. by having participants converse on a certain topic), and a concurrent assessment of gaze, speech, and non-verbal communication, and how these are related to each other. Here, however, we provide a first step toward high-resolution recordings of eye-movement behavior in social situations. A recent striking example that underlines the possible fruitfulness of our approach is given by Edmunds et al. (2017). They suggest that children with ASD may only be distinguished from controls on eye-contact measures using point-of-view cameras on partners interacting with these children, compared with other observation techniques. Importantly, using our approach we can measure paired gaze states of children with ASD and their social partners objectively, and with higher resolution of gaze direction than with camera-based observation.
Conclusion
Using a social interaction dual eye-tracking setup we investigated how gaze behavior in interaction is related to ASD and SAD traits. We corroborated hypotheses posed in research using static pictures and videos that ASD and SAD traits predict looking time to the facial features of others. Moreover, our findings on the relation between paired gaze states and ASD and SAD traits bear resemblance to prevailing models in the ASD literature (the ‘gaze aversion’ model) and SAD literature (the ‘vigilant-avoidance’ model). Although our findings cannot be interpreted as direct corroborations of these models, the present study shows that gaze behavior in dyadic interaction may reveal important behavioral aspects that may guide future (neuro)cognitive research on these conditions. Future research may benefit from more studies investigating gaze behavior in social settings using a dual eye-tracking setup as outlined here. Pair-based analyses of gaze may reveal behavioral patterns crucial to our understanding of ASD and SAD, and to our understanding of eye movements as social signals in interaction.
Footnotes
Acknowledgements
This work was supported by a Netherlands Organization for Scientific Research (NWO) VICI grant (No. 45307004) awarded to CK and by the Consortium on Individual Development (CID). CID is funded through the Gravitation program of the Dutch Ministry of Education, Culture, and Science and the NWO (Grant No. 024.001.003). The funding body had no involvement in the present study.
Declaration of conflicting interests
The author(s) declared no potential conflicts of interest with respect to the research, authorship, and/or publication of this article.
Funding
The author(s) received no financial support for the research, authorship, and/or publication of this article.