
Abstract
Background:
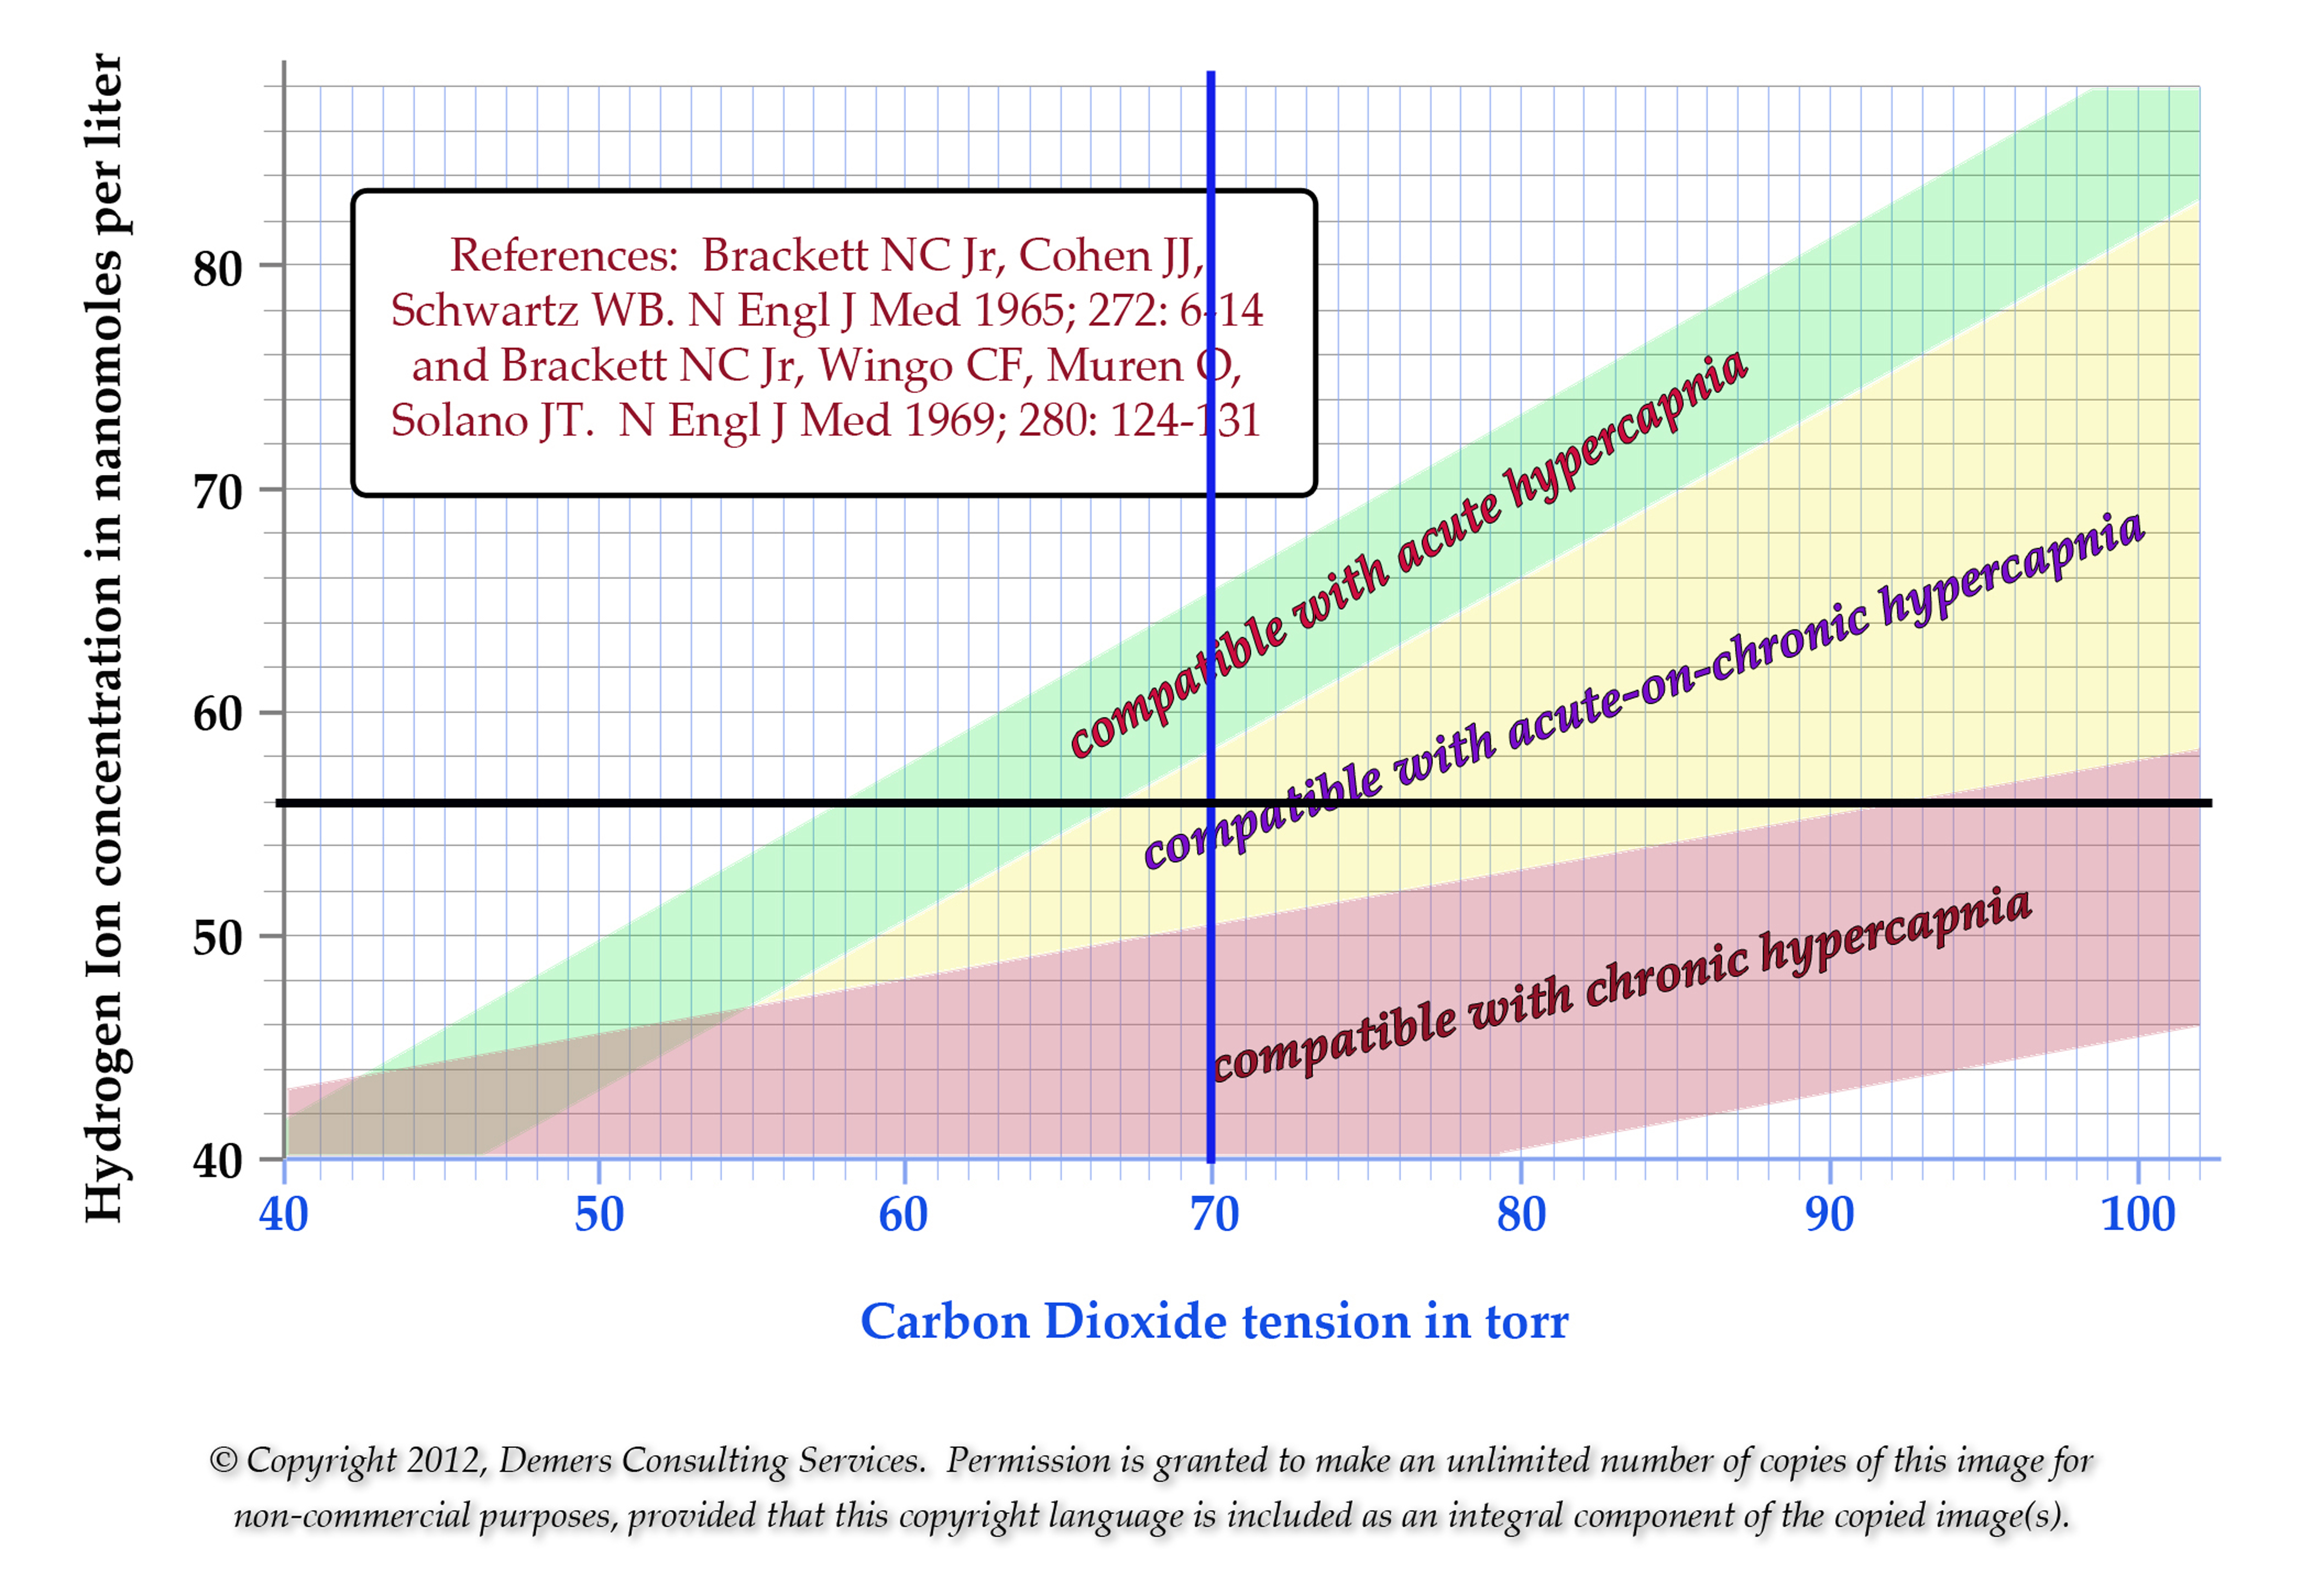
Brackett, Cohen, and Schwartz published a seminal research report (N Engl J Med 1965; 272: 6-12) describing the effects of escalating degrees of acute hypercapnia in man. Brackett, Wingo, Muren, and Solano subsequently published a classic monograph (N Engl J Med 1969; 280: 124-130) describing the effects of progressive degrees of chronic hypercapnia in the human organism. Because the clinical response to acute hypercapnia varies markedly from the therapeutic strategy employed to treat chronic hypercapnia, it is crucially important for clinicians to discriminate between the two presentations. We have generated a diagrammatic representation of the results of the authoritative and comprehensive studies cited above, and have posted that nomogram on the internet.
Methods:
First, the steady-state (linear) regression line relating arterial carbon dioxide tension (PaCO2; on the abscissa) versus arterial pH (pHa; on the ordinate) pertaining to acute hypercapnia was plotted on a rectilinear co-ordinate axis system, together with the so-called 95% confidence band. Next, the linear regression line relating PaCO2 versus pHa pertaining to chronic hypercapnia was plotted on an identical X/Y grid, together with its 95% confidence band. Then, these regression lines/confidence bands were combined within a composite Figure (see below). Finally, this graphic was coded to run on a server as a computer application (app), the Chronicity Map, and posted to the internet.
Results:
Clinicians navigate to the app by means of the following Universal Resource Locator (URL): http://acidbaseclinimap.com and key in the patient’s prevailing PaCO2 and bicarbonate ion concentration, which are retrieved from the patient’s arterial blood gas (ABG) Report. If the < PaCO2 exceeds 49 torr (and metabolic acidemia is absent), the Chronicity app launches automatically. Under computer control, a vertical line is scribed coinciding with the PaCO2, together with a horizontal line coinciding with the hydrogen ion concentration, in nanomoles per liter. The region within which those lines are observed to cross identifies the disorder as an acute, or chronic, or acute-on-chronic hypercapnia.
Conclusions:
Practitioners cannot be expected to memorize large arrays of data, such as the detailed results of clinical research studies, but networked computers can enable us to gain immediate access to the results of seminal investigations.
Get full access to this article
View all access options for this article.