
Abstract
Background:
Contrast-enhanced electrical impedance tomography (EIT) has emerged as a valuable tool for bedside monitoring of pulmonary ventilation and perfusion. It provides valuable information on the physiological mechanism underlying oxygenation responses to prone position (PP) in patients with ARDS. However, the impact of PP duration on the changes of ventilation and perfusion remains unclear.
Methods:
Mechanically ventilated ARDS patients who underwent PP were consented and included in this study after obtaining IRB approval (No. B2019-230(2)R). EIT evaluations and PaO2/FIO2 were performed at six time points during the first PP session: at supine position (SP) before PP initiation, 1 h after PP (PP1), 3 h after PP (PP3), 9 h after PP (PP9), the end of PP (PP16), and 3 h after returning to supine position (RE-SP3). Repeated ANOVA tests were used to compare the differences in the variables at six time points.
Results:
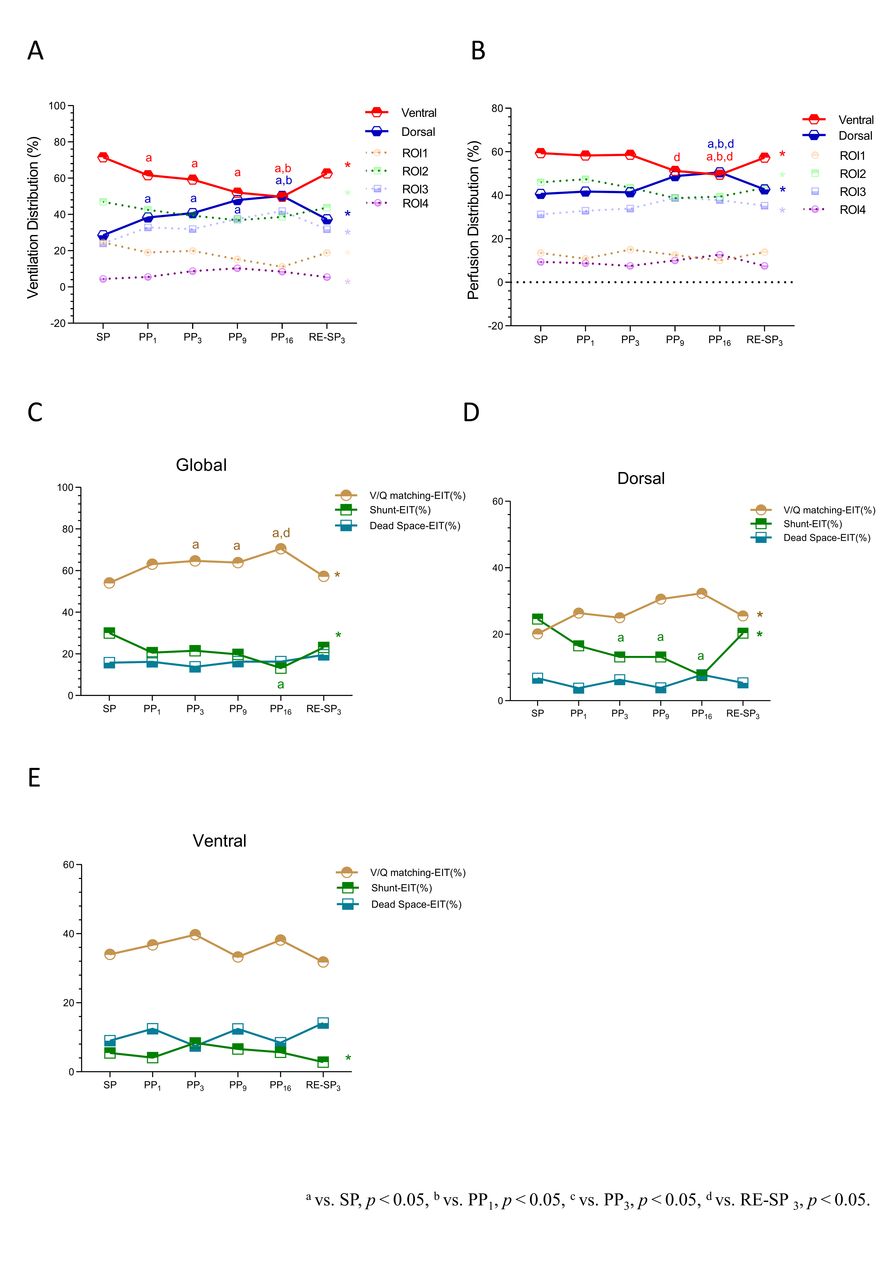
Eighteen patients (17 males) with a mean age of 72 ± 9 years were enrolled in this study. When comparing PP to SP, PP led to significant improvements in oxygenation. The PaO2/FIO2 ratio showed a steady increase with each PP session (all P < .05), peaking at PP16. Although PaO2/FIO2 decreased at RE-SP3, it remained higher than that at SP (163.8 ± 86.5 vs 110.7 ± 37.8 mm Hg, P = .003) (Fig 1). Compared to SP, dorsal ventilation significantly increased at PP1 (28.5 ± 9.2 vs 38.4 ± 12.0%, P = .047) while ventral ventilation significantly decreased at PP1 (71.5 ± 9.2 vs 61.6 ± 12.0%, P = .047) (Fig 2A), and they consistently changed as the PP duration increased, with more dorsal ventilation at PP16 than PP1 (50.3 ± 14.1 vs 38.4 ± 12.0%, P < .001) and less ventral ventilation at PP16 than PP1 (49.7 ± 14.1 vs 61.6 ± 12.0%, P = .021). Dorsal and ventral perfusion remained stable during the first three hours of PP, but dorsal perfusion started to increase and ventral perfusion started to decrease significantly at PP16 (Fig 2B). Compared to SP, there was a significant increase in global V/Q matching at PP3 (54.1 ± 17.5 vs 64.7 ± 13.9%, P = .008) (Fig 2C), primarily occurred in dorsal area (Fig 2D).
Conclusions:
Early improvement of oxygenation and global V/Q matching observed during PP was primarily attributed to the immediate and early alterations in ventilation distribution, which persisted throughout the middle and late stages. However, changes in perfusion were only evident during the middle and late stage of PP, contributing to further improvements in oxygenation and global V/Q matching.
Evolution of PaO2/FiO2 ratios at six time points during the first PP session: at supine position (SP) before PP initiation, 1h after PP(PP1), 3h after PP (PP3), 9h after PP(PP9), the end of PP(PP16), and 3h after returning to supine position (RE-SP3). Comparisons of Ventilation distribution(%) (A), Perfusion distribution (%) (B) at SP, PP1,PP3, PP9, PP16 and RE-SP3. Evolution of global V/Q matching (%), Shunt-EIT (%), and Dead space-EIT (%) at SP, PP1, PP3, PP9, PP16 and RE-SP3 (C). Evolution of V/Q matching (%), Shunt-EIT (%), and Dead space-EIT (%) at SP, PP1, PP3, PP9, PP16 and RE-SP3 in dorsal and ventral region at SP, PP1, PP3, PP9, PP16 and RE-SP3 (D, E).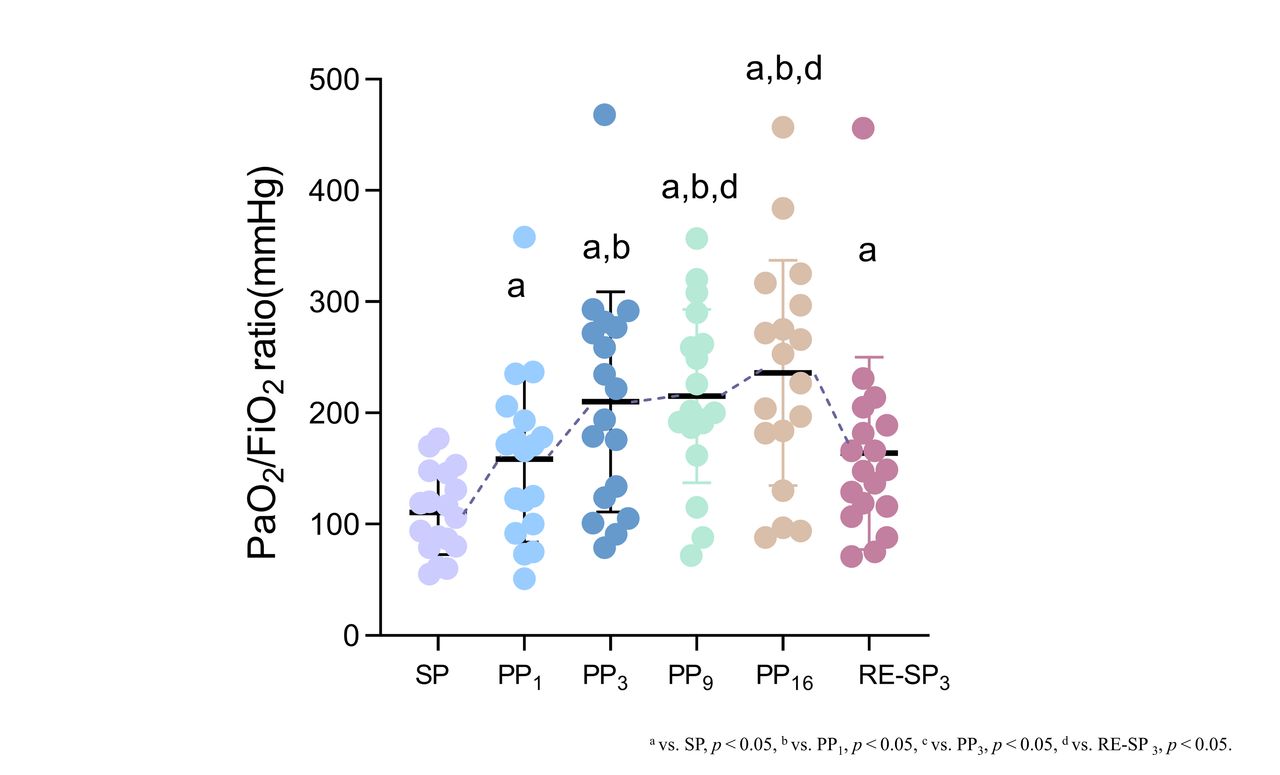
Get full access to this article
View all access options for this article.