
Abstract
Background:
The interpretation of ventilator waveforms is essential for effective and safe mechanical ventilation but requires specialized training and expertise. This study aimed to investigate the ability of ICU clinicians to interpret ventilator waveforms, identify areas requiring further education and training, and explore the factors influencing their interpretation skills.
Methods:
An international online anonymous survey was conducted upon approval by the Institutional Review Board. ICU clinicians (physicians, nurses, and respiratory therapists) with at least one year of experience were invited to participate. The survey consisted of demographic information and 15 multiple-choice questions related to ventilator waveforms. Results were compared between professions using descriptive statistics and logistic regression (expressed as odds ratios [OR, 95% confidence interval]) was performed to identify factors associated with >60% correct answers.
Results:
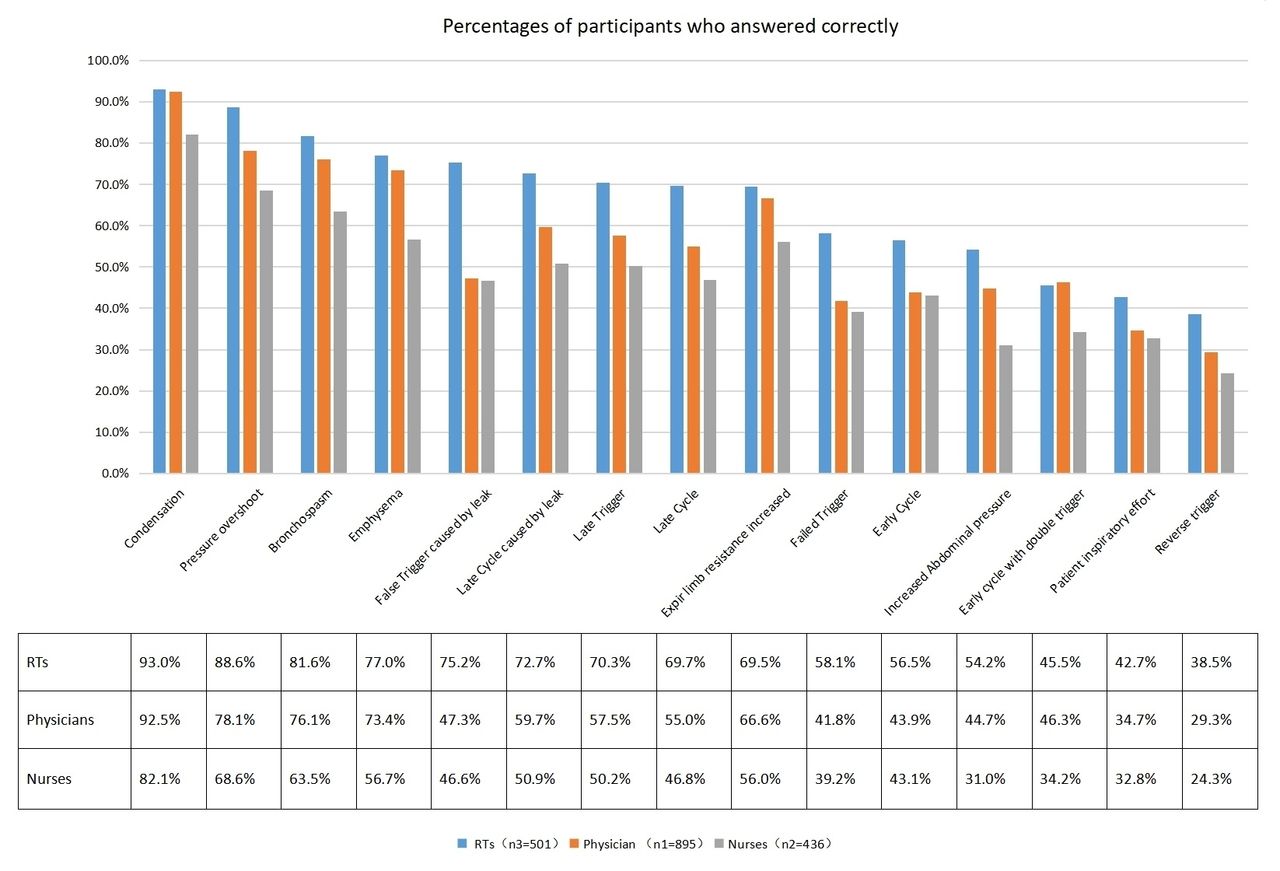
2,067 ICU clinicians from 31 countries participated, yielding 1,832 valid questionnaires with responses to all 15 waveform questions. 53% of respondents answered at least 60% of the questions correctly. The three questions with the highest correct responses were condensation (90%), pressure overshot (79%), and bronchospasm (75%). Conversely, the three questions with the lowest correct responses were early cycle with double trigger (43%), patient inspiratory effort (37%), and early (reverse) trigger (31%). Comparison across professions is included in Figure 1. Factors significantly associated with >60% correct answers included years of working experience (≥ 10 years, OR = 1.1.554 [1.218-1.983], P < .001), profession (respiratory therapist, OR = 2.814 [2.142-3.697], P < .001), highest degree earned (graduate, OR = 1.705 [1.326-2.192], P < .001), workplace (teaching hospital, OR = 1.376 [1.085-1.744], P = .008), and mechanical ventilation training (OR = 1.698 [1.299-2.219], P < .001) (see Table 1).
Conclusions:
Slightly over half respondents correctly identified at least 60% of waveform questions. Years of working experience, profession, highest degree earned, workplace, and mechanical ventilation training were significantly associated with improved interpretation skills. To enhance clinicians’ ability to interpret ventilator waveform, targeted education and training programs should be implemented.
The final Logistic regression model was statistically significant, P<0.001. The model was able to correctly classify 62.1% of the study subjects. The sensitivity of the model is 64.3%, the specificity is 59.6%, the positive predictive value is 64.6%, and the negative predictive value is 59.3%. Among the 5 variables included in the model, working years, profession, degree, whether it is a teaching hospital, MV training, are statistically significant. The AUC ROC of the model is 0.673.
Figure 1. Percentages of participants who answered correctly View all access options for this article.Table 1. Association of Training, Experience, and Profession With the odds of identifying ≥ 60% correct answers
Influential factors
OR
95%CI
P
Years of working experience
<5 yr
1
NA
NA
5-10 yr
1.258
0.992-1.597
0.059
≥10 yr
1.554
1.218-1.983
<0.001
Profession
Physician
1
NA
NA
Nurse
0.717
0.548-0.937
0.015
RT
2.814
2.142-3.697
<0.001
Degree
Undergraduate
1
NA
NA
Graduate
1.705
1.326-2.192
<0.001
Teaching hospital
1.376
1.085-1.744
0.008
MV training
1.698
1.299-2.219
<0.001
Get full access to this article