
Abstract
Background:
Adaptive support ventilation (ASV) has been proposed as a mode to generate a respiratory rate and tidal volume that will result in the minimum amount of work of breathing (WOB) for the patient. However, it is still unclear as to what degree manipulating the ASV settings will affect patient effort and WOB. Previously published work has suggested that manipulating ASV support can reduce patient WOB. However, when faced with a fixed patient effort, the displayed WOB and patient effort parameters can be difficult to interpret.
Methods:
Conducting a bench study using a lung simulator, 3 inspiratory muscle pressures (Pmus) were used as patient effort controls (-10, -20, and -30 cm H2O). A frequency of 18 breaths/min, lung compliance of 50 mL/cm H2O, and airway resistance of 10 cm H2O/L/s were used for all stages of testing. A single patient profile was used. Three ASV %MinVol settings were assessed (60, 100, 140%). Occlusion pressure (P0.1) and pressure time product (PTP) were measured when adjusting Ramp (0, 100, and 200 ms) and pressure trigger (-1, -2, and -3 cm H2O) at each %MinVol and Pmus setting.
Results:
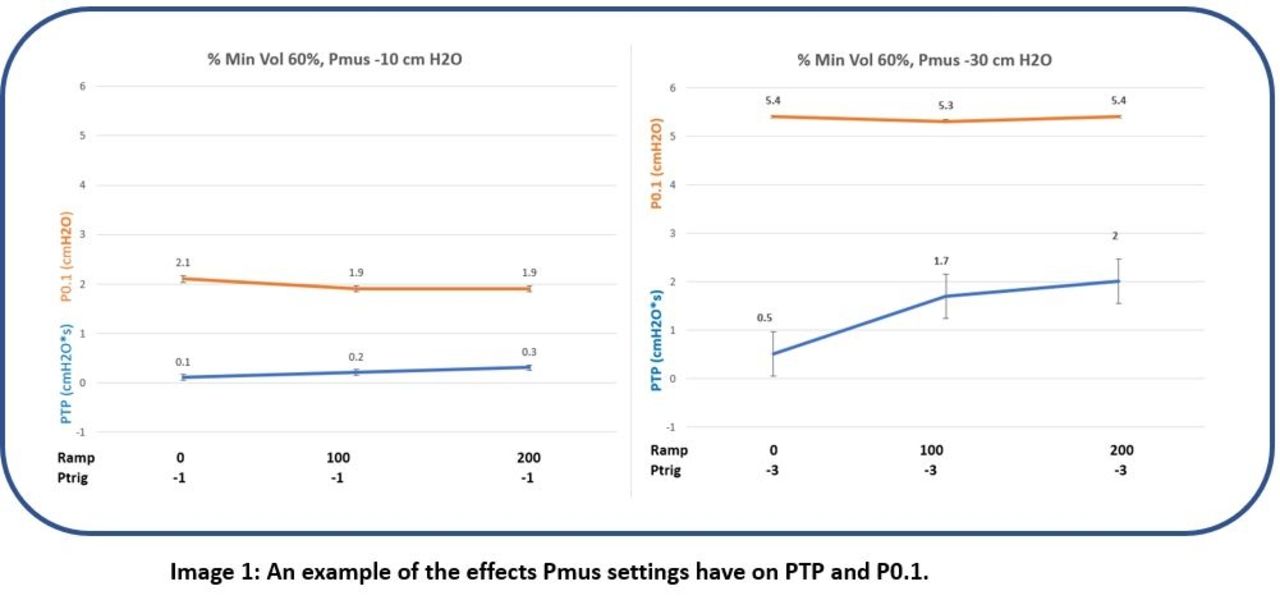
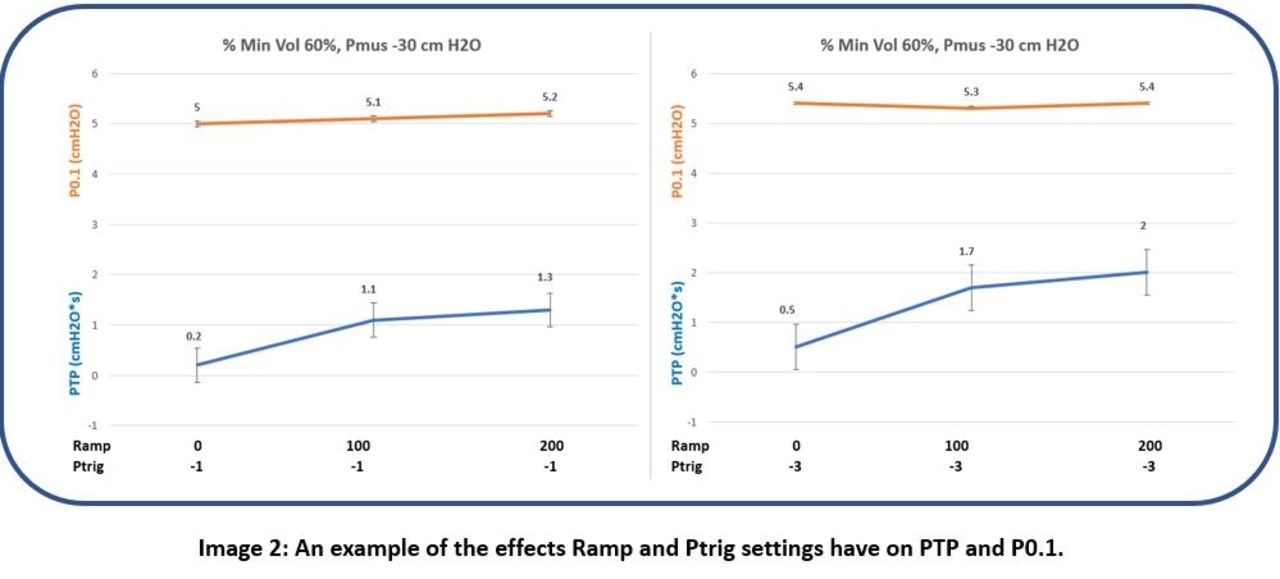
There was no observable difference in P0.1 within Pmus groups (Pmus -10 cm H2O: P0.1 (mean SD ± ) -1.98 [cm H2O], ± 0.08; Pmus -20 cm H2O: P0.1 -3.65, ± 0.09; Pmus -30 cm H2O: P0.1 -5.26, ± 0.15). However, there was a statistically significant difference in P0.1 when Pmus -10 was compared with Pmus -30 ( -1.98 ± 0.08 vs -5.26 ± 0.15; P < .001) (Image 1). PTP values demonstrated an incremental rise that was similar within Pmus groups (Pmus -10 cm H2O: 0.1 – 1.07 [cm H2O-s/min]; Pmus -20 cm H2O: 0.16 – 1.33; Pmus -30 cm H2O: 0.2- 2.0). PTP values increased with changes in Ramp from 0-200 ms and pressure trigger from -1 to -3 cm H2O (Image 2).
Conclusions:
Changes in ASV %MinVol setting did not affect P0.1 within Pmus groups. P0.1 values did increase with increasing inspiratory Pmus (-1.98, -3.65, and -5.26 cm H2O) indicating an expected increased patient effort. The P0.1 values at inspiratory Pmus of -20 and -30 cm H2O did accurately represent excessive patient effort. The increase in PTP values secondary to changes in Ramp and pressure trigger settings validates that PTP does not accurately represent total WOB by the patient. In our model, there was no effort or work of breathing change within Pmus groups. Consequently, this data more accurately represents how well the ventilator settings (Ramp and trigger) are adapted to the patient rather than an actual change in work of breathing by the patient.
Get full access to this article
View all access options for this article.