
Abstract
Background:
Burnout within healthcare is prevalent and its effects are detrimental to patient outcomes, organizations, and individuals. These include increased prevalence of anxiety, depression, excessive alcohol and drug use, cardiovascular problems, and time off work. Prior data has suggested up to 50% of healthcare workers and up to 72% of respiratory therapists (RTs) experience burnout. Leadership has been cited as a key driver of burnout among RTs. We aimed to identify factors associated with a positive or negative leadership perception.
Methods:
A post-hoc analysis of an IRB-approved survey to evaluate RT burnout, administered via REDCap by convenience sample to 26 respiratory care departments in healthcare centers from January 17– March 15, 2021, was performed to identify factors associated with a positive view of leadership. Survey questions included validated tools to measure leadership, burnout, staffing, COVID-19 exposure, and demographics. Data analysis was descriptive and logistic regression was performed to evaluate factors associated with leadership perception.
Results:
Of the 1,080 responses, 710 (66%) had a positive view of leadership. Univariate analysis revealed those with a positive view of leadership were less likely to be working without adequate staffing, rarely unable to complete all work, less likely to be burned out, disagree that people in this work environment were burned out, less likely to miss work for any reason, less likely to care for adult patients, more likely to be in a leadership position, working fewer hours in intensive care, working in a center affiliated with a medical school, working day shift, and more likely to be male. Logistic regression revealed providing care to COVID-19 patients (OR 5.8 to 10.5, P < 0.001 to 0.006) was the only factor associated with a positive view of leadership while working without adequate staffing (OR 0.27 to 0.28, P = 0.002 to 0.006), staff therapist (OR 0.33, P < 0.001), work environments (OR 0.42, P = 0.003), missing work for any reason (OR 0.69, P = 0.003), and burnout score (OR 0.98, P < 0.001) were associated with a negative view of leadership.
Conclusions:
Most RTs had a positive view of their leadership. A negative leadership score was associated with higher burnout and missing work. This relationship requires further investigation to evaluate if changes in leadership practices can improve employee well-being and reduce burnout.
Table 1 displays the results from survey questions as they correlate with positive and negative views of leadership.
Figure 1 shows the responses to survey questions related to leadership positions and burnout. View all access options for this article.Analysis for Respondents with Positive vs. Negative Views of Leadership
Question
Leadership Score Positive
Leadership Score Negative
p
Staffing
In the last month, how many shifts have you worked without adequate staffing, nAlways (0%)Frequently (adequately staffed for < 50% of shifts)Occasionally (adequately staffed for 50-74% of shifts)Rarely (adequately staffed for 75-99% of shifts)Never (adequately staffed for 100% of shifts
70167 (9.6%)170 (24%)232 (33%)161 (23%)71 (10%)
36776 (21%)151 (41%)82 (22%)46 (13%)12 (3.3%)
<0.001
In the past month, what percentage of your shifts have you provided direct patient care to COVID-19 patients, n100%75-99%50-74%< 50%Do not provide direct patient care
706195 (28%)183 (26%)102 (14%)182 (26%)44 (6.2%)
37096 (26%)106 (29%)59 (16%)92 (25%)17 (4.6%)
0.64
In the past month, what percentage of shifts have you been unable to complete all your work, n100%75-99%50-74%< 50%< 25%0%Do not provide direct patient care
70627 (3.8%)80 (11%)57 (8.1%)87 (12%)214 (30%)210 (30%)31 (4.4%)
36822 (6.0%)55 (15%)56 (15%)49 (13%)115 (31%)68 (189%)4 (1.1%)
<0.001
Leadership Behaviors
Leadership score, nScore
75375 (60-85)
36430 (20-40)
<0.001
Leadership Quartile1 - Lowest234 - Highest
706114 (31%)256 (69%)0 (0%)0 (0%)
3700 (0%)0 (0%)325 (46%)381 (54%)
<0.001
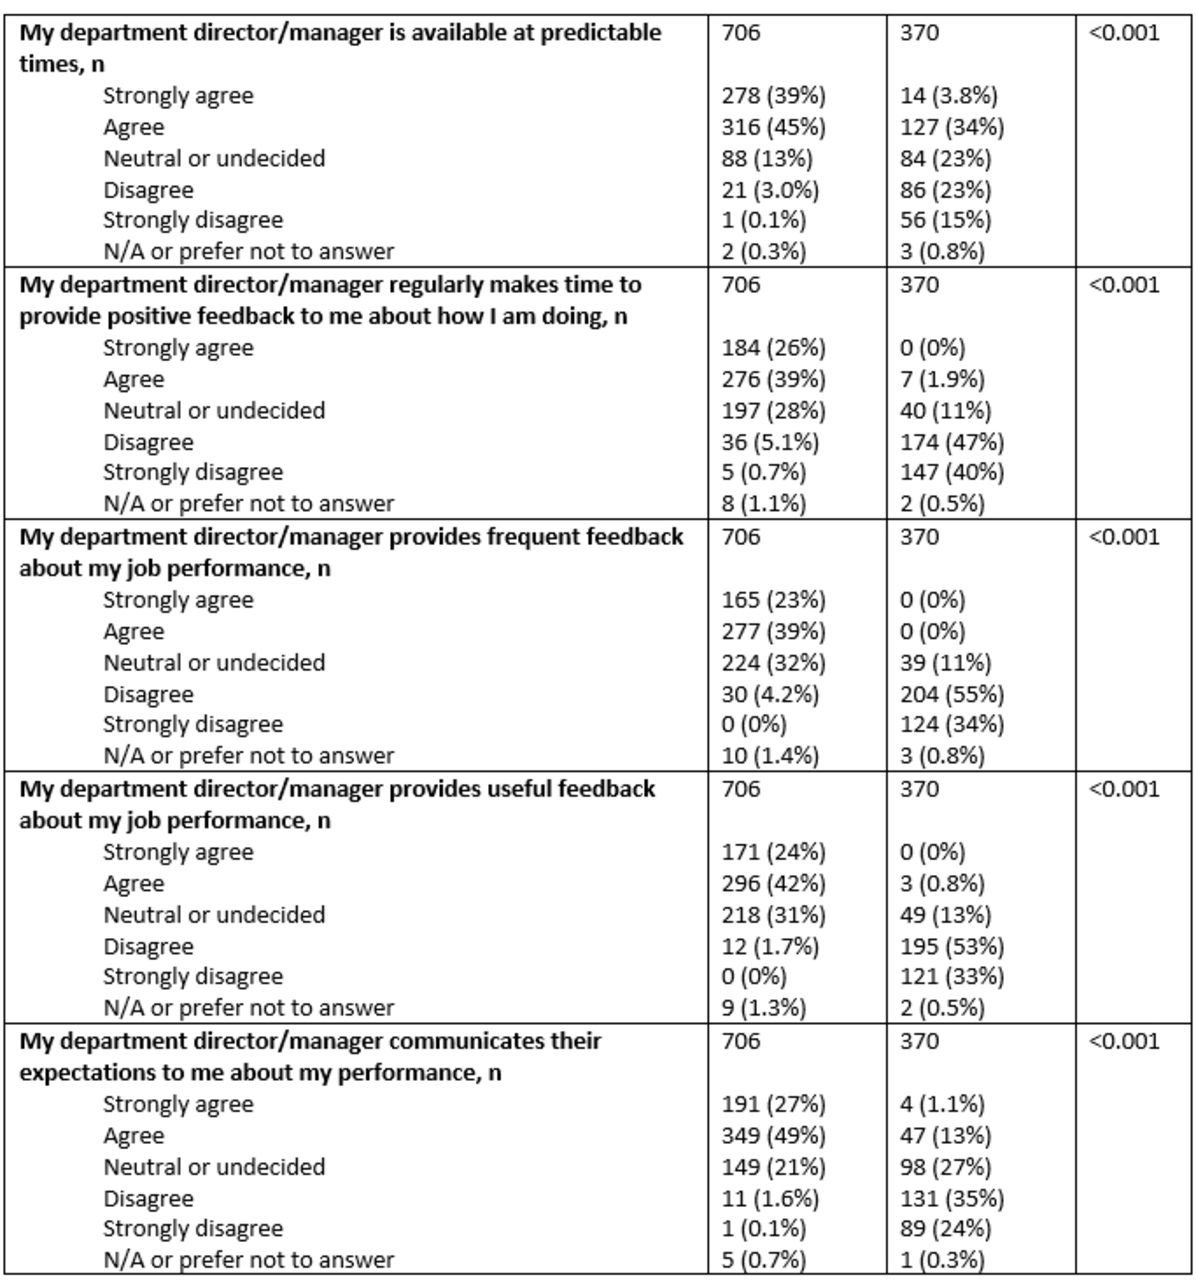
My department director/manager is available at predictable times, nStrongly agreeAgreeNeutral or undecidedDisagreeStrongly disagreeN/A or prefer not to answer
706278 (39%)316 (45%)88 (13%)21 (3.0%)1 (0.1%)2 (0.3%)
37014 (3.8%)127 (34%)84 (23%)86 (23%)56 (15%)3 (0.8%)
<0.001
My department director/manager regularly makes time to provide positive feedback to me about how I am doing, nStrongly agreeAgreeNeutral or undecidedDisagreeStrongly disagreeN/A or prefer not to answer
706184 (26%)276 (39%)197 (28%)36 (5.1%)5 (0.7%)8 (1.1%)
3700 (0%)7 (1.9%)40 (11%)174 (47%)147 (40%)2 (0.5%)
<0.001
My department director/manager provides frequent feedback about my job performance, nStrongly agreeAgreeNeutral or undecidedDisagreeStrongly disagreeN/A or prefer not to answer
706165 (23%)277 (39%)224 (32%)30 (4.2%)0 (0%)10 (1.4%)
3700 (0%)0 (0%)39 (11%)204 (55%)124 (34%)3 (0.8%)
<0.001
My department director/manager provides useful feedback about my job performance, nStrongly agreeAgreeNeutral or undecidedDisagreeStrongly disagreeN/A or prefer not to answer
706171 (24%)296 (42%)218 (31%)12 (1.7%)0 (0%)9 (1.3%)
3700 (0%)3 (0.8%)49 (13%)195 (53%)121 (33%)2 (0.5%)
<0.001
My department director/manager communicates their expectations to me about my performance, nStrongly agreeAgreeNeutral or undecidedDisagreeStrongly disagreeN/A or prefer not to answer
706191 (27%)349 (49%)149 (21%)11 (1.6%)1 (0.1%)5 (0.7%)
3704 (1.1%)47 (13%)98 (27%)131 (35%)89 (24%)1 (0.3%)
<0.001
Get full access to this article