
Abstract
Background:
New generation ventilators display dynamic measures of respiratory mechanics: Compliance (Cstat), Resistance (Rinsp), auto-PEEP. Those measurements are obtained automatically using the 'least square fitting method' of the equation of motion. The accuracy of those measurements in static and dynamic conditions hasn't been validated.
Methods:
Bench study using lung simulator (ASL) to compare the automated measurements during passive condition using muscle pressure (Pmus) of zero cm H2O, and active condition using incremental Pmus of 5, 10, 15 cm H2O in different clinical situations: Normal (compliance 50 cm H2O and resistance 10 cm H2O/L/s), COPD (50 cm H2O and resistance 20 cm H2O/L/s), and ARDS (30 cm H2O and resistance 13 cm H2O/L/s using the adaptive support mode (ASV) mode in Hamilton G5 ventilator (Hamilton Medical, Switzerland).
Results:
Comparisons between Test lung and passive and active conditions in the three different scenarios were done using paired T test of equal variance. Correlation of Pmus with compliance and resistance in the three different scenarios were done using the Pearson correlation coefficient. There were statistically significant differences between the compliance and resistance in all the three conditions between the test lung and both passive and active patients. There is a strong positive correlation between Pmus and calculated compliances. There is a strong negative correlation between the Pmus and the calculated resistances.
Conclusions:
Automated displayed measurements of respiratory mechanics are not dependable or accurate in active patients. Though statistically different, the measurements were clinically more reliable in passive patients. The effect of muscle pressure is ignored in the automated calculation and has to be measured and incorporated for accurate measurements. Ventilator manufacturers should put a warning to alert clinicians of those inaccuracies to avoid misinterpretation and mistreatment.
Disclosures:
None.
Fig A: correlation between muscle pressure (Pmus) and compliance Fig B: correlation between muscle pressure (Pmus) and resistance Normal lung: Blue diamonds COPD lung: Pink squares ARDS lung: Yellow triangles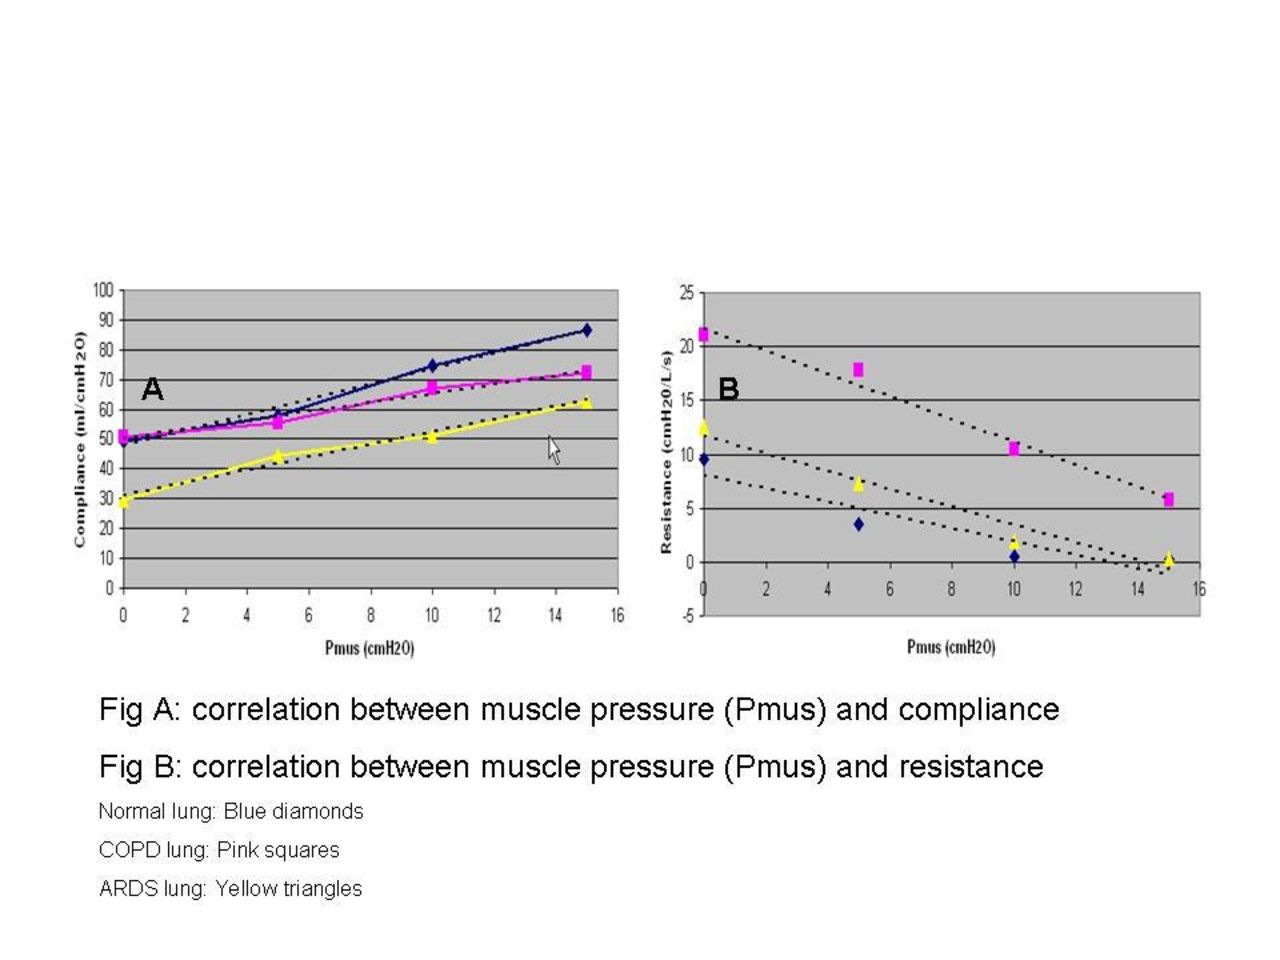
Get full access to this article
View all access options for this article.