
Abstract
A spectrum of neuropsychiatric abnormalities caused by portosystemic venous shunting occurs in hepatic encephalopathy (HE) patients with or without liver dysfunction. It is not completely clear how the astrocyte swelling leads to glial-neuronal dysfunction, and how the symptoms are manifested in HE. A major goal of this work is to review the current status of information available from the existing magnetic resonance (MR) modalities including MR imaging (MRI) and MR Spectroscopy (MRS) as well as other modalities in the understanding the pathogenesis of HE. First, we discuss briefly neuron-histopathology, neurotoxins, neuropsychological and neurophysiological tests. A short review on the progress with single-photon emission computed tomography (SPECT) and positron emission tomography (PET) is then presented. In the remaining part of the manuscript, the following topics pertinent to understanding the pathogenesis of HE are discussed: MRI, diffusion tensor imaging (DTI), one-dimensional MRS based single- and multi-voxel based spectroscopic imaging techniques and two-dimensional MRS.
Introduction
As the term implies, ‘Hepatic Encephalopathy’ is a neuropsychiatric complication primarily due to liver dysfunction, which in turn, could be due to hepatocellular failure and/or portosystemic shunting (Fraser and Arieff, 1985; Trzepacz et al. 1991). Like most organ dysfunctions, liver failure presents itself as acute liver failure (ALF), chronic liver failure (CLF), and acute-on-chronic liver failure (ACLF). ACLF is defined as an acute deterioration of liver function in patients with previously well-compensated chronic liver disease following acute hepatitis A or E superimposed on underlying liver cirrhosis (Nath et al. 2008). Because of the large variation in progression and presentation of liver disease, its concomitant neuropsychiatric manifestations in Hepatic Encephalopathy (HE) are also wide-ranging: from mild cognitive impairment, altered sleep patterns, to ataxia and coma. The heterogeneity of clinical presentation makes the diagnosis of ALF, CLF, and ACLF difficult. However, the time frame of these overlapping clinical profiles is different in different forms of liver failure. In the case of acute HE the range of manifestations could be in the course of hours or days. However, for a majority of patients with compromised liver function, HE or ‘minimal HE’ (MHE) can exist either as a continuing remission or relapse while awaiting liver transplantation. ‘Minimal HE’ is defined as the presence of cognitive impairment on psychometric testing and/or slowing of electroencephalographic (EEG) mean cycle frequency in the absence of any clinically overt signs (Ferenci et al. 2002). Thus, at its base, HE syndrome remains a neuropsychiatric complication and hence, traditionally, diagnosed by neuropsychological (NP) tests, which are not very specific and do not reveal the underlying pathology. Recent studies have identified cerebral edema in all forms of liver disease, and hence, HE developed as a result of ALF, CLF, or ACLF, is thought to be closely associated with cerebral edema although the nature and type of cerebral edema is found to be different in different forms of liver failure (Nath et al. 2008).
This article will first briefly explore the current information from non-MR modalities in the understanding the pathogenesis of HE and then look into how MR is contributing to this continually developing hypothesis of the pathogenesis of HE.
Neuro-Histopathology and Neurotoxins
Nuclear enlargement and diffuse increase in the number of protoplasmic astrocytes (Alzheimer type II astrocytes) were first reported by von Hosslin and Alzheimer in 1912 (von Hosslin and Alzheimer, 1912). However, the biochemical mechanism leading to the histopathology and its subsequent relationship in the sequelae of clinical manifestations, to this day, remain incompletely understood. Ammonia has been the prime suspect in the list of various neurotoxins associated with the histopathology of astrocyte swelling and the manifestation of clinical symptoms. Over a century ago, Eck suggested ammonia as the causative factor in the phenomenon of “meat intoxication” in dogs with portal vein ligations, exhibiting symptoms of loss of coordination, stupor, and coma (Eck, 1877; Magnus-Alsleben, 1920; Mathews, 1922). However, in some studies, it has been shown that plasma ammonia levels do not categorically correlate with the severity of HE (Ehrlich M, 1980). It has thus been suggested that not hyperammonemia (owing to hepatic dysfunction and/or portosystemic shunting) but ammonia metabolism may be responsible for the cerebral dysfunction seen in HE (Hawkins, 1993; Rose, 2005). Based on in vitro studies and animal models, several other hypotheses that include or exclude the role of ammonia in trying to explain the cerebral dysfunction observed in HE have also been proposed in the last few decades. These include the glutamatergic synaptic regulation (Butterworth, 1994), effects of ammonia on inhibitory neurotransmission (Raabe, 1989), changes in neurotransmitter systems and receptors (Fischer and Baldessarini, 1971), synaptic deficit of serotonin (Raghavendra, 1993), increased GABA-ergic tone (Baker, 1990; Rossle, 1989; Basile AS, 1991; Jones EA, 1991), and the role of osmotic and oxidative stress in HE (Schliess F, 2006).
Neuropsychological and Neurophysiological Tests
Since the hallmark of the syndrome is neuropsychiatric, several test batteries have been used by many groups (Thomas, 1998; Weissenborn, 2001; Schomerus, 1981; Watanabe, 1995; Zeneroli, 1992). These batteries includes tests like number connection tests (NCT), color trails 1 and 2, Rey Auditory Verbal Learning test, Rey-Osterrith Complex Figure test, Grooved-Pegboard test, Symbol Digit Modalities test, Stroop (color, word, and interference) test, Control Oral Word Association test (FAS), Wisconsin Card Sorting Test and others. The test scores are often grouped to better elicit which domains are significantly affected. The most common impairments reported are in the areas of attention, visuospatial functions, and psychomotor speed and processing. While the correlation of the NP tests with the severity of HE has been somewhat consistent in the literature, NP tests are non-specific to HE and in of itself do not propose any mechanism linking the clinical symptoms to the liver dysfunction.
Neurophysiological studies include the electroencephalograms (EEG), evoked potentials (EPs), and critical flicker frequency (CFF). Of these, EEG has shown no clear correlation with the severity of HE (Amodio, 1996; Hollerbach, 1997), EPs exhibit a lower sensitivity than NP tests and require trained personnel (Davies, 1990), and CFFs are subject to influence of other factors (Haussinger, 2006).
Single-Photon Emission Computed Tomography (SPECT) and Positron Emission Tomography (PET) Studies in HE
Since ammonia has been at the center of the neurotoxin hypothesis, it makes sense to measure the cerebral metabolic rate (CMR) of ammonia via N-13 PET studies. Lockwood et al. have reported both a rise in cerebral metabolic rate of ammonia for patients with minimal HE as well as an increase in the permeability-surface area (PS) product for ammonia. The rise in PS may offer an explanation of the permeability of the blood-brain-barrier (BBB) and sometimes near-normal arterial ammonia concentration found in patients with HE (Lockwood, 1991a; Lockwood, 1992).
The same group has also studied cerebral blood flow (CBF) via O-15 water PET and cerebral metabolic rate of glucose utilization (CMRglc) via F-18 FDG PET (Lockwood, 1991b; Lockwood, 1993). They found that for whole-slice CBF and CMRglc, the values were no different in this group of patients versus healthy controls. However, for both CBF and CMRglc, there was a highly significant difference in the pattern of flow and metabolism. Higher values for both flow and metabolism were observed in the cerebellum, thalamus, and caudate in patients and lower values in the cortex. The authors have suggested that HE may be the result of a multifocal as opposed to global disorder of cortical function.
Recently, Weissenborn et al. have reported both F-18 FDG and CMRNH3 in patients with HE (Weissenborn, 2007). They found similar alteration in cerebral glucose utilization as reported by Lockwood et al. except for a decrease in glucose metabolism in the motor cortex and stable or increased glucose utilization rate within the frontolateral cortex. Interestingly, they found no correlation between the N-13 ammonia metabolic rate and the cerebral glucose utilization rate.
There are not many studies reported on the use of SPECT and CBF. Of the few studies, that are reported, the results are contradictory. These SPECT studies predominantly use Tc-99m-hexamethyl propyleneamine oxime (HMPAO) or Tc-99m ethyl cysteinate dimmer (ECD). In healthy controls, highest CBF is found to be in caudate and lenticular nucleus, the posterior cingulated, and the cerebellum. There is an inverse correlation observed between age and CBF in the frontal cortex until the age of 50 (Van Laere et al. 2001).
In cirrhotic patients, Catafau et al. have shown via Tc-99m-HMPAO-SPECT, hypoperfusion in the left prefrontal cortex (including the anterior cingulate gyrus) when compared with healthy controls. The same study also shows poor neuropsychologic performance correlated with high perfusion in limbic and limbic-connected regions such as the striatum and mesial temporal region (Catafau et al. 2000). Studies with Tc-99m-ECD-SPECT by Iwasa et al. also show a significant decrease in blood flow in the anterior cingulate gyrus and in the frontal lobes of cirrhotics compared to healthy controls (Iwasa et al. 2005). On the other hand, Yazgan et al. report an increased cerebral blood flow in the frontal area in chronic hepatitis patients and in cirrhotic patients when compared with controls (Yazgan et al. 2003).
Magnetic Resonance Imaging (MRI) and HE
In 1991, Inoue et al. for the first time reported unusual lesions with high signal intensity in the basal ganglia in T1-weighted MR images of patients with HE, which had a correlation with the size of the porto-systemic collateral vessels (Inoue 1991). In the same year, Zeneroli et al. also reported globus pallidus alterations and brain atrophy in liver cirrhosis patients with encephalopathy (Zeneroli, 1991). Since then several reports have shown the presence of these lesions on T1-weighted images that are not seen on T2-weighted images (Brunberg, 1991; Kulisevsky, 1992; Pujol, 1993; Thuluvath, 1995). This is the only unusual finding seen on an MRI besides the structural alterations expected in alcoholic patients as shown in Figure 1. Cerebral edema is seen in patients with fulminant hepatic failure (Wijdicks EF, 1995) but conventional MR imaging does not show any edema in patients with chronic HE (Crippin, 1992; Cordoba, 1996).
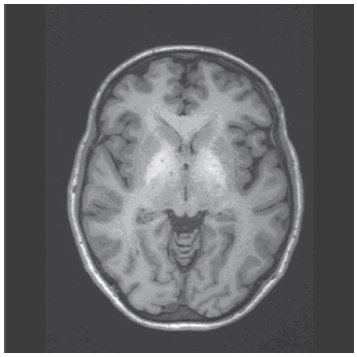
T1-weighted axial MRI of a patient with HE showing the hyperintense lesions in the globus pallidus.
The hyperintensity in the globus pallidus regions suggests the accumulation of a paramagnetic substance in these patients. Manganese (Mn) has been proposed as a leading candidate since manganese accumulation in the globus pallidus has been found in patients receiving total parenteral nutrition (Mirowitz, 1991; Mirowitz, 1992; Ejima, 1992). In addition, blood manganese concentration has been measured and found to be elevated in patients with cirrhosis (Hauser, 1996). These levels have also been correlated with the pallidal signal intensity (Krieger, 1995) and substantiated further with autoptic brain tissues of patients who have shown the MR alteration (Maeda, 1997).
However, pallidal hyperintensity has not been correlated with clinical encephalopathy in several studies (Thuluvath, 1995; Geissler, 1997) perhaps, because manganese accumulation is more of an indication of the extent of portal-systemic shunting and may explain some of the extra-pyramidal motor abnormalities seen in chronic HE but not the psychiatric ones. In addition, in a subset of patients with cirrhosis and moderate to severe chronic parkinsonism, T1-weighted images show extensive hyperintensities involving both the globus pallidus and substantia nigra with whole blood concentration of manganese, in the same range as those reported in patients with symptomatic occupational Mn exposure (Burkhard, 2003). These lines of evidence along with the fact that liver transplantation provides normalization of both the MRI abnormalities and Mn levels seem to confirm the suspicion of manganese being the responsible agent for the hyperintensity on the T1-weighted images (Pujol, 1993).
Signal alterations in T2-weighted MR images in chronic HE are less frequently reported. However, there have been studies showing T2 hyperintensity along the cortico-spinal tract in the brain of cirrhotic patients which were reversed after liver transplantation using the fast-fluid attenuation inversion recovery (FLAIR) sequence (Cordoba, 2003; Rovira, 2002). The authors also report a mild functional impairment of the cortico-spinal tract in these patients as measured by trans-cranial magnetic stimulation (TMS) along with a decrease in magnetization transfer ratios (MTR) on magnetization transfer imaging. Severe decrease in MTRs is usually associated with myelin damage, cell destruction, etc. However, the decrease observed in these cases is quite mild and reversible after liver transplantation in parallel with improvements in neuropsychological function. All of this has linked chronic HE to the presence of mild cerebral edema.
1D Single Voxel Magnetic Resonance Spectroscopy and HE
In 1990, Kreis et al. published a letter in the journal ‘The Lancet’, demonstrating that single-voxel proton MR spectroscopy of the parietal cortex showed a remarkable triad of changes in cerebral metabolites in patients with chronic HE when compared to healthy controls (Kreis, 1990). This signature was an increased glutamine/glutamate (Glx) to creatine (Cr) ratio, significant reduction in myoinositol (mI) to Cr ratio, and a decline in choline (Cho) to Cr ratio. Since then many studies in the literature have appeared showing essentially the same signature in patients with chronic HE (Kreis, 1991; Chamuleau, 1991; Chamuleau, 1994; Kreis, 1992; Haussinger, 1994; Huda, 1998; Thomas, 1998) as shown in Figures 2a–c.
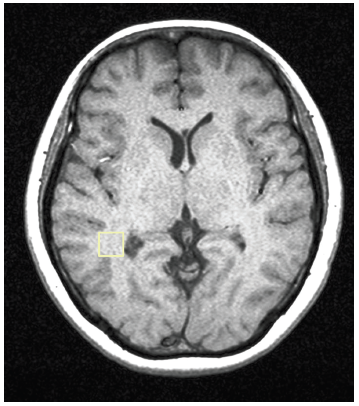
T1-weighted axial MRI of a patient with HE showing the MRS voxel localized in the parietal region.

A PRESS-localized 1D spectrum of healthy control and processed using LC-Model.

A PRESS-localized 1D spectrum of a HE patient and processed using LC-Model.
Besides proton MR spectroscopy, P-31 MR spectroscopy has also been implemented in patients with chronic HE. The typical P-31 MR spectrum contains resonances assigned to phosphomonoesters (PME), inorganic phosphate (Pi), phosphodiesters (PDE), phosphocreatine, γATP, αATP, and βATP, all providing information on energy metabolism. However, no single consensus has emerged from these studies although one group has consistently demonstrated reduction in PME and PDE to βATP ratio (Taylor-Robinson, 1999; Patel, 2000; Taylor-Robinson, 1994).
What is the significance of the changes observed with MR spectroscopy in view of the findings from other non-MR modalities? The significance of the cerebral metabolites observed with MR spectroscopy was itself being debated at the time the signature reports were coming out. In addition, since neuropsychological tests were the reigning gold standard for detection of HE, many published reports have shown some correlation of the MR findings to either individual NP tests or grouped NP tests reflecting a domain of function such as memory, executive, etc. Reports have also been published on reversal of some of the signature changes observed with MR spectroscopy post liver transplantation (Huda, 1999).
The same triad of changes has also been observed in other regions of the brain such as the anterior cingulate gyrus, right basal ganglia, and the left occipital white matter although the level of statistical significance is different (Binesh, 2006). Recently, our group has also done chemical-shift imaging in patients with HE against healthy controls.
MR spectra can be recorded in multiple locations of a slice (2D) or a volume (3D) using a technique called chemical shift imaging (CSI) or MR spectroscopic imaging (MRSI). The CSI sequence uses STEAM or PRESS for choosing the volume of interest (VOI) and two or three phase encoding gradients for the 2D or 3D spatial encoding. Shown in Figure 3 are the 2D CSI spectra recorded in a healthy subject (b) and a minimal chronic HE patient (c) with an axial MRI slice showing the MRS location (a). Using the spectrum extracted from each location of the CSI data, metabolite ratios of Cho, mI, Glx and N-Acetyl aspartate (NAA) relative to Cr can be measured. Significant reductions in the ratios of mI/Cr and Cho/Cr, and elevations in the Glx/Cr ratio were observed in the patient population, which correlated with the severity of chronic HE. There were significant regional variations in these metabolite ratios with the mean Cho/Cr being the lowest in the occipital cortex and the mean Glx/Cr the highest in the basal ganglia. NAA/Cr remained relatively constant in most of the brain areas. The observed regional variations in the metabolite ratios suggest that spectral information from more than one voxel may be useful in the assessment of patients with HE (Kreis et al. 1990; Chamuleau et al. 1991; Kreis et al. 1991).

CSI spectra recorded in a healthy control (b) and a HE patient (c) with a representative axial MR image (a).
How does one interpret these findings? As mentioned above, in vitro studies, animal models, and in-vivo PET studies in humans have all confirmed increased cerebral ammonia and a higher permeability of the BBB for ammonia. It has been long known that the only compartment in the brain that can detoxify ammonia are the astrocytes (Martinez, 1977). Ammonia is metabolized via glutamine synthetase (GS) mediated amidation of glutamate (Glu) into glutamine (Gln) (Berl, 1962; Clarke, 1962). Gln is transferred back to the neuron to be hydrolyzed by phosphate-activated glutaminase (PAG) to Glu. This Gln-Glu cycle is coupled to brain energy metabolism and the oxidative glucose metabolism in the brain (Zwingmann, 2007). If we start from the observed clinical manifestations of HE and work backwards towards a glial origin, the displayed symptoms must reflect a disturbed glial-neuronal complication, which may be derived from a dysfunction in the astrocytes as other evidence mentioned above has pointed to. What exactly is the disturbed glial-neuronal complication has still to be completely understood but the MRS data does point to perhaps, the mechanism of dysfunction in the astrocytes. One suggestion put forth is that ammonia might exert a direct effect on neuronal function and its detoxification in the astrocytes thereby producing Gln might be to avoid the cerebral ammonia toxicity. Gln synthesis is tied to glia pyruvate carboxylation and thus, the neuronal toxicity seen in HE may not be due to accumulation of Gln in the astrocytes but a limited capacity of the astrocytes to increase pyruvate carboxylase flux (Zwingmann, 2007). However, the more published hypothesis is that in chronic HE, the accumulation of Gln in the astrocytes due to detoxification of ammonia results in astrocyte swelling, which should then lead to cerebral edema (Albrecht, 2001; Blei, 1994).
Whether there is not enough glutamine synthesis in astrocytes to detoxify ammonia or enough accumulation in the astrocytes, the MRS peaks, which represent a mixture of Gln and Glu at the magnetic field strengths used in the clinic, do show an increase in all forms of liver disease, i.e. acute liver failure (ALF), chronic liver disease (CLD, and acute-on-chronic liver failure (ACLF). In a recent article, Verma et al. have shown convincingly that the increase of Glx/Cr in ALF patients was significantly higher compared with ACLF and CLD patients (see Fig. 4). But the more interesting story is the ratio of mI/Cr.

LC model processed 1D spectrum recorded in a patient with acute liver failure (ALF) (Verma et al. 2007).
mI is an organic osmolyte presumed to serve as a compensatory tool of astrocytes to buffer ammonia-induced increase in glutamine within the astrocytes. However, effective compensation shifts takes time for astrocyte volume homeostasis. As shown in Table 1, ALF happens too rapidly to allow this compensatory shift and hence, mI/Cr ratio is not significantly different in patients with ALF compared to the healthy controls even though Glx/Cr is significantly higher.
Peak integrals relative to those of creatine (mean ± standard deviation) in the parietal white and grey matter of patients with acute-on-chronic liver failure, acute liver failure, and chronic liver disease compared with healthy controls. (Verma et al. 2007).
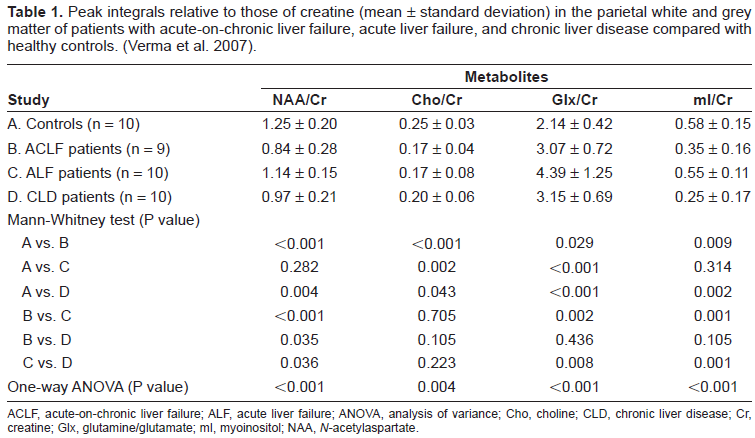
ACLF, acute-on-chronic liver failure; ALF, acute liver failure; ANOVA, analysis of variance; Cho, choline; CLD, chronic liver disease; Cr, creatine; Glx, glutamine/glutamate; mI, myoinositol; NAA, N-acetylaspartate.
The decrease in Cho/Cr and its role in the pathogenesis of HE remains somewhat murky. Several articles have proposed metabolic changes, altered transport mechanisms, decreased nutritional uptake, and liver dysfunction as possible causes (Galea, 1992; Klein, 1993; Rao, 1994; Chawla, 1989). It has been shown to significantly increase when compared to healthy controls post liver transplant but its cause cannot be ascertained clearly due to the intake of many pharmaceuticals post-liver transplantation (Huda, 1999).
The osmolar battle between ammonia, glutamine, and other osmolytes to maintain astrocytic volume homeostasis in chronic HE may have other functional consequences such as oxidative stress in addition to the possibility of other non-ammonia factors contributing synergistically or independently to astrocyte swelling. This has prompted investigators to re-look at the possibility of a low-grade cerebral edema in chronic HE via non-conventional MR imaging methods. Diffusion Tensor MR Imaging is one such application.
Diffusion Tensor MR Imaging and HE
MTR and fast FLAIR sequences do point to mild brain edema in chronic HE but are unable to distinguish whether this increase of water content is intracellular or extracellular. This is better resolved with diffusion weighted or tensor imaging (DWI/DTI) (Rovira, 2008).
While the presence of cerebral edema has been demonstrated in all forms of liver diseases via this method and is thought to be closely related to the development of hepatic encephalopathy, the type of cerebral edema is different in different forms of liver failure. The nature of cerebral edema in ALF is predominantly cytotoxic which is known to reverse on follow up as and when the patient survives. It is shown as low mean diffusivity (MD) in various grey and white matter regions matter regions using diffusion and diffusion tensor imaging (Ranjan, 2005). It is interesting to note though the patients with ALF show clinical recovery on follow up at 6 weeks, the MD shows partial recovery suggesting that the biological changes reversibility lags behind the clinical recovery (Saxena, 2007).
Cerebral edema secondary to chronic liver disease has been demonstrated using diffusion and diffusion tensor imaging (Lodi, 2005; Kale, 2006; Miese, 2006; Kumar, 2008; Sugimoto, 2008). Kale et al. have shown increasing value of MD suggestive of interstitial edema in different regions of the brain in HE of different grade and found correlation of MD values with different NP tests. In addition, they also showed reversibility of cerebral edema along with improvement of NP scores following lactulose therapy confirming the presence of cerebral edema in MHE and its reversibility following therapy on DTI. Sugimoto et al. have suggested that DWI may be used to follow up the changes from overt to minimal HE in patients on serial studies and be of value in predicting the progression or regression of the disease process.
In a recent article Nath et al. (Nath, 2008) compared the type of cerebral edema in grade 3–4 ACLF with CLF and found interstitial edema reflected by the increase in spherical anisotropy (CS) and MD in patients with CLF while cytotoxic and interstitial edema in ACLF reflected by the no significant change in MD with increase in CS. They suggested that the development of an acute insult on the pre-existing CLF resulted in superimposition of cytotoxic edema over and above the preexisting interstitial edema.
Other MR Techniques and HE
There are other MR techniques that have been implemented in other applications and may have a role in HE in substantiating the cerebral edema story as well as looking into alterations in the BBB. These include magnetization transfer imaging (MTR), functional MRI (fMRI), volumetric MRI, and quantitative T1 and water content mapping. Of these MTR has been used to corroborate the manganese deposition effect mentioned above (Iwasa, 1999; Forton, 2004). fMRI has been used along with critical flicker frequency test to assess the ‘blood oxygenation level dependent’ (BOLD) signal in HE and has been found to show a decrease in activation in the right inferior parietal cortex compared to age-matched healthy controls (Kircheis, 2002). Voxel based morphometric analysis of patients with cirrhosis has also recently shown some atrophy in both grey and white matter structures, hence, supporting the cerebral edema hypothesis (Testa, 2005).
2D Localized Single Voxel Proton Magnetic Resonance Spectroscopy and HE
The addition of another spectral dimension to observe the evolution of metabolites in time, while quite common in biochemistry has had limited applications in medicine in vivo. In one dimensional (1D) MRS, the signal is recorded as a function of a single time variable and Fourier transformation of it provides a spectrum containing many chemical peaks or resonances at different frequencies. A single peak in 1D MRS may also contain contributions from resonances originating from several different compounds. Hence, quantitation of overlapping metabolite resonances using 1D MRS is impossible. In two-dimensional (2D) MRS, the signals after excitation by a 90° rf pulse evolve first during the evolution period (t1) necessary for encoding the second spectral dimension. The evolution period contains a variable delay t1 that is incremented N1 times from the initial to a final value with equal steps of Δt1. During t1, the spin system evolves freely under the influence of various interactions such as chemical shift and indirect spin-spin coupling. During the detection period (t2), all the detectable frequencies are measured. Our group has implemented localized 2D correlated spectroscopic sequence (2D L-COSY) in vivo both on 1.5 and 3T and also checked the reliability of this technique in healthy controls (Thomas, 2001; Thomas, 2003; Binesh, 2002).
The inherent advantage of two-spectral-dimension techniques is that they express the time evolution of coupled peaks within a molecule. As such, these techniques are better able to disperse severe overlap of metabolites that is observed in 1D. Another advantage is that because of this dispersion, even low concentration metabolites can be resolved which are not resolvable with one-dimensional techniques. Of course, since the peaks represent an evolution in time, additional time is necessary for the implementation of this technique. However, there is current research underway on ultrafast 2D techniques.
Application of 2D L-COSY technique in chronic HE in the prefrontal cortex using a 3-inch diameter receive coil with a whole-body transmit MR coil at 1.5T, shows the same triad signature as the 1D technique with a better spectral dispersion and quantitation as shown in Figure 5 (Binesh, 2005). In addition, clear peaks of taurine (Tau), phosphoethanolamine (PE), and, in selected cases, phosphocholine (PCh) separated from choline (Cho) are seen. In the case of HE no significant changes are observed in PCh/Cr and PE/Cr ratio when compared to healthy controls. However, Tau/Cr is observed to be significantly elevated in chronic HE patients compared to healthy controls. The biochemical significance of this is unclear. Taurine is one of the most abundant free amino acids in the brain and is localized in both neuronal and glial compartments. It can have multiple functions in the brain and like mI also serve as an organic osmolyte. Autopsied brain tissue from patients who died of hepatic coma have shown significantly decreased Tau in the prefrontal cortex (Butterworth, 1996).
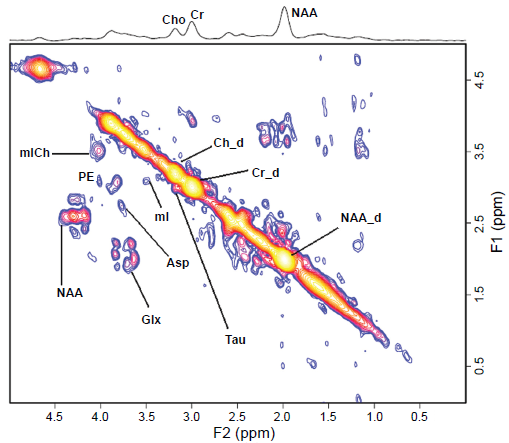
A 2D L-COSY spectrum recorded in the anterior cingulate region of a HE patient using a 1.5T MRI scanner.
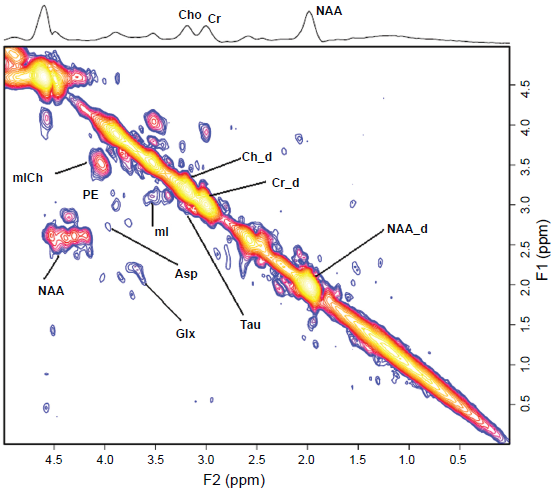
A 2D L-COSY spectrum recorded in the anterior cingulate region of a healthy subject using a 1.5T MRI scanner.
Recent implementation of the 2D L-COSY technique on a 3T scanner has offered another interesting prospect of measuring glutathione (GSH) as shown in Figure 6. GSH system is an integral antioxidative defense mechanism in astrocytes. The ability to determine the concentration of GSH would allow a measure of the integrity of the antioxidative function of the astrocytes against oxidative stress and hence, tie the hypothesis of oxidative stress as one of the possible mechanism postulated in the pathogenesis of HE (Haussinger, 2006).
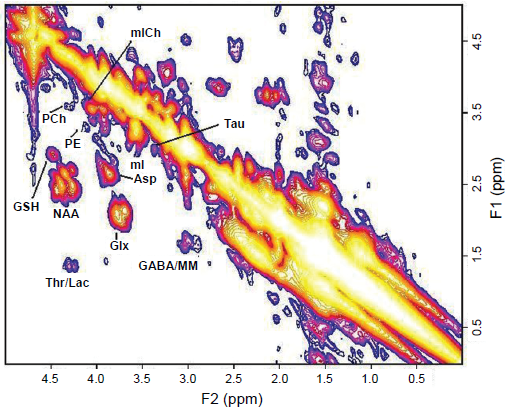
A 2D L-COSY spectrum recorded in the anterior cingulate region of a healthy subject using a 3T MRI scanner. MM represents macromolecules.
Concluding Remarks
The emerging hypothesis is that cerebral edema whether cytotoxic or interstitial, is present in varying grades in all forms of liver disease and failure. DTI and other MR modalities are crucial in identifying and quantifying its presence. Cerebral edema itself is a consequence, and the cause(s) can be astroglial swelling or morphologic changes in astrocytes, all of which, may be due to multiple, synergistically related mechanisms. At least one of these seems to relate to astrocytic volume homeostasis as evidenced by MRS parameters of Glx and mI in case of chronic HE. The piece of the puzzle that would bridge the gap on how exactly does the astrocyte changes lead to glial-neuronal dysfunction, and hence, the symptoms manifested in chronic HE, has yet to be established firmly. However, the other part establishing the presence of cerebral edema, predisposing the cirrhotic patient to volume compensation via the exchange of osmolytes, and the possibility of observation of in vivo concentration of glutathione via 2D MRS to get a measure of the efficiency of antioxidative defense mechanism, has placed MR squarely as a definitive tool in understanding the pathogenesis of HE, and perhaps, also as a potential routine diagnostic test for chronic HE.
Disclosure
The authors report no conflicts of interest.
Footnotes
Acknowledgments
This work was supported by an R01 grant from the National Institute of Mental Health (NIMH, 1R01MH065695A1). Scientific support of Drs Steve Han, Nader Binesh, Aparna Singhal, Virginia Elderkin-Thompson and MR. Neil Wilson is gratefully acknowledged.