
Abstract
Alzheimer's disease is an important social and economic issue for our societies. The development of therapeutics against this severe dementia requires assessing the effects of new drugs in animal models thanks to dedicated biomarkers. This review first overviews Alzheimer's disease and its models as well as the concept of biomarkers. It then focuses on MRI and NMR biomarkers of Alzheimer's disease in animals. Anatomical markers such as atrophy and angiography are useful to phenotype newly developed models of Alzheimer's disease, even if the alterations in these animals are not as severe as in humans. Amyloid plaques imaging is a promising marker of the pathology in animals, and is a rapidly evolving field of MRI. Functional methods such as perfusion and diffusion imaging or spectroscopy are able to detect alterations in transgenic mice mimicking Alzheimer and also to show similar alterations than in humans. They can thus be good translational markers of the disease. Manganese-Enhanced MRI shows a reduction of neuronal transportation in transgenic models of Alzheimer and it allows monitoring improvements induced by treatments of the disease. It is thus a promising biomarker of the pathology in animals.
Introduction
Alzheimer's disease (AD) is a severe dementia that leads to the withdraw of the patients from social life. The incidence rate of the disease increases with aging and according to a study published in Lancet (Ferri et al. 2005), it represents 50% to 75% of the 24.3 millions demented persons in the world. There are 4.6 millions of new cases in the world per year and a doubling of the number of affected people every 20 years. This emphasizes the public health issue that it represents.
AD is characterized by two main microscopic lesions that must be evidenced to provide the full diagnosis of the disease: neurofibrillary tangles (NFT) and senile plaques. NFT are constituted of intraneuronal accumulation of abnormally phosphorylated tau proteins. Senile plaques are mainly constituted of aggregated extracellular deposition of amyloid beta (Aβ) peptides. These latter come from the abnormal metabolism of a protein of the cellular membrane called APP (amyloid precursor protein). Amyloid proteins accumulate also in the perivascular space of the blood vessels leading to cerebral amyloid angiopathy (CAA) in almost 80% of the patients (Vinters et al. 1996). Recently, several studies also suggested a critical role of intracellular amyloid deposits in the physiopathogeny of AD (Gouras et al. 2000). Finally, amyloid can also be present in the form of highly toxic soluble oligomers (Lacor et al. 2004). All these primary lesions lead to secondary lesions such as neuronal dysfunctioning followed-up by dendritic and neuronal losses. At the macroscopic level, a cerebral atrophy appears progressively during the evolution of the disease (Valk et al. 2002). One of the most used hypothesis to explain the disease is the amyloid cascade hypothesis. It suggests that amyloid is at the origin of most of the lesions associated to AD (Hardy and Selkoe, 2002).
From a clinical point of view, the diagnosis of Alzheimer is mainly based on a neuropsychological evaluation of the patients with standardized cognitive tests such as the Mini Mental State Examination (MMS) (Folstein et al. 1975). Complementary exams such as those performed by imaging can help to eliminate treatable causes of cognitive alterations (such as secondary effects of medicines, metabolic or endocrinal disorders, cerebral haematomas, or depression). Complementary exams are now used to perform a positive diagnosis of the disease. Four approaches are close to be usable in clinical routine (Table 1). The first one relies on MRI to evaluate the atrophy of the hippocampus and temporal regions (Valk et al. 2002). The second one is based on the detection of amyloid plaques by positron emission tomography (PET) thanks to dedicated contrast agents such as the PIB (Klunk et al. 2004; Nordberg, 2007). The third approach relies on detection by PET of radioactive fluoro-deoxyglucose labeled with 18-fluor (FDG). FDG is a glucose analog, taken up by cells that use glucose. As a result, the distribution of FDG reflects glucose uptake. Its quantification in the brain by PET thus allows evaluating cerebral metabolism. During AD, cerebral glucose metabolism is reduced in temporal, prefrontal and parietal regions. These modifications have a good predictive value for the cognitive decline (Ashford et al. 2000), even in early stages of AD (Jelic and Nordberg, 2000). The last approach quantifies chemical modifications such as a reduction of Aβ42 level and an increase of phosphorylated tau and total tau proteins within the cerebrospinal fluid (CSF) of Alzheimer patients (Andreasen and Blennow, 2005).
Biomarkers of AD pathology in animals and humans with a particular focus on MR markers. The table outlines the main biomarkers evoked in the current review. The last column shows that behavioral and cognitive improvement of the AD patients is the primary clinical endpoint expected in pharmacological trials. The four columns before this last column present the biomarkers used in humans. Type 0 biomarkers are divided into markers that diagnose the disease and into those that can also probe disease evolution. In animals, the second column outlines the markers that are used in preclinical evaluation of new drugs while the first one displays the biomarkers studied in animals.

To date there is no curative treatment against Alzheimer's disease. The only treatments that are available modify the symptoms but do not modify the course of the pathology. Many disease modifying treatments are in investigation (Blennow et al. 2006). The development of these treatments relies on the use of animals (Duyckaerts et al. 2008). The most widely used ones are mouse models of amyloidosis. They are based on the overexpression of mutated forms of APP and eventually of mutated presenilin (PS1 or PS2) genes. Different mouse strains differ on the basis of the APP or presenilin mutations and of the used promotors (Delatour et al. 2006). Many different lines have been generated and one can only cite the most used ones (an updated list of the models is available on the web site of the Alzheimer Research Forum–-http://www.alzforum.org/res/com/tra/default.asp). The first generated model is the PDAPP mice. They were generated by overexpressing an APP minigene bearing the human Indiana V717F mutation (driven by the PDGF promoter) (Games et al. 1995). They start to develop parenchymal amyloid deposition at 8 months (Higgins and Jacobsen, 2003). Another widely used model are the Tg2576 mice (APP695(K670N, M671L) under the control of the hamster prion protein gene promoter). They start to develop amyloid deposits at 9 to 12 months (Hsiao et al. 1996). The APP23 (APP751(K670N, M671L) controlled by Thy-1 promoter) are another model. They start to develop amyloid deposits at 6 months of age (Sturchler-Pierrat et al. 1997). All these mice also develop amyloid angiopathy, the intensity of which can differ. The PS1/PS2 mutations (APP/PS models) amplify the amyloid pathology. For example, the APPSL/PS1M146L model presents three (Swedish (K670M/N671L) and London (V717I)) mutations on the APP751 and also has an overexpression of mutated (M146L) PS1. This leads to an onset of amyloid deposition at 2 to 3 months of age (Blanchard et al. 2003). All these mice develop behavioral alterations at some point. However comparing the alterations of the various mice is a difficult issue (Dodart et al. 2002). None of these mice develop NFT, the second characteristic lesion of AD. Mice overexpressing mutated tau proteins have thus been engineered (Lee et al. 2005). They develop tau pathology leading to NFT and to a neuronal loss in various brain regions.
Spontaneous models of AD have also been used (Dhenain, 2001). In particular, aged Primates have been widely studied before the development of transgenic mice. Some of them develop alterations such as cerebral amyloid deposits (Bons et al. 1991; Gearing et al. 1994), tau pathology (Gilissen et al. 2000; Schultz et al. 2000), behavioral and cognitive impairments (Bartus and Dean, 1985; Picq, 2007), and an age-related cerebral atrophy (Andersen et al. 1999; Dhenain et al. 2003).
Evaluating new treatments in animals requires to follow-up the pathology in a longitudinal, non-invasive, way thanks to dedicated biomarkers. Biomarkers were defined by a NIH working group in 2001 (Biomarkers Definitions Working Group Bethesda, 2001) as a characteristic that is objectively measured as an indicator of normal biological processes, pathogenic processes, or pharmacologic responses to a therapeutic intervention. Three types of biomarkers have been defined. Type 0 biomarkers are markers of the natural history of a disease and they correlate longitudinally with known clinical indices, such as symptoms. Type I biomarkers are “mechanistic” biomarkers. They capture the effects of an intervention in accordance with the mechanism of action of a drug, even though the mechanism might not be known to be associated with clinical outcome. Finally, type II biomarkers or surrogate endpoints can predict the clinical benefit (or toxicity) of a treatment. They are intended to substitute for a clinical endpoint. They are thus expected to predict clinical benefit (or harm or lack of benefit or harm) based on epidemiologic, therapeutic, pathophysiologic, or other scientific evidence. When dealing with biomarkers, one should however keep in mind that the relationship between biomarkers of a pathology and effects of a treatment can be rather complex (Frank and Hargreaves, 2003) and that, at least in humans, the true benefits of clinical trials for patients are evaluated through clinical endpoints (variables that reflect how a patient feels, functions, or survives).
In mouse models of AD, biomarkers of treatment efficiency based on behavioral studies are widely used (Morgan et al. 2000; Dodart et al. 2002). Their evaluation is time consuming and can reflect secondary events that are not directly linked to the primary lesions of the disease such as for example axonal degeneration within the spinal cord (Wirths et al. 2007) or ocular alterations (Melov et al. 2005). Imaging method can be more closely related to the primary lesions of the disease. They can thus be very useful to follow-up the effects of new treatments against AD. In the current review, we focused on the use of MR methods to study animal models of amyloid lesions. An overview of the different methods presented in this review is shown in Table 1. The holy grail of MRI would be to find type II biomarkers that reflect the efficiency of therapeutic interventions in animals, which would be able to predict the efficiency of such intervention in humans, and could also be used in humans to follow the efficiency of the treatments.
Anatomical Markers
Cerebral Atrophy
At the macroscopic level, brains from AD patients are characterized by a severe atrophy leading to dilation of the ventricular system and a widening of cortical sulci (Valk et al. 2002). In the early stages of the disease, the atrophy process affects mainly medial temporal areas including the hippocampal formation. The atrophy can be used as a marker of disease progression in clinical trials (Albert et al. 2005).
Cerebral atrophy has been largely studied in the PDAPP transgenic mouse model of AD (Dodart et al. 2000; Gonzalez-Lima et al. 2001; Weiss et al. 2002; Redwine et al. 2003). These mice present with a reduction in hippocampal volume and a severe atrophy or agenesis of white matter fiber tracts (fornix and corpus callosum). These alterations are already observed in 3 month old animals and show no further deterioration in older mice (Dodart et al. 2000; Gonzalez-Lima et al. 2001; Weiss et al. 2002; Redwine et al. 2003). Because of their early occurrence, these lesions might thus be viewed as a neurodevelopmental deficit rather than an age-related brain shrinkage induced by progressive deposits of Aβ. More recently, atrophy of the cerebrum but not of the hippocampus has been reported in the APPT714I mouse model of AD. These mice mimic a mutation that leads to a very early form of AD in humans (Kumar-Singh et al. 2000). They are characterized by intracellular accumulation of Aβ but do not present with extracellular Aβ deposits. Unfortunately, the structures of the cerebrum that are atrophied were not reported in these mice. APPSL/PS1M146L mice are another aggressive model of AD (Delatour et al. 2006). No atrophy was detected in young APPSL/PS1M146L animals, as showed by their normal brain, hippocampus or CSF volumes. APPSL/PS1M146L and control animals both show continuous growth of the hippocampus during adulthood and hippocampal volumes are not affected by APP overexpression, regardless of age. However, an age-related atrophy process occurs in APPSL/PS1M146L mice as indicated by lower brain volumes and increased CSF volumes compared with control mice. More precisely, the locus of the atrophy is, at least in part, related to the midbrain region, the internal capsule, and some fiber tracts such as the corpus callosum and fornix. Thus the atrophy process involves mainly amyloid-free brain regions. Also, cortical brain areas with high amyloid burden are not atrophied and the severity of the atrophy is not correlated with the amyloid load (Delatour et al. 2006). This atrophy pattern, that involves white matter anomalies and largely spares the isocortex and hippocampus, is different from that reported in AD patients. All these data indicate that overexpression of mutated APP in mice is not invariably accompanied by AD-like brain atrophy.
Cerebral atrophy has also been evaluated in spontaneous models of AD and in particular in aged non human primates. Post-mortem analyses revealed an age-related reduction of the brain weight in macaques (Ordy, 1975) or a ventricular enlargement (Wisniewski et al. 1973). These results have been confirmed, in-vivo, by using MRI approaches (Andersen et al. 1999). In particular, MR studies in a large cohort of mouse lemur primates revealed an age-related atrophy process (Fig. 1) that starts at different ages and evolves rapidly once initiated (Dhenain et al. 2000; Dhenain et al. 2003). Several atrophied animals also present with extracellular amyloid depositions, but the amount of deposits is low as compared to what occurs in human patients with AD. Extracellular amyloid per se thus does not seem to be the only explanation to render for cerebral atrophy in these animals (Dhenain et al. 2003).
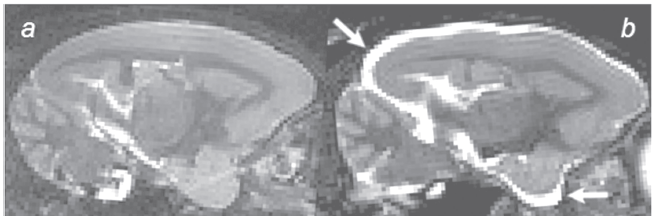
Increased CSF volume (arrows) reflecting cerebral atrophy in the brain of an aged mouse lemur Primate (b) as compared to a non-atrophied animal (a) (3D inversion-recovery fast spin-echo images (IR-RARE), TR/TEw = 2500/45 ms, resolution = (234 µm) 3 , RARE-factor = 16).
“Macroscopic” Vascular Alterations
In most of the Alzheimer patients, amyloid proteins accumulate in the periphery of blood vessels leading to CAA (Vinters et al. 1996) and many AD patients display stigmata that suggest vascular alterations (de la Torre, 2004). For example, they present with blood flow impairments (Bressi et al. 1992; Franceschi et al. 1995) and angiogram alterations (Ishibashi et al. 1998). In many cases, vascular alterations can lead to cortical hemorrhages, infarctions, and severe lobar cerebral hemorrhages (Yamada, 2000).
Amyloid angiopathy is also described in transgenic mouse models of AD. For example, in single transgenics such as the APP23 model, substantial vascular amyloid accumulation starts around 12 months (Sturchler-Pierrat et al. 1997; Calhoun et al. 1999; Winkler et al. 2001). In other single transgenics CAA appearance is more variable (21 months for PDAPP (Racke et al. 2005), 10 months for Tg2576 (Christie et al. 2001; Domnitz et al. 2005)). Post-mortem evaluations of morphological vascular alterations have been mainly evaluated in the APP23 models by using corrosion casts. The method is based on the injection of resin in the vascular system followed-up by the observation of the vessels by electron microscopy. It highlighted vessel constrictions, small deposits attached to the vessels, vessels truncation in the periphery of amyloid plaques, and morphological alterations reminding neo-angiogenesis (Beckmann et al. 2003; Meyer et al. 2008).
Vascular alterations can also be evaluated by MRI in transgenic mouse models of AD either by using time of flight magnetic resonance angiography (Beckmann et al. 2003), a method sensitive to vascular flow, or by using dedicated contrast agents (El Tannir El Tayara et al. 2006). To the best of our knowledge, most of the published results concern the APP23 models. In these mice, time of flight magnetic resonance angiography allowed to detect flow voids starting in the internal carotid arteries in 11 month old APP23 mice and then involving the large arteries of the circle of Willis in 20 month old animals (Beckmann et al. 2003). Vessel constrictions detected ex-vivo on corrosion casts from vessel architecture of the same mice could partly account for these alterations. The relationship between alterations on angiograms and amyloid angiopathy remains however unclear.
Detection of Amyloid Plaques by Microscopic and Parametric MRI
Current Methods to Detect Amyloid Load
Senile plaques are very small structures. In humans, some big plaques measure 150 µm, however, most of them measure less that 25 µm (Hyman et al. 1993).
Recent developments of PET radiopharmaceuticals that bind to Aβ have allowed the detection of amyloid deposits in the brain of AD patients (Shoghi-Jadid et al. 2002; Klunk et al. 2004; Nordberg, 2004). PET however is not well suited to follow-up amyloid pathology in mice because of its low resolution and data regarding the application of PET to detect amyloid plaques in mouse models are still controversial (Toyama et al. 2005; Maeda et al. 2007).
Several other methods have been used to detect amyloid load in mice. Multiphoton microscopy is able to detect amyloid deposition (labeled with specific fluorophores such as Thioflavine S (Christie et al. 2001) or Thioflavine T derivative (Bacskai et al. 2003)) by scanning through a small skull window. The spatial resolution reached is on the order of one micron and plaques located up to 150 µm underneath the cortical surface can be revealed (Christie et al. 2001). This method has allowed in-vivo visualization of the turn over of plaques (Christie et al. 2001) and associated lesions (Tsai et al. 2004) and to evaluate the effects of treatments against AD (Bacskai et al. 2001; Brendza et al. 2005). Near-infrared (NIR) imaging is another in-vivo imaging technique that allows quantifying the cerebral amyloidosis in transgenic mice (Hintersteiner et al. 2005; Skoch et al. 2005; Raymond et al. 2008). This optical method is based on the use of fluorescent dyes designed to absorb and emit light in the near-infrared where tissue scattering and absorption is lowest. The technique thus reduces the background and scattering through biological tissue usually encountered with fluorescent imaging in live animals. Recent development of specific dyes that absorb and fluoresce within the NIR (650–900 nm) allowed assessment of the amyloid load in APP23 mice (Hintersteiner et al. 2005). Another method is based on the accumulation of amyloid peptides in the lenses of AD patients (Goldstein et al. 2003) and transgenic (Tg2576) models of AD (Melov et al. 2005). It has been suggested that in-vivo observation of the lens by quantitative laser technologies can determine the presence of amyloid load. More precisely, a technology called infrared quasi-elastic light scattering (QLS) technology has been developed to detect amyloid in the lens. It is based on the administration of pulses of low-power infrared laser light into designated zones of the eye followed-up by a measure of the backscattered light. This allows to obtain an index of the amyloid pathology in transgenic animals (Moncaster et al. 2008). The technology can be associated to the use of fluorescent ligands that improve its ability to detect the amyloid load (Moncaster et al. 2008).
MRI has also been widely used to either directly detect the amyloid plaques or to quantify some parameters that reflect the amyloid load.
Direct Detection of the Amyloid Plaques
The size of senile plaques is at the limit of the resolution of MRI and thus detection of amyloid plaques requires sequence optimization to reach a sufficient resolution in a reasonable amount of time. Also, until recently, little was known about the best contrast mechanism to use to detect the plaques. Practically, setting-up protocols to visualize plaques thus had to iterate between optimization of resolution and contrast (Fig. 2).
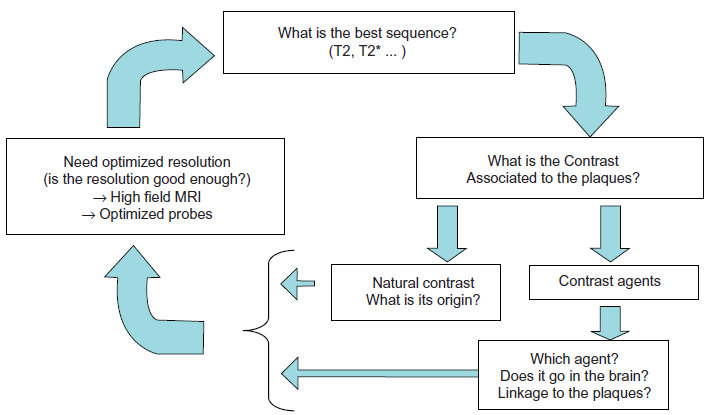
Iterative processes in the design of experimental protocols to detect amyloid plaques by MRI in mice. First (right side frame), one needs to know what is the contrast associated to the plaques. One can rely either on the natural contrast of the plaques. Iron has been proposed as an important source of contrast although amyloid could also provide contrast in the absence of iron. If the natural contrast is not good enough to detect plaques, one can use dedicated contrast agents. In that case, the choice of the contrast agent is critical. The contrast agent must be able to penetrate the blood brain barrier and to target the plaques. Because of the small size of the plaques, MR images must be recorded with a high resolution (left side box). Most strategies rely on high field MRI and optimized probes, however, some other techniques based, for example, on the use of cryoprobes might be tested in the future. The ability of the high resolution images to detect the plaques can only be validated if the contrast of the plaque is good enough (see right frame). The last part of the iterative process is related to the sequences to use. The evaluation of the sequence can only be performed if contrast and signal are sufficient to allow plaque detection. Because of the presence of iron within the plaques, T2*w sequences have first been proposed to detect the plaques. T2w sequences seem however better for plaque detection (Jack et al. 2005).
Detection of Amyloid Plaques without Contrast Agents
The first studies that tried to detect the plaques were based on ex-vivo human samples. They suggested that T1, T2 or diffusion-weighted sequences can not detect the plaques (Benveniste et al. 1999). Following reports, based on T2*-weighted (T2*w) sequences, provided contradictory results (Benveniste et al. 1999; Dhenain et al. 2002).
After these first works, several ex-vivo and in-vivo MRI protocols have shown that two categories of amyloid plaques can be detected in animals. The first ones are the thalamic plaques. They are detected as large dark spots on T2-weighted (T2w) or T2*w images (Fig. 3) (Jack et al. 2004; Vanhoutte et al. 2005; Dhenain et al. 2008; Faber et al. 2007). The spots are caused by a strong accumulation of iron and calcium within the plaques (Dhenain et al. 2008). This phenomenon is related to an age-related pathological process leading to iron accumulation in the brain parenchyma followed up by the capture of iron by amyloid plaques. Interestingly, the process occurs mainly in aged transgenics, but not in all. Moreover, it also occurs in non-transgenic, amyloid free, animals, although in that case, the iron stays in the cerebral parenchyma (Dhenain et al. 2008). The amount of plaques that can be detected, in-vivo, thanks to this method is not correlated to the amyloid assessed by histology. This suggests that the detection of the thalamic plaques in mice is of little use to follow-up the amyloid pathology in animals involved in pharmacological trials.
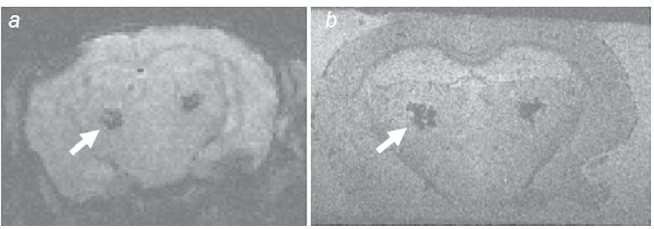
Hypointense thalamic spots (arrows) on in-vivo (a) and post-mortem (b) T2*w MRI of APPSL/PS1M146L mice. The thalamic spots correspond to amyloid plaques filled in by iron and calcium deposits. (a) In-vivo T2*w gradient echo (GE) sequence: 4.7 Tesla, TR/TE = 47.4/20 ms, alpha = 15°, resolution = 234 x 117 x 117 µm3, imaging time = 51 min. (b) Postmortem GE sequence: TR/TE = 100/20 ms, alpha = 15°, resolution = 63 x 47 x 59 µm3, imaging time = 7 h.
The second categories of amyloid deposits that can be detected by MRI are the cortical or hippocampal plaques (Jack et al. 2004; Jack et al. 2005). They are detected as dark spots on T2 or T2*w images. The first MRI studies that managed to detect these plaques were based on ex-vivo analysis of mouse brains (Lee et al. 2004). Post-mortem protocols allowed long imaging time to increase the resolution and the signal to noise ratio of the images. More recently cortical and hippocampal plaques were shown in in-vivo images. A first study based on T2w sequences at 9.4 Tesla detected amyloid plaques of 35 µm in diameter in 9 month old animals (Jack et al. 2005). In the used mouse model, plaques start to be detected at 3 months by histology. Interestingly, this method allowed to detect/monitor the effect of immunotherapy that reduced the amyloid load in the brain of mice (Jack et al. 2007). Another study, at the same field also managed to detect plaques in 12 month old Tg2576 animals: a mouse strain in which amyloid deposition starts at 9 months. Not all the plaques were detected during those studies and the detected plaques were mainly the iron-rich ones (Braakman et al. 2006). Interestingly, despite the accumulation of iron within the plaques, several studies suggested that 2D (Braakman et al. 2006) or 3D (Jack et al. 2005) T2w sequences are better than T2*w sequences to detect cortical and hippocampal plaques (Jack et al. 2007). The reason for this remains unclear. One argument is that T2*w experiments lead to susceptibility effects that are not compatible with the ability to detect plaques, but this is not really consistent with data showing increased detection of thalamic plaques. Possible explanations can be related to different nature of iron in cortical/hippocampal and thalamic plaques or to diffusion effects in the plaque vicinities.
Recently, various studies evaluated new sequences to detect cortical/hippocampal amyloid plaques by MRI. In a systematic study of different MR protocols performed in post-mortem samples, Chamberlain et al. showed that the visibility of the plaques increases with the following sequences: T2w fast spin echo, T2w single spin echo, T2*w gradient echo, T2w multiple spin echo, T2w multiple asymmetric spin echo, T2*w gradient echo with susceptibility weighted images (SWI), T2*w multiple gradient echo, T2w multiple asymmetric spin echo and SWI, T2*w multiple gradient echo and SWI MRI (Chamberlain et al. 2008). Interestingly, this study introduced the concept that SWI can be a good solution to detect plaques by MRI. This can be explained by a phase shift in the plaque voxel that is caused by the iron associated to the plaques (Haacke et al. 2007).
Other sequences such as T1rho (T1ρ) sequences are also able to detect plaques in alive animal even at low (4.7 Tesla) field (Borthakur et al. 2006). The T1ρ is the spin lattice relaxation time constant in the rotating frame. It determines the decay of the transverse magnetization in the presence of a spin-lock radiofrequency field. It is dependent on the macromolecular composition of the tissue which might explain its ability to detect the amyloid plaques. Finally, strategies exploiting local dipole fields are also able to detect the iron-positive plaques with a positive contrast (CRAZED sequences) (Faber et al. 2007). This strategy is particularly efficient at very high field (17.6 Tesla). It was however only showed to detect thalamic plaques and not cortical/hippocampal amyloid deposits.
Detection of Amyloid Plaques with Contrast Agents
Detection of amyloid without contrast agents is relatively easily performed in old animals because of iron accumulation within the plaques. In young animals, this is much more difficult because amyloid plaques do not present with iron. These difficulties can be partly overcome by using dedicated contrast agents (Dhenain et al. 2006). Our group developed a “passive staining” method based on the post-mortem penetration of Gadolinium within the brain (Fig. 4). We showed that even non targeted contrast agents can help to detect amyloid plaques by MRI. However, to date, most of the agents that were used to detect the plaques are made-up of targeting molecules associated to a contrastophore. The choice of the contrastophore is critical. Gadolinium or iron particles such as monocrystalline iron oxide nanoparticles (MION) have been used (Poduslo et al. 2002; Zaim Wadghiri et al. 2003). More recent studies suggest that Dysprosium can be a better solution to increase the contrast (Wadghiri et al. 2008). Some other contrastophores such as fluor have also been proposed (Higuchi et al. 2005). Several targeting agents have been developed. The first ones were based on amyloid substrates (Aβ1–40 or Aβ1–30) (Zaim Wadghiri et al. 2003; Sigurdsson et al. 2008). The rationale is that once injected in the brain, exogenous amyloid tends to aggregate with the amyloid of the plaques. Agents based on natural dyes of amyloid, such as derivatives of congo red (Higuchi et al. 2005) or antibody fragment of a monoclonal antibodies rose against amyloid proteins have also been proposed as targeting agents (Poduslo et al. 2007; Ramakrishnan et al. 2008).

Detection of amyloid plaques after “passive staining” in 53 week old (a) and 16 week old (b) APP/PS1 KI mice (Wirths et al. 2008) as compared to a control mouse of 42 week old (c) (GE sequence, TR/TE = 100/15 msec, alpha = 90°, resolution = 62 x 47 x 59 µm3). Some cortical plaques are shown with an arrowhead while hippocampal plaques are labeled with an arrow. The number of plaques increased in the old APP/PS1KI animal as compared to the young one. Note the presence of hypointense spots (asterix) that could be confounded with plaques in the hippocampus of control animal (c). (d) Amyloid plaques in a 39 week old animal from another transgenic mouse model of AD (APPSL/PS1M146L)(GE sequence, TR/TE = 100/10 msec, alpha = 90°, resolution = 62 x 47 x 59 µm3). (e–f) Three dimensional projections (inverted-contrast) from the senile plaques of a passively stained hippocampus (APPSL/PS1M146L mouse). The surface rendering of the hippocampus that was used to perform the 3D projection is displayed in e (blue). Amyloid deposits are represented as white spots in the 3D projection of the hippocampus (f).
The major limitation to the use, in-vivo, of contrast agents to detect amyloid plaques is the presence of the blood brain barrier (BBB) that hinders the delivery of macromolecules into the brain. Several protocols have been developed to facilitate the temporary BBB opening. The first one relies on administration of hyperosmotic solutions such as mannitol. This allows to detect amyloid plaques on in-vivo MRI (Zaim Wadghiri et al. 2003). The drawback of the method is its invasiveness and the high death risk related to the procedure. Some other approaches used polyamines such as putrescine to open the BBB (Poduslo et al. 2002). Promising results were obtained by linking such agents to an antibody fragment of a monoclonal antibody raised against the amyloid protein (Ramakrishnan et al. 2008).
Quantification of the Amyloid Plaques
An important issue to use MRI-detection of amyloid plaque for pharmaceutical assays is to be able to count the plaques. Up to now, few methods have been proposed. The first one was based on the manual counting of amyloid plaques in circular regions of interest (ROIs) placed over the cortex. Although time consuming, this method could prove the efficiency of treatments against amyloidosis (Jack et al. 2007). More recently, voxel-based analysis (VBA) was used to perform un-biased quantitative comparison of MR images performed before and after injection of ligands that targeted amyloid (Sigurdsson et al. 2008).
Indirect Detection of the Amyloid Load
During pharmaceutical trials one want to quantify the amyloid load and not necessarily to visualize individual plaques. Our group has shown that a T2 decrease occurs in the subiculum of APPSL/PS1M146L mice as compared to age-matched control animals (El Tannir El Tayara et al. 2006). In addition, the T2 decrease was correlated to the amyloid load. A T2 decrease was also found in the hippocampus, cingulate, and retrosplenial cortex of APPK670N, M671L/PS1M146V transgenic mice (a model obtained by crossing Tg2576 mice with PS1M146V animals) as compared to non transgenic animals (Helpern et al. 2004; Falangola et al. 2005; Falangola et al. 2007) or in Tg2576 mice as compared to nontransgenic littermates (Braakman et al. 2006). These data suggest that relaxation times can be good markers of the amyloid load in transgenic mouse models of AD. In many studies, the T2 decrease could be attributed to the accumulation of iron within the plaques (Falangola et al. 2005; Braakman et al. 2006; El Tannir El Tayara et al. 2006). However, in young mice, we showed a correlation between T2 and the amyloid load even if iron could not be detected by histology in the plaques (El Tayara Nel et al. 2007). This indicates that mechanisms other than those associated to focal iron deposition within the plaques may be responsible for the reduced T2 relaxation in tissue containing amyloid deposits. Potential mechanisms with which amyloid load can lead to a T2 decrease can be related to the hydrophobic nature of amyloid deposits. T2 decrease might also be linked to impaired cell physiology, possibly associated to intraneuronal accumulation of amyloid β proteins (El Tayara Nel et al. 2007). Other pathological processes such as, for example hypoperfusion associated to amyloid deposition (Grohn et al. 2000; Niwa et al. 2002) can also explain the T2 decrease found in AD mice.
T1, T2 and T2* relaxations times are not the only contrast mechanisms in MR images. T1ρ, or T1rho, another relaxation time, is the spin lattice relaxation time constant in the rotating frame. It determines the decay of the transverse magnetization in the presence of a spin-lock radiofrequency field. In biological tissues T1ρ is dependent on the macromolecular composition and provides a contrast that is different than the conventional T1/T2-based contrasts. Its quantification has shown difference between Alzheimer (APPK670N, M671L/PS1P246L) and control animals (Borthakur et al. 2006). To our knowledge, no correlation with amyloid load has been reported. This method however might be interesting to assess the changes related to amyloid deposition within the brains.
Functional Preclinical Markers
In humans, the term of functional imaging is often limited to the evaluation of brain activation after cognitive or somatosensorial activity by using blood oxygen level-dependent (BOLD) or derived methods. Functional imaging can also be regarded in a wider sense as perfusion imaging (Detre et al. 1992), diffusion imaging (Le Bihan et al. 1986), or evaluation of metabolic profiles by spectroscopy (Jones and Waldman, 2004).
Markers of Brain Metabolism and/or Perfusion
In humans, one of the earliest alterations detected in the course of AD is a reduction of glucose metabolism as measured by FDG-PET (Ashford et al. 2000; Jelic and Nordberg, 2000). Impaired cerebral perfusion has also been reported (Alsop et al. 2000; Johnson et al. 2005). Such alterations, if detected in animals might be non-invasive markers of disease progression.
Early studies, based on autoradiography or laser Doppler methods, have shown alterations of the vascular function in models of AD based on intracerebral injection of amyloid or transgenesis (Tg2576 model for example) (Niwa et al. 2001; Niwa et al. 2002). Evaluations by MRI have also outlined several vascular/metabolic alterations in transgenic models. Indeed, MRI highlighted an altered hemodynamic response after somatosensorial stimulation (electrical stimulation of the paw) in 25 month old APP23 animals but not in 13 month old animals (Mueggler et al. 2003). Reduced hemodynamic responses have also been reported in transgenic mice (APP23, Tg2576) after pharmacological stimulation with vasodilatators (Christie et al. 2001; Mueggler et al. 2002; Niwa et al. 2002). Two hypotheses can explain these altered responses. First, a direct link between functional alterations and amyloid angiopathy: Aβ deposits in blood vessels might act by mechanistic constriction (Christie et al. 2001; Beckmann et al. 2003; Mueggler et al. 2003) or, alternatively, by disorganizing the arrangement of smooth muscle cells (Christie et al. 2001). A second hypothesis based on the toxicity of Aβ peptides, particularly when they are in soluble forms, has been suggested to explain the occurrence of altered vascular response in regions free of amyloid angiopathy (Iadecola et al. 1999; Niwa et al. 2002; Beckmann et al. 2003).
Markers of Axonal Transportation
Recently, Pautler et al. have developed a method to evaluate in-vivo axonal transportation (Smith et al. 2007). The method is based on Manganese-Enhanced Magnetic Resonance Imaging (MEMRI). MEMRI relies on manganese administration either directly into the brain or in a systemic way. Manganese is an analog of calcium that has paramagnetic properties. During neuronal physiological activation, extracellular manganese enters neurons through voltage-gated Ca2+ channels (Koretsky and Silva, 2004). In addition, intracellular manganese is transported along axons and across synapses thus allowing for tract tracing as shown in the olfactory system (Pautler et al. 1998). The transport of manganese occurs along micro-tubules via fast axonal transport. Thus MEMRI has been proposed as a way to dynamically measure the rates of manganese transportation, which is reflective of fast axonal transport rates. In her study, Pautler injected manganese in the olfactory system of Tg2576 mice to follow axonal transportation. The study suggested that as Aβ levels increase, and before plaque formation, a significant decrease in axonal transport rates is seen in transgenic mouse models of AD. After plaque formation, the decline in the transport rate becomes even more pronounced (Smith et al. 2007). The neuronal transportation alterations can be related to intraneuronal Aβ accumulation (Wirths et al. 2001) or to a direct effect of Aβ on actin or axonal swelling (Wirths et al. 2006). More recently, the same authors have shown that treatments that reduce the amyloid load lead to a recovery of the axonal transportation. This suggests that MEMRI can be used to detect recovery of function in reaction to a therapy against amyloid (Massaad et al. 2008; Smith and Pautler, 2008).
Markers of Cerebral Alterations Based on Diffusion MRI
Diffusion-weighted images and calculations of apparent diffusion coefficient (ADC) provide information on randomized movement of water molecules in tissues (Le Bihan et al. 2001). Hippocampal alterations of ADC have been reported in alzheimer patients (Kantarci et al. 2001). Studies in APP23 transgenic mice have shown reduced ADC values in some cortical areas from very old (25 month old) animals (Mueggler et al. 2004). However, these observations were not reproduced in all brain regions displaying amyloid load (Mueggler et al. 2004) and failed to be replicated, even in studies using the same mouse strain (Sykova et al. 2005). Diffusion anisotropy is another parameter based on diffusion measurement. It provides information on the integrity of oriented tissues such as fiber tracts. Studies in humans showed a reduction of white matter anisotropy in AD patients (Hanyu et al. 1999; Sandson et al. 1999; Rose et al. 2000). Studies in two different strains of transgenic mice (PDAPP and Tg2576) have shown a reduction in the water diffusion parallel to axonal tracts (λ||; a parameter that might be a marker for axonal injury) and/or an increase in water diffusion perpendicular to axonal tracts (λ┴; a parameter that might be a marker of myelin integrity) (Song et al. 2004; Sun et al. 2005). However, these results involved animals older than 15 months. This suggests that these alterations are late markers of amyloid pathology. These results are consistent with our data that showed fiber tract atrophies (in APPSL/PS1M146L mice) (Delatour et al. 2006) and suggest that Aβ or mutated APP overexpression is associated with white matter alterations.
Spectroscopic Markers of Brain Alterations
In AD patients, proton MR spectroscopy reveals a decrease in N-acetylaspartate (NAA) peak (Adalsteinsson et al. 2000) and an increase in the myo-inositol (mIns) peak (Moats et al. 1994; Valenzuela and Sachdev, 2001). Proton MR spectroscopy can also be used in transgenic mice modeling AD. It reveals a reduction in NAA and Glutamate (Glu) peaks starting at 12 months and reaching significative levels in 20 month old PS2APP (PS2N141I/APPK670N, M671L) mice, a mouse strain in which amyloid deposits start at 5/8 months (Richards et al. 2003). In 24 month old PS2APP animals the NAA index was shown to be significantly correlated with the amyloid load (von Kienlin et al. 2005). Alterations of NAA and Glu as well as glutathione have also been reported in aged Tg2576 transgenics. These mice also develop increased Taurine as compared to wild-type animals (Dedeoglu et al. 2004). In APP/PS1 (APPK670N, M671L/PS1M146L–-a model obtained by crossing Tg2576 mice with PS1M146L animals) mice, declines in the levels of NAA and Glu have also been reported. In addition, these mice also showed an increase in the concentration of mIns (Marjanska et al. 2005).
Conclusion
Several studies suggest that MR can play a critical role in the evaluation of mouse models of AD. First, MR can be useful to phenotype newly generated models. Indeed, MR can assess cerebral atrophy, but also vascular alterations in these mice. MR can also be useful to evaluate the amyloid load and future studies will probably allow detecting and quantifying the amyloid load in mice. Several markers that can be used in mice are translational markers as they are also used in humans to follow-up the AD pathology. This is the case of perfusion (quantified by MRI in humans) or amyloid plaques load (evaluated by PET in humans). Finally, MR can be used as a tool to follow-up the effects of new treatments against AD. This has been shown by measuring the amyloid load, but also by evaluating axonal transportation thanks to MEMRI. Finally, one should keep in mind that the current review only focused on mice mimicking amyloidosis. Models of tau pathology have also been developed (Lewis et al. 2000). In the future they will be deeply investigated by MRI.
Abbreviations
Three dimensional;
water diffusion parallel to axonal tracts;
water diffusion perpendicular to axonal tracts;
amyloid beta peptides;
isoform of the amyloid beta peptides constituted of 40 amino acids;
isoform of the amyloid beta peptides constituted of 42 amino acids;
Alzheimer's disease;
apparent diffusion coefficient;
amyloid precursor protein;
blood brain barrier;
blood oxygen level-dependent;
cerebral amyloid angiopathy;
COSY revamped with asymmetric z-GRE detection MR technique;(see (Faber et al. 2007));
cerebrospinal fluid;
fluoro-deoxy-glucose labeled with 18-fluor;
positron emission tomography using the FDG;
glutamate;
Gradient echo sequence;
manganese-enhanced magnetic resonance imaging;
myo-inositol;
monocrystalline iron oxide nanoparticles;
mini mental state examination;
magnetic resonance;
magnetic resonance imaging;
N-acetylaspartate;
neurofibrillary tangles;
national institute of health;
near-infrared imaging;
positron emission tomography;
pittsburgh compound B: fluorescent derivative of thioflavin T used in positron emission tomography scans to image beta-amyloid plaques in neuronal tissue;
presenilin 1;
presenilin 2;
quasi-elastic light scattering technology;
regions of interest;
susceptibility weighted images;
T1-weighted;
T1rho;
T2-weighted;
T2*-weighted;
echo time;
repetition time;
voxel-based analysis.
Disclosure
The author reports no conflicts of interest.
Footnotes
Acknowlegments
We thank Sanofi-Aventis Neurodegenerative Disease Group for providing the animals presented in the figures of this review. Our work was supported by the Fédération pour la Recherche sur le Cerveau, 2003, the ACI Neurosciences, 2004 (French Research Department), the France-Alzheimer association, and the NIH (R01-AG020197).