
Abstract
There appear to be species differences among the effects of gene mutations related to familial Alzheimer's disease on the brain during aging. To gain a better understanding of the effects of the Swedish mutation of amyloid precursor protein and the mutant form of human presenilin 1 on mice, commercially available mice from Jackson Laboratory were studied. Three dimensional T2*-weighted imaging was used to monitor the size of brains of APP/PS1 mice monthly, from 6 to 13 months of age. No significant difference was measured in the size of the medial-lateral width, dorsal-ventral height, rostral-caudal length or the volume of the APPSwe/ PS1 mouse brain. Faster and higher-resolution imaging methods are needed to accurately determine if small volume or shape changes occur in mouse brains with age or gene mutations.
Introduction
Alzheimer's disease is the most common form of dementia, affecting an estimated 5.3 million Americans. 1 Many non-invasive imaging studies have been performed to understand the effects of aging2,3 and Alzheimer's disease4–10 on the human brain.
Hippocampal atrophy rate was shown to best discriminate mild cognitive impairment (MCI) from controls, while whole brain atrophy rate was shown to discriminate Alzheimer's from MCI in humans. 9 Increasing the rate of imaging measurements of hippocampal volume, from a yearly measurement to a 6-month measurement, increased the variance in the measurement, but did not change the annualised atrophy rate in humans. 7 One study showed a large percentage reduction in the hippocampus in 24 weeks. 5 A review and reanalysis of 9 studies from 7 centres showed a larger annualised hippocampal atrophy rate in Alzheimer's patients compared to controls. 8
Animal models are being used to further the understanding of the disease. The cause of Alzheimer's disease is unknown, but is likely to include a variety of factors. A small percentage of cases involve gene mutations including the genes for amyloid precursor protein (APP) and presenilin protein (PS1). 1 Transgenic mouse models have been developed with these gene mutations and are being imaged to help in the understanding of the disease.10–25
Brain size changes occur in humans in relation to aging and Alzheimer's disease.4–9 Some have looked at changes in transgenic mouse brain size using MRI. 24 Unlike human brains, the mature brains of wild-type mice enlarge from 6 to 14 months of age. 24 In the same study, the transgenic mice expressing human APP695(K595N, M596L) × PS1(M146V) showed a larger increase in size. 24 Thus, the effects of aging as well as the effects of gene mutations appear to be species dependent.
Brain shape has been shown to change with age in normal and demented people with Alzheimer's disease and MCI.26–28 Specifically, the subiculum and the CA1 subfield of the hippocampus in Alzheimer's disease, 28 anterior hippocampal segment and the basolateral complex of the amygdale, the lateral ventricles, the anterior-lateral and ventral-lateral aspects of the thalamus in Alzheimer's and MCI 27 were all shown to have different shapes when compared to normal subjects. Using measurements taken 2 years apart, greater rates of hippocampal deformation across time were seen in early dementia and subjects that converted from non-demented to demented than in non-demented controls within every subfield of the hippocampus. 26
To gain a better understanding of the effects of the Swedish mutation of APP and the mutant form of human PS1 on mice, we studied commercially available mice from Jackson Laboratory. We used three dimensional T2*-weighted imaging to monitor the size of brains of APP/PS1 mice monthly while they developed a heavy plaque burden. This study is the first to make frequent measurements over an extended time period. Along with traditional voxel counts for brain volumes, segmentation and registration were used to gain more specific information on changes in shape of the brain.
Methods
Mouse model
The mouse model used in this study was the double transgenic APPSwe/PS1 strain 00462 from Jackson Laboratories (Bar Harbor, Maine). APPSwe is the Swedish mutation of the amyloid precursor protein, and PS1 is the mutant form of human presenilin 1. These are linked to increased levels of beta-amyloid (Aβ) plaques and early-onset AD, respectively. This model results in a substantial plaque burden by 12 months of age, with the development of Aβ deposits starting by 6 months of age. 23 This study used 6 male mice (4 APPSwe/PS1 and 2 C57Bl/6 control mice). The experimental protocol was approved by local Institutional Animal Care Committees who adhere to the guidelines and principles created by the Canadian Council on Animal Care (CCAC).
Imaging
The brains of the mice were imaged monthly as part of a previously published study comparing plaque burden to behavioral effects.
23
Three dimensional (3D)
Segmentation
The brains of the mice were segmented from the MRI images using a modified version of the active contour model 29 that utilizes a level set method 30 with constraints (CLS).
Li et al proposed a new variational formulation for active contours that forces the level set function to be close to a signed distance function, which bypasses the added computational requirement of the re-initialization procedure. 31
Uberti et al found that by fine tuning this level set method with the addition of points that constrain the evolving curve, it was possible to accurately segment a mouse brain. 32 User defined constraint points could be added to the method by manually drawing contours around the mouse brain in a few sagittal and axial slices.
MATLAB© (The Mathworks) code for the 2D CLS algorithm with all of the above refinements was used to segment all MR images of the mouse head. The mouse skull defines a dark boundary between the brain and the surrounding tissue. In some cases, more or fewer manually defined sections were required to account for variations in skull thickness altering this boundary. Three to five sagittal and three to five axial sections were manually defined to be used for the constraint points.
While segmentation is usually considered as a label map without retaining intensity information in the voxels, here the 2-class segmentation is being used to delineate the volume of interest, ie, the brain, while retaining the gray-scale intensities within this volume.
The olfactory bulb and the brain stem were manually removed after segmentation because of varying position of mice on the surface coil and varying centering of the field of view.
Registration
Before registration, all images were normalized to the mean intensity in the dorsal third ventricle. The normalized segmented images were then registered using the Oxford Centre for Functional MRI of the Brain (FMRIB) Linear Image Registration Tool (FLIRT) 33 with the algorithm set not to assume the images are oriented the same. FLIRT uses a modified Powell optimization method combined with an initial search and a 4-step multi-resolution procedure to solve the global optimization problem presented by volumetric registration. Affine transformations with 12 degrees of freedom were used. Best results were obtained when default parameters of tri-linear interpolation with a correlation ratio cost function were used. These initial default parameters were used for every single volume. One of the 6-month-old images was unusable due to motion artefacts, therefore, 7- month-old images were used as references for registration. The 6-month-old and subsequent 8- to 13-month-old images were all registered to the 7-month-old image from each mouse. In order to cross-validate the registration method and include variations in the 7-month-old images, 6-to 11- month-old images were also registered to the 13-month-old image from each mouse.
Determination of size changes
The parameters derived from the 4 × 4 affine transformation matrix were used for analysis. During registration, the images were scaled to align with both the 7-month and 13-month images. Three 3 × 3 matrices comprise the non-translational component of the 4 × 4 affine transformation matrix. One of these matrices is a diagonal matrix whose elements are scaling parameters along the principal axes, which correspond approximately to the three orthogonal directions: rostral-caudal, dorsal-ventral and medial-lateral.
The normalized inverse scaling parameter was defined as 1 at 7-months for the images registered to the 7-month reference data and at 13-months for the images registered to the 13-month reference data. A number larger than 1 for the normalized inverse scaling parameters in subsequent or preceding months indicated a growth in that direction of the brain by the relative amount of the normalized inverse scaling factor, whereas a normalized inverse scaling parameter less than 1 indicated a reduction in size. Brain volumes were determined by counting the number of non-zero-intensity pixels in the segmented images before registration.
One-way repeated measures ANOVA was used for statistical analysis of the normalized inverse scaling factors (medial-lateral, dorsal-ventral, rostral-caudal, and mean) and the brain volumes calculated in mm3 for APP/PS1 mice. In order to incorporate variations in the 7-month data and account for possible changes due to the choice of reference image, statistical analysis was performed on two separate sets of data: results for 8- to 13-month images registered to the 7-month reference images and results for 7- to 11-month images registered to the 13-month reference images. Six-month data is presented for comparison, but due to the noise in one of the images of an APP/PS1 mouse, it could not be included in the statistical analysis.
Results
Mouse brains were segmented and registered for 5 of the 6 mice and fully analyzed for only 4 of the 5 mice. One wild-type mouse died during its 10-month imaging session and one APP/PS1 mouse died during its 7-month imaging session. Data for the wild-type mouse that did not finish the study are included in the plots, but not in the analysis. Data for the APP/ PS1 mouse that did not finish the study was not included in the plots or analysis.
Figure 1 shows a representative axial section from the raw image of the wild-type mouse at 13 months of age (a) and the brain after it was segmented from the image (b) as well as a representative image from one of the APP/PS1 mice at 13 months of age (c) and the brain after it was segmented from the image (d). At this age, the APP/PS1 mouse brain has a heavy plaque burden.
23
Visually, the segmentation algorithm worked well for the mouse brains with the exception of one of the images of an APP/PS1 mouse at 6 months of age and the control mouse that did not complete the study at 10 months of age due to the low signal-to-noise of the image. Thus, none of the 6-month images were included in the ANOVA analysis.
Representative axial sections from three-dimensional MR images of wild-type (top) and APP/PS1 (bottom) mice before (left) and after (right) segmentation. The images were obtained from the mice at 13 months of age. The segmentation program effectively removed signal from the muscle and tissue surrounding the brain.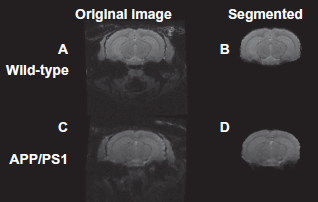
An example of the results of the registration and normalization can be seen in Figure 2. Coronal sections at the same distance from the top of the head are shown in Figure 2a at each month for one of the APP/PS1 mice. Again, visual inspection of the registered images showed good agreement. Difference images were calculated (target image) minus (reference image) and are displayed for the sections from Figure 2a in Figure 2b (difference images normalized to the 13-month image are not shown). Percentage difference for the difference images were also calculated as difference image divided by the sum total intensity of the normalized 7-month image. The percentage difference for the images registered to the 7-month images is shown in Figure 2c.
An example of the registration results for images from an APP/PS1 mouse taken monthly from 6 to 13 months of age. Shown are representative coronal sections at the same level for the same distance from the top of the normalized image at each time point after registration A). Difference images between the registered and target image, the 7-month image are displayed B). Percentage difference between the registered image and the 7-month image is shown in C). The brain structures appear to be accurately registered.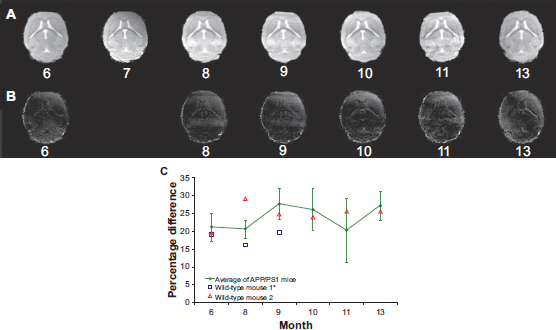
Brain volumes for the wild-type mice and the average brain volume for the APP/PS1 mice are shown in Figure 3. No significant differences were found in brain volume of APP/PS1 mice during the course of the experiment. The majority of the measured wild-type brain volumes fell within one standard deviation of the mean APP/PS1 brain volumes.
Longitudinal change in brain volume (mm3). One-way repeated measures ANOVA showed no significant monthly changes in the APP/ PS1 mouse brain volumes. The majority of wild-type brain volumes fell within one standard deviation of the mean APP/PS1 brain volumes.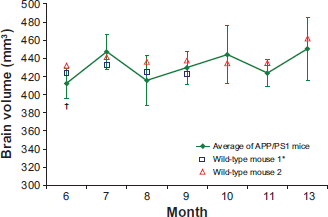
Mean and standard deviation of the normalized inverse scaling parameters to the 7-month images for each direction, and the mean of all 3 directions, were calculated for the APP/PS1 mice at each time point and are shown in Figure 4. A normalized inverse scaling factor larger than 1 indicates an increase in brain size. Similarly, a normalized inverse scaling factor less than 1 indicates a decrease in brain size.
Longitudinal change in the normalized inverse A) medial-lateral, B) dorsal-ventral, C) rostral-caudal, and D) mean scaling factors. One-way repeated measures ANOVA showed no significant monthly changes from 8 months to 13 months in the inverse medial-lateral, dorsal-ventral, rostral-caudal and inverse mean scaling factors of the APP/PS1 mouse brains. The majority of normalized wild-type brain scaling factors fell within one standard deviation of the normalized APP/PS1 brain scaling factors.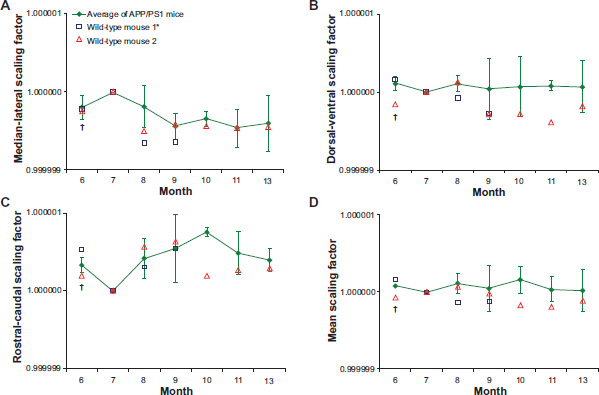
One-way repeated measures ANOVA showed no significant monthly changes from 8- to 13-months in the inverse medial-lateral, dorsal-ventral, rostral-caudal, and inverse mean scaling factors of the APP/PS1 mouse brains registered to the 7-month reference images (medial-lateral: F(4,8) = 0.654, P = 0.640; dorsal-ventral: F(4,8) = 0.020, P = 0.999; rostral-caudal: F(4,8) = 0.692, P = 0.618; mean: F(4,8) = 0.202, P = 0.930). Similarly, there were no significant monthly changes from 7 to 11 months in any scaling factors of the APP/PS1 mouse brains registered to the 13-month reference images (medial-lateral: F(4,8) = 0.593, P = 0.677; dorsal-ventral: F(4,8) = 0.920, P = 0.497; rostral-caudal: F(4,8) = 0.476, P = 0.753; mean: F(4,8) = 0.364, P = 0.828). There were also no significant monthly changes from 7 months to 13 months in the brain volumes calculated in mm3 (F(5,10) = 3.172, P = 0.057). The majority of normalized wild-type brain scaling factors fell within one standard deviation of the normalized APP/PS1 brain scaling factors (see Fig. 4 for the data registered to the 7-month images).
Discussion and conclusion
The data presented here indicate no significant volume or shape change in the transgenic APPSwe/ PS1 mouse brain from the age of 6 to 13 months as measured from magnetic resonance imaging of live mouse heads monthly. Another group measured brain volume in a similar wild-type and transgenic mouse and found the brain volume to increase during this time period. 24 In humans, it is more common to see brain atrophy with age.2–10 This indicates that brain volume changes are species specific and possibly gene mutation specific.
Occasionally, the full olfactory bulb was not included in the image and thus more of the brainstem was included in the image due to variations in mouse positioning on the surface coil and variations in positioning of the field of view. When registration was performed with the differing amounts of brainstem and olfactory bulb in the images, it appeared that errors were introduced in the z-direction scaling factor of 4 × 4 transformation matrix because the registration algorithm stretched or compressed the brains to compensate for the missing or extra parts of the olfactory bulb and brainstem. Thus, the brainstem and olfactory bulb were manually removed from all segmented images, and these images were registered again for analysis. If careful attention is used when choosing the field of view for imaging, the extra manual segmentation would not be needed. Registered images matched well to the 7-month image as can be seen in Figure 2c. This was also the case for the registration to the 13-month images (data not shown). The measured volume of the brains used in this study ranged between 412 mm3 and 462 mm3, whereas volumetric mouse brain sizes of transgenic mice have previously been reported to range between 512 mm3 and 553 mm3. 24 The volume of the olfactory bulb and brain stem could account for the discrepancy between the measurements.
No significant change in any of the normalized inverse scaling factors was detected when comparing the 8- to 13-month data registered to the 7-month images. Also, no significant change in any of the normalized inverse scaling factors was detected when comparing the 7- to 11-month data registered to the 13-month images. Eliminating the normalized inverse scaling factors which were defined as 1 removed the data point with zero standard deviation. Doing two comparisons, 7 to 11 months and 8 to 13 months, allowed all data to be included in the analysis.
Normalized inverse scaling factors, as shown in Figure 4, were all very close to 1. Therefore, size differences, if any, were on the order of parts per million in the brains during the course of the experiment. The 7-month scaling factor, for the first registration, and the 13-month scaling factor, for the second registration, were defined as 1 and no error bars were assigned to those points. Imaging the mouse brain multiple times with the same parameters over and over again in one imaging session, when no changes are expected, and following the methods outlined in this study, could give an estimate of the systematic error in these measurements. Unfortunately, it is impractical to keep an animal anesthetized for longer than 10 hours. Detailed calculations could be possible on the registration algorithm to determine the error in the calculated parameters. With this error incorporated into the measurements, registration and statistical analysis could be performed once, instead of twice, to determine if such a small change is significant.
A previous study, which used larger intrinsic volume voxels, found a 4 to 5 percent increase in brain volume from 6 to 14 months of age for mice. 24 For both this study and that previous study, 24 4 to 5 percent is on the order of the variations in the measurements, with this study having the slightly larger variation. For an accurate measurement, higher intrinsic resolution images need to be obtained.
Segmenting the brain into regions, as was previously done in studies in humans5,7–9 and animals, 24 can allow for a measurement of volume changes of specific regions within the brain that could provide more insight into Alzheimer's disease and its related gene mutations. For instance, previous studies have found hippocampal atrophy to be a good discriminator of mild cognitive impairment (MCI) from controls in humans. 9 A previous animal study found changes in the volume of various regions in a transgenic mouse model of Alzheimer's disease. 24 Other options for studying individual regions include non-linear transformations for registration, or registering only specific regions of the brain. Given the small size changes and the resolution limits of these studies and the one presented here, it would be better to perform much higher intrinsic resolution studies of the mouse for detailed volumetric studies of brain regions.
Previous studies have shown changes in the shape of several brain regions with age and dementia in humans.26–28 Thus it is important to study the shape of the brain as well as its volume. These previous studies determined shape changes from the amount of warping needed to make the image match an atlas. Our studies eliminate the need for an atlas by making multiple measurements on the same subject allowing for registration of images to each subject. No significant changes were observed in the shape of the APP/ PS1 mice, indicating shape changes also appear to be species and gene mutation specific.
Within the limits of the intrinsic resolution of the images used in this study, no significant difference in brain volume or brain shape was detected in transgenic APPSwe/PS1 mice from 6 to 13 months of age. Faster and higher-resolution imaging methods and more mice are needed to accurately determine if small volume changes occur in mouse brains with age or gene mutations.
Footnotes
Acknowledgements
The authors wish to acknowledge funding from the Natural Sciences and Engineering Research Council of Canada, the Alzheimer Society of Manitoba and the Board of Regents at University of Winnipeg and statistical consultation with Randy Summers from National Research Council Canada Institute for Biodiagnostics.
This manuscript has been read and approved by all authors. This paper is unique and not under consideration by any other publication and has not been published elsewhere. The authors and peer reviewers report no conflicts of interest. The authors confirm that they have permission to reproduce any copyrighted material.