
Abstract
Metabolomics is a relatively new technique that is gaining importance very rapidly. MRS-based metabolomics, in particular, is becoming a useful tool in the study of body fluids, tissue biopsies and whole organisms. Advances in analytical techniques and data analysis methods have opened a new opportunity for such technology to contribute in the field of diagnostics. In the MRS approach to the diagnosis of disease, it is important that the analysis utilizes all the essential information in the spectra, is robust, and is non-subjective. Although some of the data analytic methods widely used in chemical and biological sciences are sketched, a more extensive discussion is given of a 5-stage Statistical Classification Strategy. This proposes powerful feature selection methods, based on, for example, genetic algorithms and novel projection techniques. The applications of MRS-based metabolomics in breast cancer, prostate cancer, colorectal cancer, pancreatic cancer, hepatobiliary cancers, gastric cancer, and brain cancer have been reviewed. While the majority of these applications relate to body fluids and tissue biopsies, some in vivo applications have also been included. It should be emphasized that the number of subjects studied must be sufficiently large to ensure a robust diagnostic classification. Before MRS-based metabolomics can become a widely used clinical tool, however, certain challenges need to be overcome. These include manufacturing user-friendly commercial instruments with all the essential features, and educating physicians and medical technologists in the acquisition, analysis, and interpretation of metabolomics data.
Introduction
Magnetic resonance is now a common word in medical circles thanks to the success of magnetic resonance imaging (MRI). Less well known, and sometimes regarded with trepidation, is magnetic resonance spectroscopy, MRS, or NMR (nuclear magnetic resonance) to physical scientists. The former takes excellent images of soft tissue; the latter gives quantitative identification of chemical species in tissues or fluids. A critical factor in treatment of cancer is early diagnosis. Imaging reveals whether anatomy is normal or abnormal. Spectroscopy measures the chemical content of the cells, which must change significantly earlier than anatomical alterations are discernable. Therefore, a combined MRI/MRS assessment of a clinical subject is an ideal approach to early diagnosis of cancer. It is quickly being accepted in medical circles as valuable, but not so rapidly adopted in the contemporary approach to cancer screening or diagnosis. This is for several reasons: physicians and medical technologists are not usually trained to do MRS, commercial instruments are not well equipped to perform the successful methods already reported in the research literature, and additional costs may be incurred if clinics have to hire specialists in MRS. Despite these barriers, it is clear that the extra diagnostic power afforded by MRS will save lives, save costs to health care systems, and lead to more accurate following of patient response to treatment for cancer.
In the MRS approach to the diagnosis of disease, it is necessary to develop classifiers that deal with the many spectral components of the spectra. Some of these components will be relevant to diagnosis and most may be irrelevant. A robust diagnostic approach must depend on more than a single observation (spectral component, or resonance), but not on very many in order to avoid over-fitting. The first approach to classifier development must involve a reliable determination of which resonances are most indicative of the disease. This may be done by trial and error, a laborious and less than thorough approach, or by a systematic statistical approach. A very successful method employs the genetic algorithm for feature selection.1,2 Another frequently used method is principal component analysis, widely used in chemical and biological sciences. 3
Once the critically sensitive spectral components have been identified, a method to quantify this sensitivity is necessary. One commonly used method is partial least squares discriminant analysis (PLS-DA), where assessment of goodness of fit is taken to indicate the accuracy of the method. 4 A more robust and quantifiable approach is based on a statistical classification strategy (SCS). 5 It has the advantage of determining sensitivity, specificity and reliability of conclusion reached by MRS of potentially cancerous systems. We shall outline the methods and provide examples of their application, with a detailed description of the statistical methods in the Appendix. At this point we must emphasize an extremely important aspect and requirement of metabolomics: the number of subjects studied must be sufficiently large to ensure a robust diagnostic classification (see Fig. 1). 5

Representation of the risks of reaching conclusions with a sparse data set. Increasing the number of subjects generally lowers the accuracy, but this is much closer to the true accuracy. The lower accuracy solution will also be more robust: challenging the resultant classifier with new specimens will yield accuracy similar to that found by a reliable classifier. 5
Breast Cancer
Breast cancer is the leading cause of cancer deaths among women worldwide. Currently, mammography, biopsy and blood tests are used for diagnostic purposes. Mammography has serious limitations including a high rate of false positives and radiation concerns. Histopathology is very subjective and prone to errors. Blood-based tests are attractive in that they are minimally invasive but suffer from poor sensitivity and specificity. Thus, a more accurate, non-invasive diagnostic technique is needed. A number of investigators have attempted to use 1H MRS-based metabolomics (serum, biopsy, and in vivo) to address this diagnostic challenge. Some of the more recent work is reviewed herein, see also Zhang et al. 6
In a study by Jobard et al, 7 serum samples obtained from patients with metastatic breast cancer and those with localized early stage breast cancer were analyzed by 1H MRS. The authors were able to differentiate EBC (early stage breast cancer) from MBC (metastatic breast cancer) patients (n = 85: 46 EBC and 39 MBC), which was validated with an independent cohort (n = 112: 61 EBC and 51 MBC; 89.8% sensitivity, 79.3% specificity). Eight significant metabolites were identified in this discrimination: histidine, acetoacetate, glycerol, pyruvate, glycoproteins (N-acetyl), mannose, glutamate and phenylalanine. This work demonstrated the strong potential of NMR metabolic phenotyping for the diagnosis, prognosis, and management of breast cancer patients.
Serum MRS-analysis has also been performed on samples obtained from women with advanced metastatic breast cancer with the objective of exploring outcome and response to treatment. 8 Pre-treatment and serial on-treatment serum samples were available from an international clinical trial in which 579 women with metastatic breast cancer were randomized to paclitaxel plus either a targeted anti-HER2 (human epidermal growth factor receptor 2) treatment (lapatinib) or placebo. Serum metabolomic profiles were obtained using 600 MHz MRS. Profiles were compared with time to progression, overall survival and treatment toxicity. The metabolomic profiles did not correlate with outcome or toxicity. In a subgroup of patients with HER2-positive disease treated with paclitaxel plus lapatinib, metabolomic profiles from patients in the upper and lower thirds of the dataset showed significant differences for time to progression (N = 22, predictive accuracy = 89.6%) and overall survival (N = 16, predictive accuracy = 78.0%) suggesting that metabolomics may play a role in selecting a subset of patients with HER2-positive disease with greater sensitivity to paclitaxel plus lapatinib. A larger cohort is required to verify this result. A recent review of MRS of cancer signatures in biofluids is given by Duarte and Gil. 9
In a study by Mountford et al, 10 fine-needle aspirates taken from breast tumours were subjected to 1H MRS and the resulting data were analyzed using an SCS-based classifier (see the Appendix). Malignant tissue was distinguished from benign lesions with an overall accuracy of 93%. Moreover, from the same spectra, lymph node involvement was predicted with an overall accuracy of 95%, and tumor vascular invasion with an overall accuracy of 94%. This is quite interesting, given that the pathology, nodal involvement and tumor vascular invasion were all predicted by SCS classification of the proton MRS spectrum from a fine-needle aspirate biopsy taken from the primary breast lesion. In a related study by Lean et al, 11 1H magnetic resonance (MR) spectra of fine needle aspiration biopsies (FNAB) obtained from primary breast lesions were analyzed, to assess tumor grade, estrogen receptor (ER) status, and progesterone receptor (PgR) status. Grade 1 and 2 breast cancers were separated from grade 3 cancers with a sensitivity and specificity of 96% and 95%, respectively. The ER status was predicted with a sensitivity of 91% and a specificity of 90%, and the PgR status with a sensitivity of 91% and a specificity of 86%. This approach allowed an objective method for determining the above prognostic indicators simultaneously with the diagnosis of primary pathology and lymph node involvement. It should be noted that the n-values in these studies were insufficiently large to lead to a robust classifier. A more intensive study of a larger cohort is underway.
Recent progress in the use of high resolution magic angle spinning 1H MRS (HRMAS) has resulted in better resolution and enhanced diagnostic potential of MR metabolomics. In a study by Li et al, 12 HRMAS 1H MRS studies were performed on 31 breast tissue samples (13 cancer and 18 non-cancer) obtained by percutaneous core needle biopsy. There was good discrimination between cancer and non-cancer samples using orthogonal projections to latent structure-discriminant analysis (OPLS-DA) multivariate model on the MR spectra. Results of a blind test showed 69% sensitivity and 94% specificity in the prediction of cancer status. A spectral analysis showed that in cancer cells, taurine- and choline-containing compounds were elevated. This result needs to be verified with a larger cohort.
The potential of HRMAS 1H MRS metabolomics to predict prognostic factors, such as axillary lymph node status and estrogen and progesterone receptor status, was also explored in a recent study by Giskeødegård et al. 13 Biopsies from breast cancer patients (n = 160) were excised during surgery and analyzed. The spectral data were preprocessed and variable stability (VAST)-scaled, and training and test sets were generated using the Kennard-Stone and SPXY sample selection algorithms. The data were analyzed by partial least-squares discriminant analysis (PLS-DA), probabilistic neural networks (PNNs) and Bayesian belief networks (BBNs), and blinded samples (n = 50) were used for verification. Estrogen and progesterone receptor status were successfully predicted from the MR spectra, and were best predicted by PLS-DA with a correct classification of 44 of 50 (88%) and 39 of 50 (78%) samples, respectively. Lymph node status was best predicted by BBN with 34 of 50 samples correctly classified, indicating a relationship between metabolic profile and lymph node status as suggested earlier by the study by Mountford et al. 10
In a study by Bathen et al, 14 the feasibility of HRMAS 1H MRS of small tissue biopsies to distinguish between tumor and non-involved adjacent tissue was investigated. With the current methods, delineation of the tumor borders during breast cancer surgery is challenging. The surgery is repeated often because of poor delineation. In this study, 328 tissue samples from 228 breast cancer patients were analyzed using HRMAS 1H MRS. PLS-DA was applied to discriminate between tumor and non-involved adjacent tissue. Using double cross-validation, high sensitivity and specificity, of 91% and 93% respectively, were achieved. Analysis of the loading profiles from both principal component analysis (PCA) and PLS-DA showed the choline-containing metabolites as main biomarkers for tumor content, with phosphocholine being especially high in tumor tissue. Other metabolites with diagnostic potential included glycine, taurine and glucose. is cohort was of adequate size for reliability of conclusions. A review of this and other work has appeared. 15
In vivo MRS of the breast is also being advanced in many centers to complement MRI examinations in order to improve the diagnostic specificity.16–20 Malignant breast tissues show elevated water-to-fat ratio and total choline levels. Moreover, these levels have also been shown to change in response to treatment, and hence can be used to monitor and predict treatment response. While the choline peak has been of particular interest in breast cancer diagnostics via in vivo MRS, its detection rate needs to be improved with technological advances for it to be of clinical utility. Furthermore, with the increasing number of patients undergoing in vivo MRS of the breast, it may be worthwhile to subject the whole spectral region to metabolomics analysis instead of only focusing on choline.
Prostate Cancer
Prostate cancer is the most common cancer among men in the western world. A number of clinical challenges remain in the diagnosis and management of this disease. The widely used PSA test has become somewhat controversial lately. Some of the clinical challenges encountered in the diagnosis of prostate cancer include detecting cancers in subjects with low PSA values, differentiating aggressive from quiescent tumors, and detecting high grade prostate intraepithelial neoplasia (PIN). In order to address some of these challenges, the use of NMR spectroscopy (on tissues and fluids and subsequently in vivo) has been explored since the 1990s. While the earlier work focused primarily on tissue extracts and cell cultures, the first article on MRS of intact prostate tissue appeared in 1997. 21 is approach helped maintain the architecture of the tissue and thus enabled histopathological analysis on the same tissue. The spectra obtained were closer in appearance to the in vivo situation than those obtained from extracts. Furthermore, this was the first metabolomics analysis (using SCS) on prostate tissue. In the study, 1H MRS, 360 MHz, was performed on specimens of benign (n = 66) and malignant (n = 21) human prostate tissue from 50 patients, and the spectral data were subjected to multivariate analysis, specifically linear-discriminant analysis. On the basis of histopathological assessments, an overall classification accuracy of 96.6% was achieved, with a sensitivity of 100% and a specificity of 95.5% in classifying benign prostatic hyperplasia from prostatic cancer. Resonances due to citrate, glutamate, and taurine were among the six spectral subregions identified by the algorithm as having diagnostic potential. It should be noted that these regions were not selected prior to the analysis. A similar work, based on a limited cohort size, looked at the zonal variation within the prostate.22,23
1
H MR spectra (360 MHz, 37°C) of prostate tissue specimens.
Extending the application to the study of tumor recurrence after radiotherapy, MRS analysis was performed on trans-rectal ultrasound-guided prostate biopsies from 35 patients obtained 18–36 months after external beam radiotherapy. 24 One hundred sixteen tissue specimens were subjected to 1H MRS and analyzed with a multivariate strategy specifically developed for biomedical spectra. The sensitivity and specificity of MRS in identifying a malignant biopsy were 88.9% and 92%, respectively, with an overall classification accuracy of 91.4%. The diagnostic spectral regions identified by the algorithm included those due to choline, creatine, glutamine, and lipid.
The adoption of a widely known technique in solid state MRS, magic angle spinning, to tissue NMR has led to the enhancement of resolution of the spectra. HRMAS has been able to generate spectra with resolution equivalent to those of extracts but with the tissue architecture maintained intact. Such an approach allowed the detection and analysis of more metabolites that have diagnostic potential in prostate cancer and is proving to be a useful tool for cancer metabolomics.25–28
1 H MRS has also been useful in analyzing body fluids to detect changes in composition reflecting the disease process. To this end, prostatic fluids and semen have been analyzed with the objective of developing a non-invasive screening test for prostate cancer. In a study reported by Kline et al, 29 ROC curves analysis of the citrate levels determined in semen and prostatic fluids showed that such measurements outperformed PSA testing for detecting prostate cancer. In another study by Serkova et al, 30 the logistic regression models indicated that the absolute concentrations of citrate, myo-inositol and spermine determined in prostatic secretions were highly predictive of prostate cancer.
Over the last decade, in vivo MRS studies of the prostate have been performed in a number of Institutions with UCSF, Nijmegen Medical Centre, and the Sloan Memorial Cancer Center being the most notable ones. The in vivo results mirrored more or less what was observed in the ex vivo studies.31–34 While these centers generated a number of reports on the use of MRS/MRSI in addressing diagnostic problems in the prostate, the number of patients/subjects enrolled in a given study has not been large enough for a robust metabolomics analysis. However, given the foundation laid by the ex vivo work and increasingly larger patient cohorts to be enrolled in these studies, such analysis could be done in the not-so-distant future.
Colorectal Cancer
A recent study utilized HR-MAS 1H MRS spectroscopy to analyze metabolites in intact tumor samples (n = 83) and samples of adjacent mucosa (n = 87) obtained from 26 patients undergoing surgical resection for CRC. OPLS-DA of metabolic profiles identified marked biochemical differences between cancer tissue and adjacent mucosa (R 2 = 0.72; Q 2 = 0.45; AUC = 0.91). Taurine, isoglutamine, choline, lactate, phenylalanine and tyrosine were elevated in tumor tissue, whereas lipids and triglycerides were decreased. 35 In another study, 1H MRS was used to profile the serum metabolome in patients with metastatic CRC (mCRC) and determine whether a disease signature may exist that is strong enough to predict overall survival. In 153 patients with mCRC and 139 healthy subjects, two independent sets of serum samples were analyzed. In the training set, 1H MRS metabolomic profiling discriminated patients with CRC from healthy subjects with a cross-validated accuracy of 100%. In the validation set, 96.7% of subjects were correctly classified. Patients from the training set with maximally divergent overall survival were chosen to construct an overall survival predictor. 36 Plasma samples were analyzed by combining fluorescence spectroscopy with other biomarkers, CEA and TIMP-1 and traditional 1H MRS-based metabolomic measurements that showed promising results in the early detection of colorectal cancer. 37
Both HRMAS NMR and gas chromatograpy-mass spectrometry were combined for the global metabolic profiling of biopsied colon tissue from CRC patients and their matched controls. 38 Orthogonal partial least-squares discriminant (OPLS-DA) analysis models generated from metabolic profiles from 1H MRS and MS discriminated normal from malignant samples. A 1H MRS study of tissue from CRC reported a number of metabolites including choline and lipids as diagnostic markers of colon cancer. 39 It was suggested that the use of 1H MRS can be an adjunct to current pathological procedures. A combination of 1D and 2D 1H MRS was used to detect metabolites in colon tumors and normal mucosa after extraction using perchloric acid. 40 The high myo-inositol and taurine levels in tumors and the reciprocal changes found in normal mucosa were reported to be possible malignancy markers. Another 1H MRS study reported elevated taurine levels and reduced exogenous polyethyleneglycol as the possible malignancy markers in tissue biopsies. 41
31 P MRS studies have identified a number of individual metabolites including phospholipids in malignant and non-malignant tissue.42–45 It has been shown that lipids such as lysophosphatidylcholine and phosphatidylcholine plasmalogen are elevated whereas sphingomyelin and phosphatidyleth-anolamine plasmalogen are significantly reduced in malignant tissue. 42 These lipid profiles may be used to estimate malignant propensity and aggressiveness of disease, and provide prognostic information. Saponified phospholipid extracts of malignant and normal tissue specimens generated characteristic phosphodiester profiles, which were used to differentiate malignant from normal samples. 45
Fucolipids accumulation in human colonic adenocarcinoma was investigated by isolating two neutral fucolipids from colonic tissue and characterizing them using a number of methods including 1H MRS and MS. 46 An investigation of plasma membrane using 1H-1H COSY experiments has identified fucose shed from human malignant colorectal cells. 47
1 H MRS studies of fecal extracts from patients with CRC and healthy individuals were able to characterize the metabolic differences between the two groups.48,49 The differentiation between controls and patients with CRC is reported to open avenues for developing new, efficient, high-throughput screening protocols for CRC. In a recent 1H MRS study on a large number of cancer patients and controls, the 1H MRS data were subjected to preprocessing, feature selection and classifier development stages of the SCS to obtain high classification accuracy. 49
Suitability of a rat model to study human colon cancer has been investigated using colon tissue from both rats and humans.50,51 The levels of lipid in human and rat colon have been shown to be similar and tumors contained significantly more taurine than pure control mucosa. 51 The results suggested that rat colon is a good model for the investigation of human colon carcinogenesis. In a separate 1H MRS study, data from colonic mucosa and tumor samples of a rat model were analyzed with multivariate methods and shown that aberrant crypt foci represent one of the earliest events in colon carcinogenesis. 52
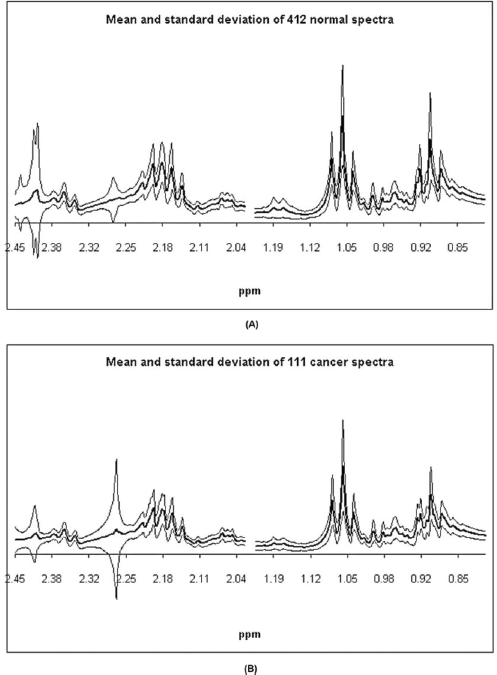
Mean and ± one standard deviation about the mean of (A) the 412 1D 1H MR spectra (400 MHz, 300 K) for the normal samples and (B) of the 111 1D 1H MR spectra (400 MHz, 300 K) for the colorectal cancer samples. 49
The combined effects of everolimus and irinotecan in CRC cell lines were evaluated in vitro and in vivo. Both drugs demonstrated synergistic anti-proliferative effects in multiple CRC cell lines in vitro. Everolimus demonstrated significant tumor growth inhibition in HT29 and HCT116 tumor xenografts alone and also when combined with irinotecan. 1H MRS-based metabolomic analysis showed that everolimus caused a decrease in glycolysis in both tumor types, whilst irinotecan treatment resulted in a profound accumulation of lipids in HT29 tumors, indicating a cytotoxic effect. 53
Hepatocellular Carcinoma (HCC)
A number of studies have focused on understanding metabolic changes in malignant hepatobiliary diseases.54,55 Analysis of 1H MRS data using SCS is reported to distinguish normal liver tissue from HCC with an accuracy of 100%. 56 Measurement of lactate in serum and bile using 1H MRS spectroscopy has also been reported to be potentially useful for the detection of hepatobiliary malignancies. 57 An HR-MAS 1H MRS of liver tissue was used to explore biomarkers for liver cancer. 58 In an animal model of HCC with metastatic lung cancer, alterations in glycolysis including glycine- and choline-metabolism were observed. 59 Bile homeostasis was studied using 1H MRS to distinguish liver diseases, including HCC, from liver disease–free controls. 60 A recent study utilized orthogonal projection of latent structure (OPLS) analysis to differentiate serum 1H MRS spectral patterns of HCC from those of alcoholic cirrhosis patients. 61 Glutamate, acetate, and N-acetylglycoproteins were found to be elevated in HCC patients compared to cirrhotic patients.
Cholangiocarcinoma (CC)
There are a few studies on 1H MRS-based metabolomics of bile in the diagnosis of cholangiocarcinoma.62–65 A study on bile from cholangiocarcinoma patients (with and without primary sclerosing cholangitis) reported a reduction in the levels of major bile metabolites such as phosphatidylcholine, bile acids and cholesterol compared to benign diseases. 62 Using SCS-derived classifiers, the 1H MR spectral patterns of CC were differentiated from the benign control group with an accuracy of 88%. PLS-DA methods were used to differentiate bile 1H MRS spectral patterns of CC from those of benign cases.63,65
Pancreatic Cancer
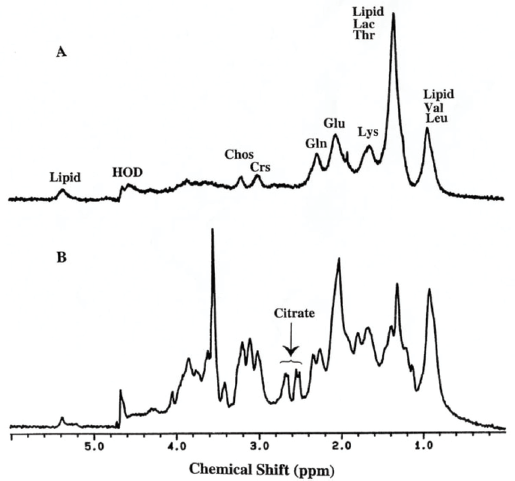
Several studies have focused on understanding metabolic alterations in pancreatic cancer. A partial least square discriminant function (PLS-DF) model was used to distinguish 1H MRS spectral data of plasma extracts from pancreatic cancer patients and healthy controls, with an accuracy of ~92%. 66 Recently, OPLS-DA methods have been utilized to distinguish 1H MRS spectral patterns of urine and serum samples from pancreatic cancer patients and benign/healthy controls.67–69 An 1H MRS study of an animal model reported elevated levels of taurine and lactate in perchloric acid extracts of cancerous pancreatic tissue samples when compared to controls. 70 An HRMAS 1H MRS study of cancerous pancreatic tissue reported decreased levels of phosphocholine and glycerophosphocholine. 71 Based on the lipid contents in intact pancreas and pancreatic tissue specimens, in vivo human and animal model studies differentiated pancreatic cancer and chronic pancreatitis;71,72 the total lipid content was elevated in pancreatic cancer compared with chronic pancreatitis. Several investigations have focused on the analysis of bile and pancreatic juice from patients with pancreatitis and pancreatic cancer using 1H/31P MRS.64,73–76 One study reported reduced levels of phosphatidylcholine, 64 while another found elevated levels of D-glucuronic acid in bile samples from pancreatic cancer patients. 74 The 1H MR spectrum of pancreatic juice shows the presence of a battery of amino acids (valine, leucine, and isoleucine, alanine, threonine, glutamine, lysine, tyrosine, histidine, phenylalanine, tryptophan) and other small molecules such as lactate, acetate, formate, urea, and glucose.75,76 The spectrum from a pancreatic cancer patient showed the absence/decreased levels of the above common metabolites, except for elevated levels of lactate and glucose, compared to the benign cases. 76
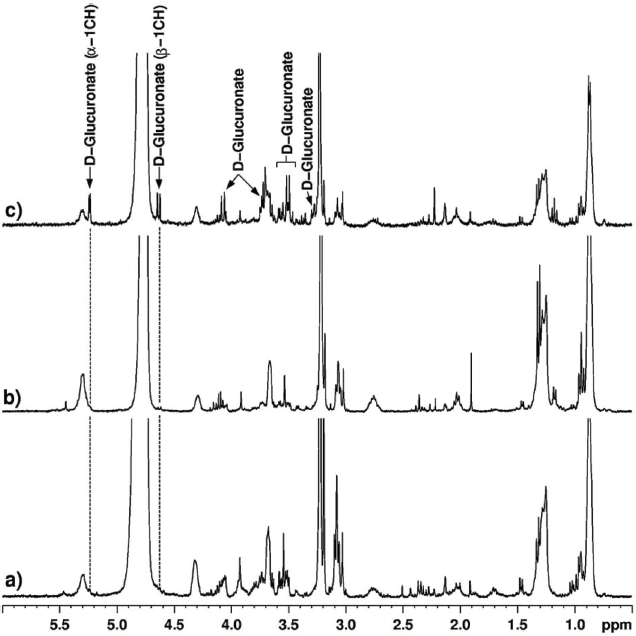
1H MRS spectra (360 MHz) of bile from (
Gallbladder Cancer
An NMR study aimed at investigating gallbladder carcinogenesis showed clear differences in bile, gallbladder tissue and gallstone composition between cancerous and benign gallbladders.77,78 Bile samples from cancer patients showed reduced levels of some conjugated bile acids and elevated levels of urea, whereas tissue specimens showed increased levels of choline containing metabolites. The levels of cholesterol in gallstones were significantly decreased whereas calcium and magnesium were significantly elevated in gallbladder cancer (GBC) patients compared to those of benign gallbladder diseases (chronic cholecystitis and xanthogranulomatous cholecystitis). 78 Similarly, 1H HRMAS analysis of gallbladder tissue showed elevated levels of phospholipids and cholesterol lipids and decreased levels of cholesterol and triacylglycerol in GBC patients compared to those of chronic cholecystitis and xanthogranulomatous cholecystitis. 79 Such alterations in different lipid components in benign and malignant disease may aid in the identification of the biological pathways involved in the carcinogenesis of gallbladder.
Gastric Cancer
A few studies have focused on the understanding of metabolic changes in gastric cancer.80,81 Human gastric mucosa from normal and pathological/malignant sites has been studied by 1H MRS. 80 The normal gastric tissue showed the presence of lipids, alanine, N-acetyl neuraminic acid, and glutathione, whereas the cancerous tissue showed decreased levels of lipids, and significant levels of lactate and choline. 80 Another study revealed that the presence of biochemicals such as glycine, alanine, free choline, and triglycerides in gastric tissue would serve as possible biomarkers of neoplastic transformations. 81
Brain Cancer
Although this was one of the first cancers to be studied in detail, cohorts were small and very little use was made of advanced statistical methods. The use of tissue 1H MRS metabolomics in this area has been explored by a few investigators. Somorjai et al demonstrated how classification accuracy can be improved when both different data preprocessing methods and computerized consensus diagnosis (CCD, the precursor of the SCS) are applied to 1H MR spectra of astrocytomas, meningiomas, and epileptic brain tissue. 82 The MR spectra (360 MHz) of tissue specimens (biopsies) from subjects with meningiomas (95; 26 cases), astrocytomas (74; 26 cases), and epilepsy (37; 8 cases) were preprocessed by several methods. Each data set was partitioned into training and validation sets. Robust classification was carried out via linear discriminant analysis (LDA), artificial neural nets (NN), and CCD, and the results were compared with histopathological diagnosis of the MR specimens. The spectra-based average three-class classification accuracies determined by LDA and NN increased from 81.7% (unnormalized data sets) to 89.9% (normalized). CCD increased the classification accuracy of the normalized sets to an average of 91.8%.
The histopathological grading of oligodendrogliomas, which is essential for better therapeutic management of these patients, is still controversial. In a study by Erb et al, 83 the metabolomes of 34 human brain biopsies, histopathologically classified as low-grade (LGO, N = 10) and high-grade (HGO, N = 24) oligodendrogliomas, were studied using HRMAS 1H MRS and multivariate analysis. Despite the small cohort, the classification model yielded a distinction between LGOs and HGOs and provided some useful insights into the different metabolic pathways that underlie malignancy grading, with HGOs showing the presence of tumoral hypoxia. The statistical model was then used to study biopsy samples that were classified as intermediate oligodendrogliomas (N = 6) and glioblastomas (GBMs) (N = 30) by histopathology. The results revealed a gradient of tumoral hypoxia increasing in the following direction: LGOs, intermediate oligodendrogliomas, HGOs and GBMs. Interestingly, clinical assessment of the patient correlated better with the metabolomics results than with the histopathological analysis.
Analyses of CSF and serum have also been performed with the objective of detecting brain malignancies from the changes exhibited in lipid composition. In a study reported by Srivastava et al, higher levels of cholesterol and phospholipids were observed in sera obtained from tumor patients compared to normal individuals. 84 Similarly, in the CSF analysis, cholesterol, cholesterol esters, and choline-containing phospholipids were absent in normal individuals and patients with other neurological (non-malignant) disorders.
In brain tumors, diagnosing tumor type and grade noninvasively has been a clinical challenge. Such information would be useful for designing treatment and management strategies. Interestingly, most of the 1H MRS in vivo to date has been done on the brain. This is primarily due to the reduced effects of motion and lipid contamination in the brain. In a classification (using LDA) of MR spectra obtained in vivo, all non-astrocytic tumors were classified correctly. 85 The result with the astrocytic tumors was not as good, possibly due to some spectra showing very little lipid signal. This analysis had both training and independent (test) sets, which should be the case in a rigorous metabolomics analysis, but involved only a small cohort.
Although conventional 1H MR imaging has increased our ability to detect brain tumors, it has not enhanced to nearly the same degree our ability to diagnose tumor type. Using 1H MRS, Preul et al characterized and classified tissue from normal brains, as well as tissue from the five most common types of adult supratentorial brain tumors. 86 These six tissue types differed in their pattern across the six metabolites measured. ‘Leave-one-out’ LDA (LDA-LOO) based on these resonance profiles correctly classified 104 of 105 spectra, and, whereas conventional preoperative clinical diagnosis misclassified 20 of 91 tumors, the LDA approach missed only 1. Thus, it was concluded that a pattern-recognition analysis of the biochemical information obtained from 1H MRS can help in the accurate, noninvasive diagnosis of the most prevalent types of supratentorial brain tumors.
Preul et al87 performed pattern analysis of spectroscopic imaging (1H MRSI) data in a variety of situations related to the clinical management of patients with brain tumors and other cerebral space-occupying lesions (SOLs). They demonstrated how the LDA-LOO-based classification of in vivo 1H MRSI spectral patterns could lead to quick, accurate and non-invasive discrimination amongst tissue arising from the five most common types of supratentorial tumors found in adults. Their findings suggest that pattern recognition analysis of 1H MRSI data can significantly improve the diagnostic specificity and surgical management of patients with certain cerebral SOLs.
The effect on classification accuracy of using different TE values in the in vivo spectroscopy of brain was also investigated by Majos et al. 88 In this study, 151 patients with brain tumors (37 meningiomas, 12 low grade astrocytomas, 16 anaplastic astrocytomas, 54 glioblastomas, and 32 metastases) were retrospectively selected from a series of 378 consecutive examinations of brain masses. Single-voxel (SV) 1H MRS, TE 30 ms and 136 ms, was performed with point-resolved spectroscopy in all cases. Overall, tumor classification was slightly better at short TE (123 of 151 cases, 81% correctly classified), than at long TE (118 of 151 cases, 78% correctly classified).
In pathological situations, the 1H MRS profile changes, and this has been particularly well described for brain tumors. However, radiologists are frequently unfamiliar with the interpretation of MRS data, and for this reason, the usefulness of decision-support systems (DSS) in MRS data analysis has been explored. INTERPRET DSS (version 3.0) allows radiologists, medical physicists, biochemists or anyone with a minimum knowledge of what an MR spectrum is, to enter their own SV raw data, acquired at 1.5 T, and to analyze them. 89 The system is expected to help in the categorization of MR spectra from abnormal brain masses.
Conclusion
Clearly there has been considerable effort to use magnetic resonance spectroscopy to diagnose cancer early and to follow the progress of treatment. Many types of cancer have been investigated, but very few of them in a comprehensive, robust manner. Metabolomics, the use of reliable statistical methods, is now well accepted as an alternative to simpler methods such as visual inspection. Once the methods have been made simpler to use, there is little doubt that metabolomics will be the standard analysis. In vivo spectroscopy, after a rapid start on brain cancer, has only slowly gained momentum. The slowness is in part due to the poor quality of hardware and software supplied by the major manufacturers, and to the difficulty of recruiting cohorts of sufficient size to yield methods with reliable conclusions. A hopeful thrust towards solution of the first problem is now being made in a consensus report currently under preparation by members of the community and to be published in Radiology in early 2014. It will deal with the problems of complexity of the methods, outline standard procedures, and make recommendations for suppliers for minimum spectroscopic packages. On the statistical side, there is a rapid pace of development of methods, but still no document capable of making it sufficiently clear for non-mathematicians. We attempt in this appendix to clarify most of the issues, especially the need for adequate numbers of patients and normal subjects to make a cancer classifier robust and accurate.