
Abstract
Over 240 food samples from six food groups (tree nuts, grains and grain products, dried fruits, fresh produce, fruit juice, and dairy products) were tested for levels of fungal contamination using the NEO-GRID hydrophobic grid membrane filter (HGMF) and the FDA official (BAM) method. Results showed that HGMF performed very well for all tested commodities giving yeast and mould (YM) counts similar to those of the BAM (reference) method. Statistical analysis of the data (t-test) revealed no significant differences between the two methods for all foods tested. Regression analysis showed that there was a good fit linear relationship between the two methods for most of the commodities examined. Some difficulties were encountered during counting of the colonies on HGMF since the size of the grid is very small and the number of possible colonies per plate can reach 1600.
Introduction
Food invasion and spoilage by fungi (yeasts and moulds) is an unavoidable fact. When the fungal decomposition is extensive, it leads to vast economic losses. The occurrence of high levels of these organisms in foods is an indicator of inferior quality products. A bigger problem with fungal infestation is the association of certain moulds with adverse health effects towards humans and animals due to production of toxic secondary metabolites, mycotoxins. The presence of high numbers of toxigenic moulds often indicates the possible co-occurrence of mycotoxins. Therefore, it's very important that such organisms be monitored.
Traditional plating methods are primarily used for the isolation and quantification of fungi in foods. A widely-utilized conventional technique is the FDA official method for mould and yeast analysis of foods. 1 A drawback of this method is its requirement of a relatively long (5-day) incubation period. Therefore, there is a need for more rapid methods that can give results equivalent to those of the BAM method. An alternative to conventional mycological methods is the hydrophobic grid membrane filter (HGMF) technique. The HGMF unit consists of a square filter (approximately 5 cm × 5 cm) with hydrophobic grids that divide it into 1600 compartments. The hydrophobic grids restrict the size of the colonies and facilitate counting when high numbers of colonies are present. After filtration of the inoculum, the HGMF filter is aseptically placed on an YM-11 agar plate and incubated to grow. The YM-11 medium contains nutrients appropriate for fungal growth, antibiotics (chloramphenicol and chlortetracycline) and a special dye (trypan blue) that stains fungal colonies and aids counting. The HGMF method has the advantage that it requires shorter incubation time (48–52 hours) than conventional plating methods (e.g. BAM method); a negative aspect of HGMF is that requires longer time for inoculum preparation and inoculation because of the filtration and (for some foods) the enzyme digestion steps.
Past studies using naturally-contaminated or artificially-infected foods showed that the ISO-GRID HGMF compared favorably to conventional agar media used for the enumeration of fungal populations in foods.2–5 In this study, a newer HGMF for yeast and mould enumeration, NEO-GRID, was tested against the current FDA (BAM) method to evaluate its efficacy for the quantification of fungi in various naturally-contaminated food commodities.
Materials and Methods
Materials
Two hundred forty four naturally-contaminated food samples (approximately 1-lb portions) comprised of tree nuts (pecans, almonds, pine nuts and walnuts), grains and grain products (corn meal, corn muffin mix, popcorn, wheat flour and rice), dried fruits (apricots, cranberries, papaya, pineapple and raisins), fresh produce (blueberries, grapes, lettuce, sprouts and tomatoes), fruit juice (apple and grape juice), and dairy products (yoghurt and sour cream) were purchased from local supermarkets and tested for the presence and levels of fungi using the NEO-GRID hydrophobic grid membrane filter and the dilution plate (BAM) method. Fresh produce and dairy products were kept refrigerated from the time of purchase until testing began. All other samples were kept at room temperature until commencement of the analysis. Testing was conducted within 24 hrs from the time of purchase. For each commodity (except for apricots) at least 10 samples were tested and the values presented in the results section reflect the mean value of all tests performed. Details are shown in Table 2. The filtration manifold, NEO-GRID filters, whirl-pak filtration bags, enzymes and YM-11 agar were obtained from Neogen Corporation (Lansing, MI, USA). Media and reagents used in the dilution plating method were prepared in-house as described in BAM Online. 1
Mycological analysis
Fifty grams from each sample were analyzed. The dilution plating was conducted according to the BAM Online method using 0.1% peptone water as diluent and DRBC or DG18 agar as isolation media. 1 DRBC was used for the analysis of foods with water activity (aw) equal to or higher than 0.95, while DG18 was used for the isolation of moulds and yeasts from dried foods (aw < 0.95). The HGMF filters were inoculated, incubated and read following the manufacturer's instructions. The sample suspensions were prepared in 0.1% peptone water and pre-filtered using whirl-pak filter bags. Subsequently, 1 ml portion of appropriate dilutions were added to NEO-GRID filter units containing Butterfield's phosphate buffer or Butterfield's phosphate buffer with 1% Tween 80 and vacuum-filtered through the NEO-GRID HGMF filter. Some of the product homogenates were subjected to an appropriate enzyme digestion before filtration (Table 1) in order to enhance filtration. After filtration, the filters were aseptically transferred (grid-side up) on YM-11 agar plates and plates were incubated for 48–52 hrs at 25 °C; when the incubation period was over, colonies were counted and counts were converted to MPN/g or MPN/ml using the conversion Table provided by Neogen Corporation.
Diluents and enzyme digestion treatments needed to facilitate filtration.
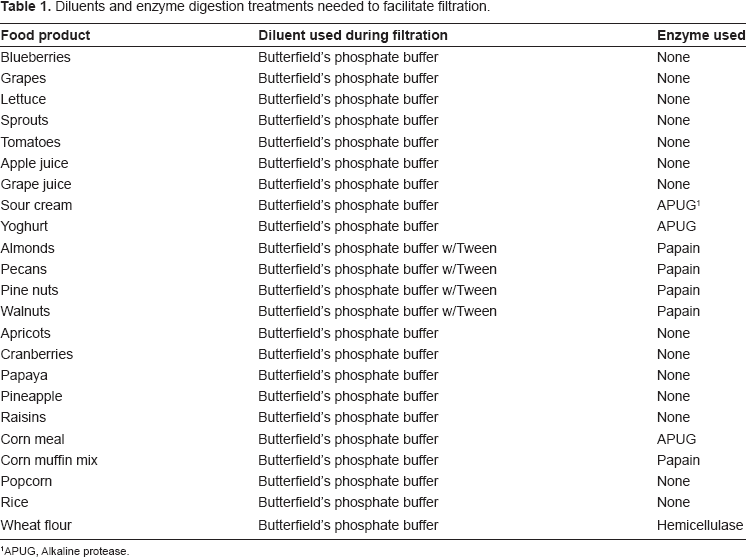
APUG, Alkaline protease.
Statistical analysis
T-tests (paired and equal variance) were conducted to compare the BAM and HGMF methods. Linear regression was also performed to determine whether a linear relationship existed between the BAM method and the HGMF method. 6
Results and Discussion
Yeast colonies on HGMF were small and stained blue, while mould colonies were larger and of light grayish colorations. Mean fungal counts obtained from the NEO-GRID HGMF method using YM-11 agar and the reference (BAM) method are shown in Table 2. All pineapple, papaya, yoghurt and pasteurized apple and grape juice as well as some of the pecan, almond, apricot, cranberry, raisin, rice, wheat flour, popcorn, sour cream, grape and tomato samples had YM counts below the detection limit (<100 cfu/g). For the purpose of statistical analysis those data were given a log10 value equal to 1.70. Statistical analysis of the data showed that the two methods were similar in sensitivity. Differences between log10 mean count values from the BAM and HGMF methods were less than 0.15 for all commodities tested. T-test analyses (paired and equal variance) showed that the differences between the two methods were not significant (α = 0.05) (Table 2). P values (equal variance) ranged between 0.473 and 1. For 78% of the commodities, p values were higher than 0.83 indicating that counts obtained from the two methods were quite similar. The p values obtained from the paired t-test ranged between 0.094 and 1. One product (wheat flour) had a borderline (<0.10) p value. Brodsky et al also reported that there were no significant differences between the ISO-GRID HGMF and a conventional spread plate method used to enumerate yeasts and moulds in various naturally-and artificially-contaminated foods, 7 whereas Entis and Lerner demonstrated that an ISO-GRID HGMF method using YM-11 agar and a dilution plating method utilizing PDA with antibiotics gave similar yeast and mould counts. 4
Comparison of the hydrophobic grid membrane filter and BAM methods for the enumeration of fungi from various naturally-contaminated foods.
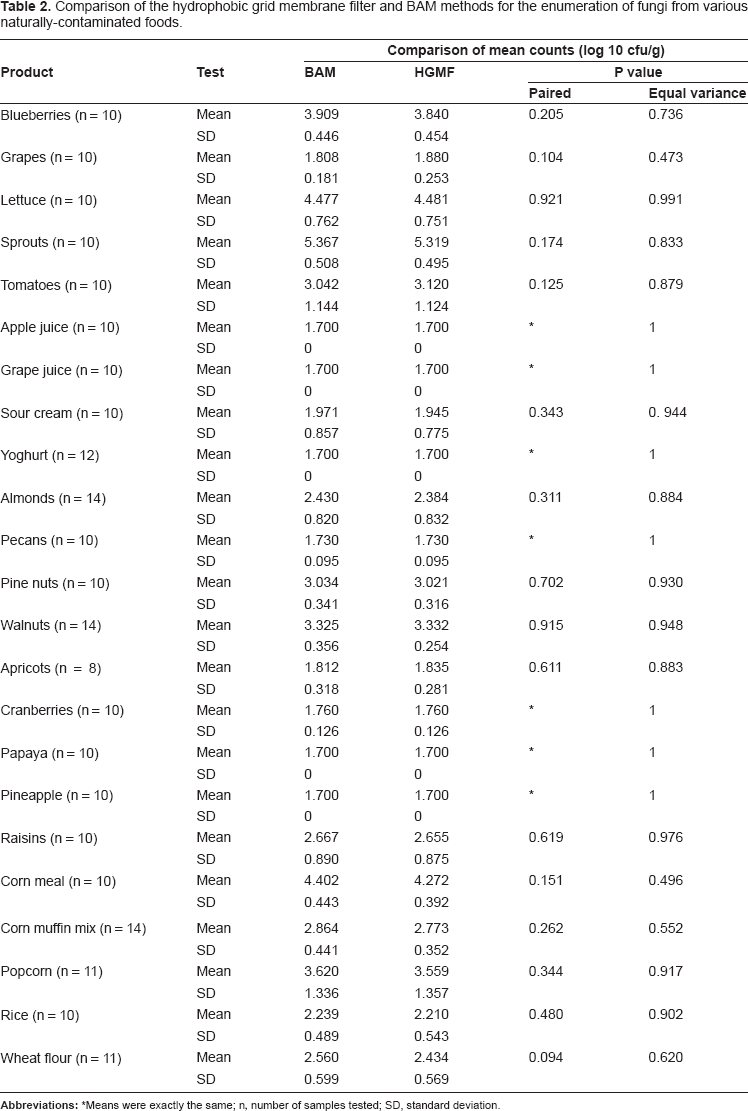
Means were exactly the same; n, number of samples tested; SD, standard deviation.
Correlation coefficients (r) are shown in Table 3. The correlation coefficients for 18 (78%) out of 23 commodities were above 0.90 indicating an excellent correlation between the two methods. Three products (cranberries, corn muffin mix and walnuts) had r values lower than 0.80. Spangenberg and Ingham also reported a high correlation between YM counts obtained for Mozzarella cheese using the ISO-GRID and a conventional method utilizing DRBC agar, 2 while Lin and her coworkers described correlation coefficients of ISO-GRID counts on trypan blue agar and PDA of 0.94 or higher. 5 Regression analysis showed that there was a good fit linear regression (p < 0.05) between the two methods for 17 (74%) out of 23 commodities tested; one product (cranberries) had a p value of 0.2856 indicating a non-linear regression between HGMF and BAM method. For the remaining commodities (apple juice, grape juice, yoghurt, papaya and pineapple), regression analysis could not be performed because all the values obtained by both methods were the same.
Results of linear regression analysis of the YM counts in various commodities (HGMF vs. BAM).
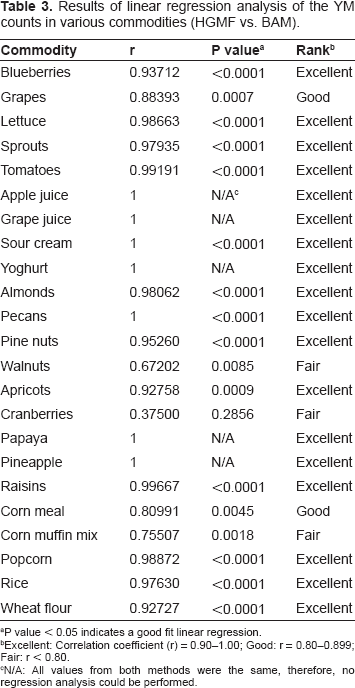
aP value < 0.05 indicates a good fit linear regression.
bExcellent: Correlation coefficient (r) = 0.90–1.00; Good: r = 0.80–0.899; Fair: r < 0.80.
cN/A: All values from both methods were the same, therefore, no regression analysis could be performed.
Although the NEO-GRID HGMF and BAM methods gave similar YM counts, some advantages and disadvantages of both methods were evident. The main advantage of the HGMF method was the short incubation period as compared with the reference (BAM) method. Additionally, this technique had a detection limit of 1.0 × 101 cfu/g, which was 1 log cycle lower than the reference method. This is important when products with microbial specifications lower than 1.0 × 10² cfu/g are analyzed. On the negative side, HGMF needed longer time for preparation of the inoculum and for inoculation because of the prefiltration and filtration steps, and for several products the enzyme digestion step which further delayed the sample set-up; counting was cumbersome when too many colonies were present since the filter is divided into 1600 minute compartments with the hydrophobic grid lines; all mould colonies on HGMF had similar appearance not allowing direct genus identification. Additionally, analysis utilizing HGMF incurred higher expenses than traditional methods due to its requirement for a filtration manifold and costly filter (NEO-GRID) units. When fresh produce samples were tested, the DRBC media (BAM method) failed to inhibit some bacteria, which interfered with the growth of fungi and made counting laborious. That was attributed to the presence of chloramphenicol-resistant pseudomonads; YM-11 agar (HGMF method) contains chlortetracycline which is more efficient in inhibiting such bacteria. 8
Table 4 shows ratings of the two methods based on attributes such as characteristic colony morphology, ease of sample preparation and set up for mycological analysis, ease of colony counting, counting precision, inhibition of bacteria, facilitating growth of most fungi, detection limit, cost of analysis, and possibility of direct partial identification. Each attribute was assigned a score of 1–4. The method with the lower total score was the better performer. As is evident from Table 4, the two methods attained very similar overall scores. The dilution plating (BAM) method had a slightly lower score, rated as the better performer, mainly because of the distinct colony colorations on DRBC and DG18 agar, which aided in the direct identification of fungal genera, while all mould colonies on the HGMF filter were colored grayish and had similar texture, therefore, they were impossible to differentiate.
Decision table for choice of method for the enumeration of fungi in foods.
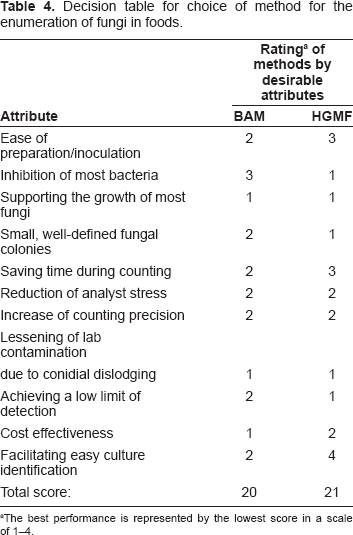
The best performance is represented by the lowest score in a scale of 1–4.
Conclusions
The NEO-GRID HGMF and the BAM dilution plate method gave similar yeast and mould counts for all food products tested in this study. Statistical analysis (t-test) showed no significant differences between the two methods at the 95% level of significance. The HGMF method gave results a lot faster than the BAM method (in about 2 days). Therefore, the NEO-GRID hydrophobic grid membrane filter can be used for mould and yeast quantification when no partial direct identification is required. The latter method would be especially useful for testing of foods with short shelf life. Furthermore, the detection limit achieved by HGMF was 1 log cycle lower than the one attained by the reference method; therefore, use of the HGMF method would be preferable for the analysis of commodities that have microbial limit specifications between 1.0 × 101 and 9.9 × 101 cfu/g.
Publish with Libertas Academica and every scientist working in your field can read your article
“I would like to say that this is the most author-friendly editing process I have experienced in over 150 publications. Thank you most sincerely.”
“The communication between your staff and me has been terrific. Whenever progress is made with the manuscript, I receive notice. Quite honestly, I've never had such complete communication with a journal.”
“LA is different, and hopefully represents a kind of scientific publication machinery that removes the hurdles from free flow of scientific thought.”
Available to your entire community free of charge
Fairly and quickly peer reviewed
Yours! You retain copyright
Footnotes
Acknowledgments
Special thanks are due to Jeffrey Kohn and Eugenia Katsoudas (Office of Regulatory Affairs, FDA) for their constructive remarks during the preparation of the manuscript and to Michael O'Donnell (Center for Food Safety and Applied Nutrition, FDA) for his assistance with the statistical analyses of the data.
The author reports no conflicts of interest.