
Abstract
Animal models of stroke have been crucial in advancing our understanding of the pathophysiology of cerebral ischemia. Currently, the standards for determining neurological deficit in rodents are the Bederson and Garcia scales, manual assessments scoring animals based on parameters ranked on a narrow scale of severity. Automated open field analysis of a live-video tracking system that analyzes animal behavior may provide a more sensitive test. Results obtained from the manual Bederson and Garcia scales did not show significant differences between pre- and post-stroke animals in a small cohort. When using the same cohort, however, post-stroke data obtained from automated open field analysis showed significant differences in several parameters. Furthermore, large cohort analysis also demonstrated increased sensitivity with automated open field analysis versus the Bederson and Garcia scales. These early data indicate use of automated open field analysis software may provide a more sensitive assessment when compared to traditional Bederson and Garcia scales.
Introduction
Stroke is the fourth leading cause of death in the United States, 1 and the leading cause of long-term disability, with ischemic stroke comprising 87% of all subtypes. 2 Animal models of stroke have been crucial in advancing our understanding of the pathophysiology of cerebral ischemia. However, limitations have persisted in the translation of successful animal model findings to human application. As a result, it is worthwhile to work continually to improve available methodologies used in assessing animal models of stroke, particularly the methods to detect and quantify functional recovery in such models.
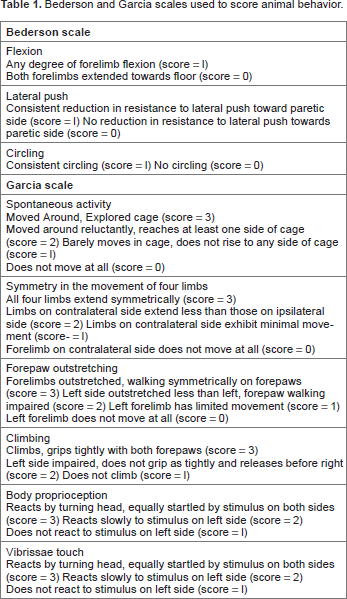
Currently, the standards for determining neurological deficit in rats are the Bederson scale and the Garcia scale,3,4 or modified versions of the two. Both exams score animals based on parameters that are ranked on a narrow ordinal scale of severity (Table 1). However, there may be a number of limitations to these scales. Namely, as ordinal systems, they lack a fine gradation, creating the need to evaluate interventions across large numbers of animals or potentially limiting the detection of subtle or more nuanced injuries. Furthermore, they rely on the subjective opinion of the observer, allowing the possibility of bias to enter into the analysis.
Bederson and Garcia scales used to score animal behavior.
Sophisticated technology may be used to automate the analysis of neurological injury, and thereby increase the sensitivity of such analysis and remove the potential for observer bias. Software applications such as EthoVision XT (Noldus Information Technology Inc., Leesburg, VA) have become popular as viable options for easy and reproducible animal assessment. EthoVision is a live-video tracking system that can both record and analyze animal behavior, movement, and activity with the use of automated parameters. It has been used to study locomotor activity, 5 depression, 6 memory deficit, 7 social interaction, 8 stress,9,10 drug conditioning, 11 anxiety 12 and metabolism. 13 EthoVision XT has been used across several species of rat,14–17 mouse,18–21 zebrafish22–25 and can be adapted for the Morris Water Maze, 26 novel object recognition, 15 open field activity, 17 elevated plus maze, 27 Barnes maze, 28 T maze, 29 and Optogenetics. 30 However, to our knowledge, there are no studies that describe behavioral outcomes using EthoVision XT in an ET-1 stroke model; nor have there been studies comparing the sensitivity of the Bederson 3 and Garcia 4 neurobehavioral exams with EthoVision XT automated digital analysis system.
We examine the manual and digital assessments for their ability to measure neurological deficit in a small cohort of animals following ET-1 induced stroke.
Methods
Animals
Seven-week-old male Sprague Dawley rats (n = 3) were purchased from Charles River Farms (Wilmington, MA) and housed under standard laboratory conditions with free access to standard rat chow/water. All procedures and experiments were approved by the Vanderbilt University Institutional Animal Care and Use Committee, and Guidelines for the Care and User of Laboratory Animals published by the US National Institutes of Health were followed.
Stroke surgery
Rats underwent an intracranial placement of a guide cannula, followed by induction of Middle Cerebral Artery Occlusion (MCAO) using Endothelin-1 (ET-1) as previously described. 31 Briefly, rats were anesthetized with 5% Isoflurane and maintained under 2% Isoflurane in a stereotaxic frame (Stoelting Co, Wood Dale, IL) for the duration of both procedures. For the cannula, a midline incision was made to expose the skull, and a stainless steel guide cannula was implanted into the right hemisphere using the following stereotaxic coordinates [+1.6 mm anterior, +5.2 mm lateral, –4.5 mm ventral relative to Bregma]. After three days of recovery, the rats underwent MCAO by infusing 3 μL of 80 μmol (1 μL/minute) ET-1.
Bederson and Garcia Behavioral Assessments
To evaluate neurological outcomes after induced ischemia, the Bederson and Garcia behavioral assessments were performed prior to and 24 hrs after stroke. All assessments were performed as part of a lab team member's usual duties for our stroke research lab, with no knowledge that these scores were to be compared to an alternative method of assessment. Assessments were performed as previously described. 31 Briefly, rats were evaluated and given deficit scores based on parameters including spontaneous activity, symmetry of movement and outstretch of limbs, circling behavior, climbing ability, body proprioception, and vibrissae touch. The Bederson exam is scored on a scale from 0 to 3, and the Garcia exam on a scale from 3 to 18.3,4
Automated Open Field Assessments
Locomotor activity was continuously tracked via the center point, nose point, and tail base of the animal. Rats were video recorded in the Noldus Phenotyper cage for 2 hours pre- and 24-hrs-post-stroke with ad libitum access to food and water. The Phenotyper cage was divided into 'zones’ using the software. Separate zones were created for the water spout area and feeder tray area, as well as the four walls of the cage for rearing frequency. Data was analyzed using EthoVision XT software, using the following parameters: distance moved (distance travelled (cm) by defined body point), velocity (maximum distance travelled per unit time (cm/s)), pre-stroke counter clockwise rotation (CCW) versus clockwise rotation (CW) (number of 360 degree turns to the left versus 360 degree turns to the right made during recording period) and post-stroke CCW versus CW rotations, nose at water spout frequency (number of times nose point enters defined water spout zone during recording period), nose at feeder tray frequency (number of times defined nose point enters defined feeder zone during recording period), rearing frequency (number of times defined body point enters defined wall zones during recording period), and meander (tortuous/winding movement (degrees/cm)).
Infarct Size Quantification
To confirm presence of stroke, animals were sacrificed at 24 hours post stroke and tissue infarct was determined by staining 2 mm coronal sections with 3,5-triphenyltetrazolium chloride (TTC). Infarct size was quantified using Image J software as previously described. 31
Large Cohort Analysis
To further evaluate the potential value of automated open field analysis, a second cohort of 10 animals was subjected to stroke and subsequent analysis. These analyses were undertaken to confirm the consistency of the findings of the small cohort in a larger cohort, as well as to evaluate the results over a 48-hour period.
Data Analysis
All statistical analysis was performed using the Student's t-test.(small cohort) or ANOVA with a post hoc Tukey's test (large cohort). The analyses were done with GraphPad Version 5.0d (GraphPad Software, Inc. La Jolla, CA, USA). Mean values are reported as mean ± SD. A P value of less than 0.05 was considered to be significant and is indicated on subsequent graphs with an asterisk.
Results
Bederson and Garcia Neurobehavioral Assessments
Animals were assessed manually using the Bederson and Garcia scoring scheme prior to ET-1 infusion and again at 24 hours post ET-1 infusion. Figure 1A shows the Bederson Score for pre- and post-stroke animals (0 and 1.2 ± 0.8), and Figure 1B shows the Garcia Scores for pre- and post-stroke animals (18 ± 1 and 14 ± 4). Although functional deficit was evident with each of the evaluations, there was no statistical significance using either behavior scale.

Bederson and Garcia Behavior Scores. (
Automatic Open Field Assessments
Figure 2 shows a representative track plot of an animal pre-stroke (Fig. 2A) and post-stroke (Fig. 2B). The turquoise path delineates the nose, red delineates the center of the animal and purple delineates the tail base of the animal. Qualitative visual inspection of the tracks created by the animals before and after stroke indicated that animals displayed a healthy exploratory behavior prior to the stroke in an open field, and a substantial decrease can be seen in the exploratory activity post-stroke, with activity that once comprised the entirety of the Phenotyper cage becoming limited to circling in the top-left and bottom-left corners of the arena. Closer inspection of the track plots also indicates the frequency of the nose spout at the feeder and water tray pre-stroke. Post stroke, however, the representative animal's nose was not recorded in the feeder or the water zone.

Automated Open Field Analysis Track Plots. Animals were placed in an open field and allowed to explore and move around in the cage. Animal behavior and movement patterns were recorded and analyzed using Ethovision XT software. The software tracked the nose (turquoise), center-point (red) and tail base (purple) of each animal. Visual representation of locomotor activity of a representative pre-stroke (
The distance and velocity of the animals’ movements were quantified as an assessment of mobility. After stroke, there was a significant decrease in the distance moved (pre-stroke, 3861 ± 752 cm versus post-stroke, 1411 ± 348 cm) as well as the velocity (pre-stroke, 102 ± 9 cm/s versus post-stroke, 63 ± 7 cm/s) (Fig. 3).

Total distance moved and the velocity following stroke. Animals were placed in an open field and allowed to freely move around. Ethovision XT software was used to determine the total distance moved by each animal in cm and their maximum velocity in cm/s. (
Prior to stroke, the frequencies with which the animals walked in a circular motion, either to the paretic left, CCW 13 ± 2 or the right, CW 15 ± 4, are comparable and not significantly different (Fig. 4A). However, in addition to a considerable decrease in overall frequency of rotational movement, post-stroke animals had a significant increase in the ratio of CCW:CW rotation, 5 ± 2 versus 2 ± 0.5 (Fig. 4B).

Counter clockwise (CCW) and Clockwise (CW) rotation frequency. Animals were placed in an open field and allowed to freely move around. The frequency of CCW and CW movement was recorded using Ethovision Xt software. (
The nose point of the animals was defined to track their eating and drinking habits throughout the duration of recording. There was a large reduction in the amount of time animals spent at both the water spout (Fig. 5A; pre-stroke, 1411 ± 348, and post-stroke, 0.6 ± 1) and the feeder tray (Fig. 5B; pre-stroke, 62 ± 11, and post-stroke: 23 ± 11).
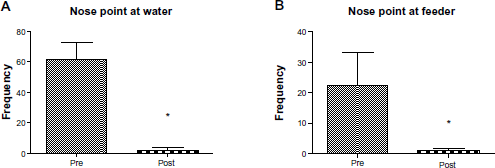
Frequency of nose point detected at water spout and feeder tray. To assess eating and drinking behavior, the presence of the animals’ nose at either the water spout or the feeder tray was recorded. (
As an indicator of the animals’ spontaneous activity, rearing frequency and meandering were also measured. Post-stroke, animals were significantly less likely to rear up to the walls, 1+2, when compared to pre-stroke rearing frequency, 10 ± 3 (Fig. 6A). Conversely, meandering, defined as tortuous/winding movement, was significantly increased in animals post-stroke (15 ± 18 degrees/cm) versus pre-stroke (60 ± 4 degrees/cm) (Fig. 6B).

Pre- and post-stroke frequencies of animals rearing up to the walls of the cage, and frequencies of animals changing directions relative to their distance moved (meander). (A) Post-stroke, the rearing frequencies were significantly lower than pre stroke. (B) Post-stroke animals exhibited a higher degree/cm of meander behavior.
Infarct Volume
The presence of white, non-stained (infarcted) tissue in right cortex and striatum confirmed successful ET-1 induced ischemia (62 ± 21%) in all of the animals (Fig. 7).

Pre- and post-stroke infarct volume. The presence of white, non-stained (infarcted) tissue in the right cortex and striatum confirmed successful ET-1 induced ischemia in all of the animals. (
Confirmation of Automated Open Field Assessments
Analysis of the larger cohort over more delayed time points demonstrated continued increased sensitivity in comparison to the traditional scales, and this sensitivity persisted at 48 hours. Results for the larger cohort are listed in Table 2.
Results for manual and automated field assessments for a larger cohort of animals (n = 10).

P < 0.05.
Discussion
Here we compared the effectiveness of the widely used Bederson and Garcia scales with that of a fully automated video-tracking system with analysis software to measure neurological deficit post-stroke in a small cohort of animals. Open field visual tracking records locomotor activity continuously by tracking the center point, nose point, and tail base of the animal. The basic setup includes the software, a firewire camera and a computer for recording the behavior and analysis, and can also be used with a top unit that contains an infrared sensitive camera to record behavior at night. The cage is made of translucent acrylic sheets with ventilated walls allowing the researcher to visibly inspect the animal with minimal disturbance. This avoids the overhandling of already very agitated animals, which can complicate traditional scoring methods. Once a video is recorded, additional parameters can be added to the analysis software without having to re-record an animal.
While there is some controversy as to the optimal time point for evaluating infarct size, many studies have shown that peak infarct volume occurs 24 hours after stroke, according to TTC staining.3,32 It is also known that some of the sensorimotor deficits scored using manual assessments are quickly reduced through spontaneous recovery soon after stroke. 32 For this reason, we chose to analyze data at 24 hours post-stroke. To confirm the presence of stroke, infarct volume was confirmed with TTC staining of brain sections.
The results obtained from the Bederson and Garcia scales did not show significant differences between pre- and post-stroke assessments (Fig. 1). This appears to be primarily due to the small cohort of animals (n = 3). Although these assessments are well established as a tool to detect stroke injury across treatment groups, the cohort size typically used in the literature for each are approximately 10 animals.3,4,33–36 The relatively narrow score range of both assessments limits their sensitivity and potentially limits the ability to detect differences, particularly across small cohorts. Using the same small cohort (n = 3), the open field video tracking system picked up significant differences between the pre- and post-stroke assessments. While we do not intend to imply that three animals is sufficient for most stroke intervention investigations, we do hope to draw attention to the potential increase in sensitivity evident with using the automated open field analysis. This increased sensitivity may allow consistent evaluation with smaller cohorts of animals (∼6) and/or allow an improved ability to detect differences in subtler stroke models.
Focal ischemic insult has been shown to induce sensorimotor deficit, 37 and our study was in agreement as the total distance moved post-stroke was significantly lower, as was the maximum velocity with which the animals moved (Fig. 3). In addition, Shen et al showed that the size of the infarct directly correlated to the vertical locomotor and body symmetry of Sprague Dawley rats. 37 Their study showed that post-stroke there was a significant reduction in the distance travelled by the rats and this strongly correlated with the size of the infarct in the brain. Grabowski et al also showed that paw placement test scores correlated strongly with infarct volume. 38 Both of these studies show a locomotor deficit following stroke. However, they used 49 and 63 animals, respectively. In addition, they either used an infrared beam break system to record the locomotor activity or had to pre-train animals, which is lengthy and tedious. A significant benefit of the automated open field analysis is the fact that no pre-training is required. Figure 4 shows that pre-stroke animals walked counter-clockwise as often as they did clockwise, and post-stroke, the animals were biased towards counterclockwise (CCW) rotations. A unilateral stroke causes neurological deficits on the contralateral side, 39 resulting in increased usage of the less impaired side, 40 leading to the CCW rotation. Stroke impacts control of paretic leg and thus modulation of muscle activity patterns.41,42 The lack of muscle control also contributes to either a counter-clockwise or clockwise circling pattern.
Under-nutrition following stroke was first reported by An et al, 43 and subsequently, Choe et al showed that under-nutrition also contributes to muscle atrophy post stroke. 44 In our study, zones were pre-defined around the water spout and the feeder tray to record the frequency with which the animal was detected in these zones. Figure 5 demonstrates that the frequency of the nose point recorded at either the water spout or the feeder tray was significantly higher pre-stroke and lower post-stroke. In addition, the representative track plot in Figure 2 indicates that the animal did not go near the water spout or the feeder tray during the recording session post-stroke. However, the frequency of the nose point detected within the water spout zone or feeder tray zones does not confirm whether the animal actually drank water or ate any pellets from the feeder tray. The phenotyper cage used for this study was not equipped with a pellet dispenser or a lickometer; the pellet dispenser delivers single food pellets and records when a food pellet is dropped and when the silo is empty, and the lickometer detects and records contact made between the animal and the water bottle spout.
Furthermore, while the initial design of this investigation was to evaluate the benefits of open field visual tracking in detecting differences in a small cohort, an additional larger cohort (n = 10) of animals was evaluated to confirm the small cohort findings and to evaluate the progression of deficit detection over a longer post-stroke time period. Assessments were performed at pre-, 24 hours post- and 48 hours post-stroke. In the larger cohort of animals, the Garcia behavior score showed significance at 24 hours post-stroke, but returned to non-significance at 48 hours. The Bederson behavior score did not show significance at either 24 or 48 hours post-stroke. All of the measured parameters for the open field assessment were significant at 24 hours post stroke. Interestingly, at 48 hours post stroke some of the parameters showed recovery (velocity, CCW:CW rotation, rearing frequency and meandering). The ability of the open field assessment to discriminate between numerous functional parameters appears to provide additional value for investigations evaluating delayed stroke recovery.
An animal placed in an open field or cage tends to have vertical exploration, known as rearing. To measure rearing frequency, an animal is placed in an open field and observed, for a period of time as brief as 5 minutes 45 or as long as 60 minutes. 46 The number of times the animal rears on the cage walls is manually recorded within the time allotted for the study. The cylinder test has also been used for the same behavior scoring; however, the cylinder test requires pre-training of the animals. 47 In this study, the automated open field analysis software was adapted to record the nose point and the center of the animal on any of the four walls of the cage during the recording session. In addition to those previously mentioned, several other standard and manually defined scored events can be analyzed using this system, including light/dark cycle behavior (circadian rhythm studies), transition of animal to different zones, amount of time spent in each zone, total mobility and immobility duration, activity state of animal, time spent in the periphery or center of the cage, time spent with body elongated or contracted, latency to enter defined zones, head direction, turn angle and even social behavior between animals after stroke.
Open field video tracking is relatively easy to use and a plethora of data can be obtained from a single recording. Furthermore, the lower number of animals required per cohort may offset the start-up costs of the software and phenotyper cages. The software has already been used with intraluminal filament models of stroke, mostly to record animals during Morris Water Maze activity.48,49 However, to our knowledge, this paper is the first not only to describe the use of automated open field analysis to measure neurological deficit in the ET-1 model of cerebral ischemia, but the first to compare its effectiveness with that of the traditional manual neurobehavioral assessments. The Bederson and Garcia scales are well established and extremely useful, and we do not seek to imply they aren't. We only hope to draw attention to the point that there may be benefits to using digital analysis in experimental stroke evaluation.
Conclusion
Compared with the Bederson and Garcia scales, automated open field analysis, with its hands-off approach to behavior assessment, no pre-training, and its objective computer-based scoring, is able to generate quality quantitative data using parameters that are specifically defined to detect and significantly differentiate abnormalities and deficits associated with experimentally induced stroke.
Author Contributions
Conceived and designed the experiments: FD, AA, ZW, JM. Analyzed the data: FD, AA, ZW, JM. Wrote the first draft of the manuscript: FD, AA. Contributed to the writing of the manuscript: FD, AA, ZW, JM. Agree with manuscript results and conclusions: FD, AA, ZW, JM. Jointly developed the structure and arguments for the paper: FD, AA, ZW, JM. Made critical revisions and approved final version: FD, AA, ZW, JM. All authors reviewed and approved of the final manuscript.
Disclosures and Ethics
As a requirement of publication the authors have provided signed confirmation of their compliance with ethical and legal obligations including but not limited to compliance with ICMJE authorship and competing interests guidelines, that the article is neither under consideration for publication nor published elsewhere, of their compliance with legal and ethical guidelines concerning human and animal research participants (if applicable), and that permission has been obtained for reproduction of any copyrighted material. This article was subject to blind, independent, expert peer review. The reviewers reported no competing interests.