
Abstract
We have analysed the efficiency of all mitochondrial protein coding genes and six nuclear markers (Adora3, Adrb2, Bdnf, Irbp, Rag2 and Vwf) in reconstructing and statistically supporting known amniote groups (murines, rodents, primates, eutherians, metatherians, therians). The efficiencies of maximum likelihood, Bayesian inference, maximum parsimony, neighbor-joining and UPGMA were also evaluated, by assessing the number of correct and incorrect recovered groupings. In addition, we have compared support values using the conservative bootstrap test and the Bayesian posterior probabilities. First, no correlation was observed between gene size and marker efficiency in recovering or supporting correct nodes. As expected, tree-building methods performed similarly, even UPGMA that, in some cases, outperformed other most extensively used methods. Bayesian posterior probabilities tend to show much higher support values than the conservative bootstrap test, for correct and incorrect nodes. Our results also suggest that nuclear markers do not necessarily show a better performance than mitochondrial genes. The so-called dependency among mitochondrial markers was not observed comparing genome performances. Finally, the amniote groups with lowest recovery rates were therians and rodents, despite the morphological support for their monophyletic status. We suggest that, regardless of the tree-building method, a few carefully selected genes are able to unfold a detailed and robust scenario of phylogenetic hypotheses, particularly if taxon sampling is increased.
Introduction
Different topologies may be obtained for the same set of organisms when different genes, models and methods are used to reconstruct the phylogeny.1,2 Once regarded as a weakness of molecular phylogenetics, the relative independence of molecular markers is now regarded as an important asset, enabling consistency tests on molecular based topologies.3,4
In spite of the positive aspects, however, multiple markers inconsistency does represent a problem with actual data.5–8 The overwhelming and rapidly accumulating amounts of molecular data have just scratched the surface of the problem. 9 It is clear that different genes present distinct probabilities of efficiently recovering the correct tree and that a careful marker selection has been shown to be more important than the choice of a tree-building method.1,10 The longer the alignment, for instance, the lower is the sampling error.6,7 Also, a single gene tree may differ from the species tree, which is more likely the result of a multi-marker analysis. On the other hand, systematic errors tend to increase with sequence length 9 and evolutionary model selection becomes a far more complex issue7,11,12 in a multi-marker analysis.
While computer simulations have extensively addressed tree-building method reconstruction, 13 marker efficiency may only be estimated by the use of known evolutionary trees.1,2,10 In fact, if the amount of fossil, morphological and molecular data that support a particular topology is overwhelming, it becomes possible to assume it to be known. In these cases, efficiency of markers may be estimated for different taxonomic groups and the most efficient markers should be useful to unveil unknown evolutionary relationships in the group.
Previous known-tree studies have already tested the efficiency of genes and tree-building methods,1,14 but most analyses were restricted to either mitochondrial or to nuclear genes, precluding comparisons between genome efficiencies. Nuclear genome is passive of recombination during sexual reproduction and, hence, nuclear markers are truly independent in a way that mitochondrial genes are not. 7 Mitochondrial genes, on the other hand, do not present paralogy-related problems and thus comparisons between genomes will be informative for phylogeneticists. A recent analysis included mitochondrial and nuclear genes, but only Bayesian Inference methods were tested. 10
In this work, we have evaluated the efficiency of genes and tree-building methods in recovering a known amniote phylogeny (Fig. 1). We have tested the efficiencies of nucleotide sequences of both nuclear and mitochondrial genes and UPGMA, neighbor-joining, maximum parsimony, Bayesian Inference and maximum likelihood methods of phylogenetic inference.
Known amniote phylogeny used to test tree-building methods and nuclear and mitochondrial markers to recover this topology.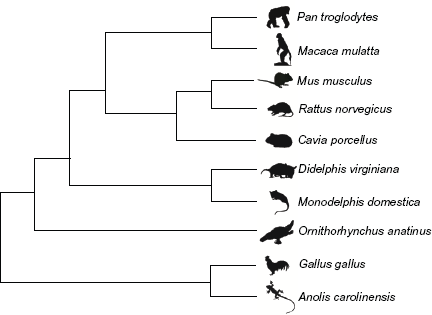
Materials and Methods
Nucleotide sequences were downloaded for ten vertebrate taxa for which evolutionary relationships were consensual and well established by the fossil record, morphological data and molecular studies. These are Anolis carolinensis, Cavia porcellus, Didelphis virginiana, Gallus gallus, Macaca mulatta, Monodelphis domestica, Mus musculus, Ornithorhynchus anatinus, Pan troglodytes and Rattus norvegicus. Our known phylogeny was established based on multiple and independent lines of evidence. The sister group status, for instance, between squamates (Anolis lineage) and birds (Gallus lineage), and their relationship to mammals are universally supported by paleontological, morphological and molecular data.15–19 Conversely, the relationship between Monotremata (Ornithorhynchus lineage) and the remaining mammals (clade Theria) is also evident by various studies.20–24 Monophyly of didelphid marsupials (Monodelphis and Didelphis) and their relationship to placental mammals are supported by evidence.24,25 The monophyletic status of primates and rodents has been widely sustained by several types of data.21,24,26–29 Even though we acknowledge the fact that uncertainties are always pertinent to any given phylogenetic hypothesis, overwhelming evidences such as those provide a very strong case for the tree topology assumed for this work.
Thirteen mitochondrial (Atp6, Atp8, Cox1, Cox2, Cox3, Nd1, Nd2, Nd3, Nd4, Nd4l, Nd5, Nd6 and Cytb) and six nuclear (Adora3, Adrb2, Bdnf, Irbp, Rag2 and Vwf) genes were used in our analysis. Nuclear genes were selected based on the number of sequences available at GenBank. Other nuclear markers were tested but discarded due to unreliable alignments. All protein coding mitochondrial genes were included in our analyses. Since sequences may have not been available for all species in sequence data banks, not all phylogenetic groups were tested for all markers. For GenBank access numbers, see Supplementary Material 1.
Nucleotide number of each mitochondrial and nuclear genes and Rattus vs. Didelphis distance values for all genes evaluated.

The decision to analyze nucleotide sequences only was based on the fact that they tend to outperform amino acid sequences due to their three-fold advantage in number. 5 Even though they are expected to display a large amount of noise, third codon positions contain informative signal for phylogenetic tree reconstruction 30 and were included in our analyses.
Nucleotide sequences were aligned based on translated amino acid sequences using ClustalW. 31 After alignment, editing removed poorly aligned flanking regions. In order to evaluate the effect of gene conservativeness, pair-wise proportion of different residues (p-distance) was calculated between all sequence pairs (see Supplemental Material 2).
Phylogenetic trees were reconstructed using the Mega 4 32 software for UPGMA, 33 neighbor-joining (NJ) 34 and maximum parsimony (MP),35,36 with default parameters. Both UPGMA and NJ methods are distance based tree-building methods and selected distance model were: proportion of differences, Jukes-Cantor (JC) 37 and Kimura 2-parameters (K2P). 38
In the case of MP topology search, three different algorithms were used: the (max-mini) branch and bound and two types of heuristic searches. A core tree with three taxa selected for the largest number of steps starts the algorithm. Taxa addition hence continues and, at each step, the number of steps is calculated until it exceeds that of a previously reconstructed tree and all derived trees are ignored. All possible pathways are evaluated. While branch-and-bound algorithms guarantees that all MP tree will be found, this is not the case for heuristic searches. Two heuristics MP algorithms were applied to our dataset: close neighbor interchange (CNI) and min-mini. In the first case, the trees that differed from the provisional tree by 2 and 4 steps are examined, and this search is repeated until there is no remaining tree with a smaller length size. The min-mini algorithm is similar to branch-and-bound in what concerns the initial core tree of three taxa, but the order of taxon addition differs from the former as the taxon chosen for the next step of taxon addition is the one with the minimum of all minimum values. The aim is to reach the MP or a suboptimal MP tree relatively quickly.
Maximum likelihood trees, on the other hand, were computed with the on line version of PhyML. 39 In this case, the probability of a certain topology, given alignment and model (ie, likelihood), is computed for each possible tree. The ML tree shows the highest likelihood. ML algorithm is a discrete character method, but, as in UPGMA and NJ, an evolutionary model must also be selected.
In the ML case, BioNJ was chosen as the initial and topology searches were based on Nearest-Neighbor-Interchange and Subtree Prunning and Reconnecting heuristic algorithms. Hasegawa-Kishino-Yano (HKY), Tamura-Nei (TN) and GTR evolutionary models were implemented. It has been shown that more sophisticated models do not necessarily yield better topologies. 40 ML methods, however, are not as vulnerable to large variances 32 and over-parameterization as distance methods.9,41
Bayesian analyses were performed using Mr. Bayes software 42 as estimated by Monte Carlo Markov Chain (MCMC). Analyses were found to be robust, since mean standard deviations were not higher than 0.01 after 100.000 generations. As in ML, more complex substitution models, JC69, HKY and GTR, were selected for analyses. Bayesian posterior probabilities were estimated.
The reliability of each tree was measured using the bootstrap test 43 with 100 replicates. 44 We have summarized the vast amount of phylogenies reconstructed by calculating the number of nodes that have recovered such partitions. Separate values were estimated for correct and incorrect partitions so that overall efficiencies of markers and genes may be evaluated. Also, since in phylogenetic studies branches with low statistical support are seldom considered, we have included results for correct and incorrect branching patterns with bootstrap values over 90. If sequences were not available for the test, values were removed from the total.
Even though it is a reliable test, 44 the phylogenetic bootstrap test does not yield the probability of a given partition being on the true tree (ie, accuracy), but it actually tests the probability of recovering the same partition given an independent data set (ie, repeatability).43,45 It is shown, for instance, that a high bootstrap value itself does not indicate that the grouping is correct due to systematic errors.2,9 Also, bootstrapped data need to be independent and identically distributed (iid) which is probably not the case for sequence data. 46 Nonetheless, since test results are usually interpreted this way in literature it is useful to understand properties of the test regarding this issue.
Results
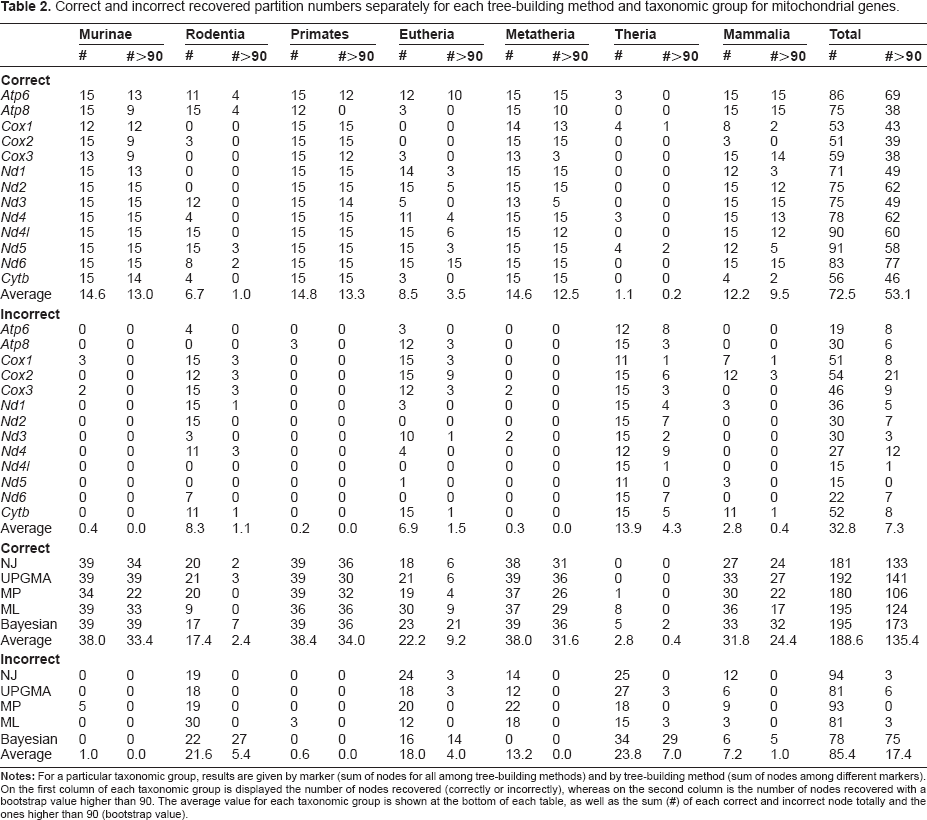
Correct and incorrect recovered partition numbers separately for each tree-building method and taxonomic group for mitochondrial genes.
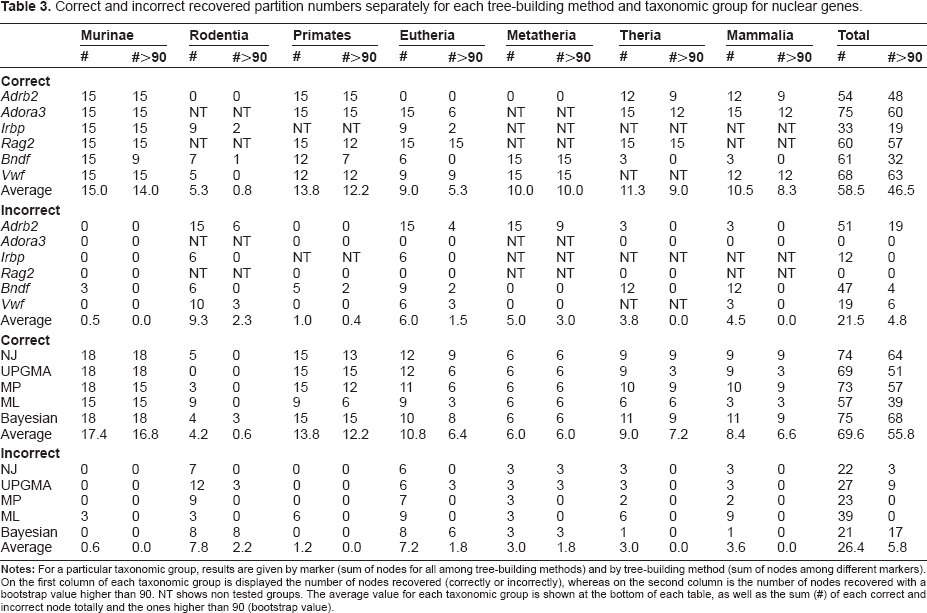
Correct and incorrect recovered partition numbers separately for each tree-building method and taxonomic group for nuclear genes.
Tree building methods
When mitochondrial genes are used (Table 2), ML and Bayesian show the overall highest number of correct nodes (195 CB, correct branches), but if analysis is restricted to significant (BP > 90) nodes, Bayesian outperforms other methods (173 SCB, significant correct branches), followed by UPGMA (141 SCB). If incorrect recovered branches, however, are examined, Bayesian again (78 IB, incorrect branches) perform best. ML and UPGMA also show high efficiency (both 81 IB) with poor support for incorrect branches. In the Bayesian analysis, however, incorrect branches are often significantly supported as theoretically expected. 47 MP is the only tree-building method that shows no significantly supported incorrect branches. For nuclear markers (Table 3), as observed for mitochondrial genes, Bayesian method seems to surpass others considering the total number of correct branches (75 CB) and the number of significant correct branches (68 SCB). Taking into account the incorrect branches, Bayesian analysis also performs better (21 IB), but again, they were highly supported by significant nodes. Only MP and ML, show no significantly supported incorrect branches for nuclear markers.
Bayesian approaches were introduced into phylogenetics in the mid-1990s, but became very popular during the 2000′s. 42 In spite of the high efficiency in recovering and supporting correct branches in this study, the higher values also correspond to incorrect partitions, indicating that the posterior probability are higher than bootstrap values, whether the node is correct or incorrect as suggested by simulations. 48
The high efficiency observed of the neglected UPGMA method is somewhat surprising. This tree-building method is hardly ever used in phylogenetic studies due to its high dependence on molecular clock assumptions. 51 It has been shown, however, that, when variances are high, UPGMA algorithm does yield a good tree solution reconstruction for microsatellite data. 52 It might be considered that, in some cases, the evolutionary time between the two divergent markers is so long that the evolutionary rates have been equalized, creating an artificially constant substitution rate. 53
Furthermore, simulations have shown that ML is robust to model violations 54 that it tends to outperform NJ and MP on the Felsenstein zone, that is, when long branches are on the opposite sides of an interior node. 54 Nevertheless, ML might not perform as well at the anti-Felsenstein zone, ie, where long branches are neighbors. 11 Under realistic parameters Bayesian analysis has been shown highly support incorrect clades and to be susceptible to Long-branch attraction.48,49 Such points might explain our results in which differences among methods were very small. 1
Markers and genomes
Among mitochondrial markers (Table 2), Nd5 (91 CB), Nd4l (90 CB) and Atp6 (86 CB) perform best considering number of correctly recovered branches whereas Nd6 (77 SCB) and, again, Atp6 (69 SCB) yielded the highest number of significant ones. If incorrect branches are considered, again, Nd4l has the lead, together with Nd5 (both 15 IB). These mitochondrial markers also exhibit no significantly supported incorrect branches.
Comparing nuclear genes (Table 3), Adora3 shows the highest number of correct partitions (75 CB) recovered, but Vwf exhibits the largest number of significant partitions (63 SCB). Adora3 and Rag2 shows no incorrect branch recovered and Adrb2 performed poorly with 19 significant incorrect branches. Mitochondrial and nuclear results are, in fact, comparable since the same number of tree-building methods and models were used in all alignments regardless of the genome.
Discussion
Examining our results, it is clear that nuclear markers do not necessarily show a better performance than mitochondrial genes. 55 Also, we would have expected a higher dependence on the efficiency among mitochondrial genes results when compared with efficiencies among nuclear genes, but our results show differently. Also surprising is the lack of correlation between gene size and gene efficiency that has been shown in previous known tree studies. 1
When recovered groups are considered, both mitochondrial and nuclear markers were quite efficient recovering murines, primates, metatherians, and mammals. Rodents, eutherians, and therians, on the other hand, presented much lower recovery rates. Our results show that therians (ie, the branching of mammals excluding monotremes) was the most difficult group to recover as a clade.
For mitochondrial markers, ML (8 CB), Bayesian (5 CB) and MP (1 CB) and markers Atp6 (3 CB), Cox1 (4 CB), Nd4 (3 CB) and Nd5 (4 CB) were able to recover it. Topologies for all mitochondrial markers, with the Nd5 exception, included statistically supported branches that broke therian monophyly. Also, in all mitochondrial based phylogenies, therian monophyly was only significantly supported using the Bayesian method.
Conversely, the nuclear markers Adora3 and Rag2 recovered therians as a clade for all tree building methods and models. Only Adrb2 trees presented nonsignificant breakage of therian monophyly. Therian rupture was usually due to the grouping of marsupials and monotremes, known as the Marsupionta hypothesis.
A closer relationship between monotremes and marsupials has been proposed 36 and had some morphological support in the past.56,57 Nevertheless, morphological characters recorded to support Marsupionta, such as the columnar stapes and number of thoracolumbar vertebrae, are now thought to be primitive features, found in many early mammals and even in advanced cynodonts. 20 Today, there is little doubt that both Metatheria plus Eutheria constitute a monophyletic group, as indicated by a number of shared synapomorphies, including large stylar cusps A, an extensive conular region in the upper molars and hypoconulid from the ultimate lower molar tall and sharply recurved. 23 Monophyletism of Theria seems also to be supported by other molecular data.21,22,24
The other group that was hard to recover was rodents. In that case, however, issues were not as drastic since mitochondrial Atp8, Nd4l and Nd5 presented no incorrectly recovered branch for the group. On the other hand, in the trees reconstructed with Cox1, Cox3, Nd1 and Nd2 markers, rodents were non-monophyletic for all tree-building methods.
Rodent monophyly has been the focus of many studies,58–60 but morphological bases of the natural status of Rodentia are very well established. 21 Morphological characters that support the monophyly of Rodentia include the presence of a single pair of (upper and lower) enlarged and ever-growing incisors, incisor enamel restricted to the outer surface, absence of canines, P1/p1, and p2, creating a diastema between incisors and cheek teeth, presence of a long and shallow mandibular fossa, relative deep and short horizontal ramus of the mandible, reduced coronoid process and expanded angular process, among others. 61 Also Rodentia monophyly is corroborated by recent and more comprehensive molecular studies,26–29 and contradictory results are now largely attributed to a case of long-branch attraction. 62 Besides, a putative reason for the non-monophyletism is that Muridae nucleotide sequences evolve at higher rates, with a large number of substitutions due to the short generation time. 63 It has been suggested that this problem may be solved with a larger taxon sampling. 64
Recent studies tend to use as many markers as possible but taxon sampling and markers are inversely correlated. Also, the variance is small for larger data-sets, increasing the odds in having statistically supported contrasting phylogenies among markers. 65 Hence, a few carefully selected genes with increased taxon sampling may be better to unfold a detailed and robust phylogenetic scenario. 66 Naturally, marker choice must take into account the taxon sampling and intrinsic marker limitations, but nature, ie, mitochondrial or nuclear, seems to bear no significant difference on marker performance.
Author Contributions
Conceived and designed the experiments: CAMR. Analysed the data: JL-F, CAMR, FAP. Wrote the first draft of the manuscript: JL-F, CAMR. Contributed to the writing of the manuscript: JL-F, CAMR, FAP. Agree with manuscript results and conclusions: JL-F, CAMR, FAP. Jointly developed the structure and arguments for the paper: JL-F, CAMR, FAP. Made critical revisions and approved final version: JL-F, CAMR, FAP. All authors reviewed and approved of the final manuscript.
Funding
The authors wish to thank FAPERJ (Rio de Janeiro State Research Foundation) and CNPq (Brazilian National Research Council) for research grants that enabled this study.
Competing Interests
Author(s) disclose no potential conflicts of interest.
Footnotes
Supplementary Materials
Supp 1. GeneBank accession numbers of mitochondrial and nuclear genes for each taxonomic group.
Supp 2. Pair-wise proportion of different residues (p-distance) between all sequence pairs.
As a requirement of publication author(s) have provided to the publisher signed confirmation of compliance with legal and ethical obligations including but not limited to the following: authorship and contributorship, conflicts of interest, privacy and confidentiality and (where applicable) protection of human and animal research subjects. The authors have read and confirmed their agreement with the ICMJE authorship and conflict of interest criteria. The authors have also confirmed that this article is unique and not under consideration or published in any other publication, and that they have permission from rights holders to reproduce any copyrighted material. Any disclosures are made in this section. The external blind peer reviewers report no conflicts of interest.