
Abstract
Information on multiple synteny between plants and/or within a plant is key information to understand genome evolution. In addition, visualization of multiple synteny is helpful in interpreting evolution. So far, some web applications have been developed to determine and visualize multiple homology regions at once. However, the applications are not fully convenient for biologists because some of them do not include the function of synteny determination but visualize the multiple synteny plots by allowing users to upload their synteny data by determining the synteny based only on BLAST similarity information, with some algorithms not designed for synteny determination. Here, we introduce a web application that determines and visualizes multiple synteny from two types of files, simplified browser extensible data and protein sequence file by MCScanX algorithm, which have been used in many synteny studies.
Introduction
Recent technological advances in sequencing make it possible to sequence genomes of various species rapidly. Given the genome sequences, understanding of a genome as well as the relationship between genomes has expanded enormously. Specifically, traces of special evolutionary events in plants such as genome duplication and speciation have been found. Synteny, a homologous region between or within chromosomes, is the most representative trace and has been widely studied to answer questions in evolution and composition of the plant genome. Thus, identifying the synteny in genomes at the gene level is important; hence, many tools have been developed to identify the synteny, such as DAGchainer 1 i-ADHoRe, 2 MCScanX, 3 and OrthoCluster. 4
To interpret synteny precisely, visualization of synteny is vital for comparative genome analysis because of the complex genome conservation and rearrangement. 5 Thus, many programs and databases provide synteny information as an image in various forms such as OMA 6 and PGDD. 7 In addition, visualization of the multiple synteny that shows the relationship of various genes present in multiple chromosomes in a linear manner is helpful in interpreting many evolutionary events such as duplication and speciation. Especially, multiple synteny visualization at gene level displays the relationship among several species importantly to identify the evolutionary events and origin of the features. To date, there are few multiple homology visualization tools (eg, GEvo, 8 mGSV, 9 mVISTA 10 ) that have helped in various genome studies. However, several demands by users are not covered by these tools. For example, the GEvo and the mVISTA determine and show homologous regions between sequences uploaded and/or selected by a user. However, the tools determine the regions just based on the similarity of sequences, so the reliability of the result regarding synteny is likely to be insufficient. The mGSV provides various options for the visualization; hence, the tool makes it possible to generate a high-quality image to help in the result interpretation. However, the tool does not include any synteny identification tools; hence, users need to make synteny information files. This can be a limitation for biologists who are not familiar with dealing large genomic data such as blasting thousands of protein sequences. For convenient and efficient synteny analysis, a fine plot for accurate multiple synteny should be generated from familiar raw data such as protein sequence file in FASTA format.
We have developed the MultiSyn (multiple synteny determination and visualization), a web-based tool for multiple synteny determination and visualization between user's genomic data and/or published plant genome data. For identification of syntenic regions, we adopted the MCScanX as an algorithm to determine syntenies, which have been used to detect the synteny blocks for many plants (eg,
Materials and Methods
Overview of the MultiSyn method and procedure
The MultiSyn was implemented on the server-side as well as on the client-side. The server-side program consists of BLASTP, MCScanX, and core script of programming using Python and Linux shell scripts in Django web framework. 13 On the client-side, we implement the user interface to the Web-based program using jQuery 14 and HTML5. 15
There are two main components: detection of synteny and visualization of multiple synteny, which were developed in Python and R package, respectively, in order to generate an image of multiple synteny (Fig. 1). The webtool proceeds in four steps: (i) upload and/or set input data files; (ii) species selection for comparison and determination of the synteny by MCScanX; (iii) set options for drawing multiple synteny plot; and (iv) visualization of multiple synteny and adjusting the plot using core script. Users can progress onto the next step just by clicking the “next” button or the “before” button to go back.

Architecture of MultiSyn webtool.
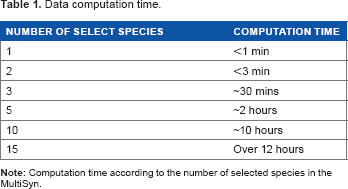
The webtool provides a progress bar that is located at the bottom of the web page and shows the processing step of a job in real time. Table 1 was added as shown below; it shows the computation time to handle the data in MultiSyn and file size of the result plot is about 1 Mb.
Step 1: upload and/or set input data as a pivot for a multiple synteny
Data computation time.
Public plant genome sources.


Progress of MultiSyn in webtool.
Step 2: select species to compare and determine synteny by MCScanX
In this step, the user chooses plants as target species that the webtool provides to determine multiple synteny (Fig. 2B). The first step in determining synteny by MCScanX is blasting protein sequences. In order to prevent superfluous modes, all the protein sequences in the provided species were blasted and the results were stored in the webtool. This method is more efficient in terms of time, similar to the results of performing BLASTP, which allows the users to shorten the time for obtaining final results of multiple synteny. Thus, the webtool only needs to blast the uploaded protein sequences set by the user against the protein sequences of the selected species. The default cutoff E-value for BLASTP is 1E-5 and the top five matches are used. Second, for the detection of synteny and collinearity in order to determine synteny for multiple species, the input results obtained from BLASTP are selected for MCScanX. Determined synteny carries out the operation visualized in the form desired by the researcher in the next step. Subsequently, synteny information is determined by MCScanX from two files: the blast result and simplified BED file.
Step 3: set options for drawing multiple synteny plot
To visualize a multiple synteny plot, the webtool requires a genomic region, pivot, used as a standard of the plot and located at the top in the plot. In step 3 of webtool, there is information about the pivot chromosome. MultiSyn provides three options for visualizing multiple synteny plots using the synteny determined in the previous step: pivot selection, color settings for species, and specific proteins (Fig. 2C). (i) The pivot has to be selected by the user during input data to align the species in order to compare by linking multiple synteny sequentially. (ii) For sophisticated visualization of multiple synteny, users can change the species colors via “color setting for species” in the webtool (MultiSyn provides differential colors for each species to default value). Moreover, (iii) proteins among input data and their synteny can be colored by putting the locus identifier that is appropriate for information on annotation file and color code in “color setting for protein”. In order to use a different color, click on “Color option” to toggle. Then, synteny is determined and the user enters option values to regenerate data sets for visualization through the core script. The core script is composed of three modules for data connected with other programs. Shell script-based program is for managing the processing and visualization of synteny with the determined information and value received from the user. And python-based programs are used to regenerate synteny, determined by the data set and R script program with genoPlotR 16 to draw a plot. Through these core scripts, a plot is generated that visualizes the information for the multi synteny users.
Step 4: save or modify the multiple synteny plot
The optimally resized multiple synteny plot is displayed in the webtool, and the downloadable plot is provided in png format (Fig. 2D). The plot shows the pivot placed at the top of the plot and the colored species and proteins both in the pivot and synteny in other species as set by the user. Matching protein in synteny is linked by one of the two colored lines; red and blue lines mean same and opposite directional alignment, respectively. Each of the chromosomal aligned plots drawn can be rearranged in the order desired by the user. If necessary, the user can move back to the previous steps to modify the contents of each step for redrawing the plot.
The MultiSyn web server
MultiSyn is powered by the Apache Web server on a Red Hat Enterprise Linux operating system. The Web Framework application used for development was Django version 1.4. The server was an Intel Xeon 4core CPU at 2.2 GHz, 16 GB of RAM, 2 TB (SATA) of hard disk, and 2 ea of 1GB network interface. MultiSyn shows the multiple synteny in a plot and helps biologists to understand the pattern of evolution of the synteny regions. The webtool and example data sets are freely available at http://202.31.147.159:62001/.
Results and Discussion
Various genome sequences of plants are being rapidly identified with the development of DNA sequencing technologies that allow the evolutionary study to advance in order to understand genomes and the relationship between genomes. To compare multiple species, determination of the synteny and visualization of multiple synteny are required. Even though various types of multiple homology visualization tools are present, the absence of proper tools, which allow convenient use by biologists, is yet to be developed. Therefore, the development of the MultiSyn allows biologists to determine synteny and draw multiple synteny plots with ease.
Features of MultiSyn
MultiSyn includes features that allow biologists to upload their raw protein sequences (PEP format) with annotation files (simplified BED format) that include the chromosomal location. In addition, MultiSyn provides species to select from and settings to specify the range for data input. Other species also can be selected to compare against the 18 public species that are already run by BLASTP in order to reduce computation time. These 18 species include eudicots (asteroids and rosids) and monocots, which allow biologists to compare their sequences with. After comparison, MultiSyn determines the synteny using MCScanX and provides chromosomal pivot selection and color options to draw multiple synteny plots. Compared to the existing multiple homology visualization, we determine synteny using MCScanX. MCScanX is using the same algorithm as a program that extends the function of MCScan. MCScan uses a four-step algorithm of the top-down approach to find a synteny conservation pattern (all-against-all comparisons, a pool of syntenic chains, multiway synteny view, and interpretation of synteny). This, with respect to divergence and WGD events, allows seeing the combined result among multiple chromosomes.
Even the recent multiple synteny visualization tool, mGSV, draws the multiple synteny plot; it does not include the synteny detection due to heavy computation. However, we tried to reduce the computational time by pre-running BLASTP of the public genome data and contain the synteny determination, making it convenient for biologist by allowing them to use raw protein sequence data.
For biologists who want to determine multiple synteny among public plant genomes with their sequences of interest, MultiSyn effectively provides a suitable multiple synteny plot. Consequentially, this approach leads to greater visualization and rapid further analysis. It may be an efficient and effective tool for non-programming skilled biologists to perform comparative analysis.
Example of Multisyn: PSY1
This example demonstrates how MultiSyn visualizes the multiple synteny plot using example gene region of phytoene synthase 1 (PSY1) with various public species. PSY1 that encodes the first dedicated step in lycopene biosynthesis was synteny analyzed in Multiple synteny plot of PSY1. Step 1: first enter the ID and click the button “Add a species”. This information is the longer gene name. Please check “Automatic changing long name”. And select the Step 2: select the five species ( Step 3: select the first start chromosome to draw the synteny among chromosomes (pivot chromosome). And you can specify the color options. Click the color options, modified in PSY1, the color setting for protein. We enter information on the locus identifier, protein name, and color code: PSY1(Tr1860.2, PSY1 and magenta), AEC(Tr1990.2, AEC and purple), ARF8(Tr1970.2, ARF8 and blue), HMGCR(Tr2010.2, HMGCR and cyan), and UBQLN(Tr2160.2, UBQLN and green). Tr character is reduced automatically by the system because of the long gene name at step 1. This information is shown on the top of the setting for color species. Step 4: result plot shown on the screen is a preview. Click to download the results that can be found in the original plot. Each PSY1, AEC, ARF8, HMGCR, and UBQLN information entered in step 3 option is displayed on the first chromosome, depending on the color. This indicates the relationship with other species. To explain plot for result, Solyc03 g031860.2 (Tr1860.2) gene in the SL2.40ch03 chromosome of 
In the same way (Add a species in Step 1 not click the Add a file button and enter a protein (.pep) and Annotation (.bed) file.), you can draw in extra sample provided by Supplementary Figure 1.
Conclusions
As the analysis of genome sequences or sequence of interest became crucial for identifying evolutionary significance, the demand for suitable tools have increased. Therefore, we developed the MultiSyn in order to aid evolutionary analysis by displaying multiple synteny. MultiSyn allows biologists to upload their protein sequence of interest, determine the synteny between their sequences, and pre-run public genome data using MCScanX and significantly present multiple synteny plots. MultiSyn provides a convenient means for biologists to analyze their sequence of interest, comparing them with public genome sequences through identification and visualization of evolutionary conserved regions.
Author Contributions
Conceived the project: D-WK, T-HL. Contributed mostly to the design: T-HL, J-HB, JK, D-WK. Developed the algorithms of optimized settings for visualization of multiple synteny files: T-HL, C-KK, S-HS, DC, MBR. Developed the web service: J-HB. Tested and revised the web application: JK. Wrote the manuscript: T-HL, J-HB, JK. Contributed equally to this work: J-HB, JK. Co-corresponding authors: D-WK and T-HL. All the authors read and approved the final manuscript.
Supplementary Material
Supplementary Figure 1
Extra sample of MultiSyn result plot.
Supplementary Figure 2
Progress of MultiSyn in webtool.
Supplementary Table 1
Data format; Protein(.pep) data, simplified annotation(.bed) data, color code.
Footnotes
Acknowledgment
We thank Professor Lee from Department of Computer Information Engineering, Kunsan National University for providing the support server settings.