
Abstract
Comprehensive effort for low-cost sequencing in the past few years has led to the growth of complete genome databases. In parallel with this effort, a strong need, fast and cost-effective methods and applications have been developed to accelerate sequence analysis. Identification is the very first step of this task. Due to the difficulties, high costs, and computational challenges of alignment-based approaches, an alternative universal identification method is highly required. Like an alignment-free approach, DNA signatures have provided new opportunities for the rapid identification of species. In this paper, we present an effective pipeline HTSFinder (high-throughput signature finder) with a corresponding k-mer generator GkmerG (genome k-mers generator). Using this pipeline, we determine the frequency of k-mers from the available complete genome databases for the detection of extensive DNA signatures in a reasonably short time. Our application can detect both unique and common signatures in the arbitrarily selected target and nontarget databases. Hadoop and MapReduce as parallel and distributed computing tools with commodity hardware are used in this pipeline. This approach brings the power of high-performance computing into the ordinary desktop personal computers for discovering DNA signatures in large databases such as bacterial genome. A considerable number of detected unique and common DNA signatures of the target database bring the opportunities to improve the identification process not only for polymerase chain reaction and microarray assays but also for more complex scenarios such as metagenomics and next-generation sequencing analysis.
Introduction
DNA signature is a short k-mer oligonucleotide fragment with an arbitrary length k, which is unique or specific for a particular group of species selected from a target genome database. There are two categories of unique and common signatures according to the purpose of usage. The presence of a unique DNA signature in any volume of sequences and genetic materials represents the existence of the corresponding species.1,2 Therefore, signature discovery is the action of finding specific fragments of genome in a database. 3 Any pipeline, application, or algorithm that is designed for DNA signature discovery has to detect an entire database or multiple databases recursively. The procedure varies according to the purpose of using DNA signatures.
Despite the impact of the sequences 16S rDNA and 16S rRNA in the microbial taxonomy, they are particularly useful for taxa above the rank of species. Because of sequence similarities, they are not sufficient to define bacterial species and strains. 4 Approximately 15% of bacterial genomes contain only a single copy of 16S rRNA. 5 Since the high-throughput sequences are often noisy and partial, 6 the application of 16S sequences for the next-generation sequencing (NGS) data analysis at species level is even less efficient. Concerning the large number of DNA signatures in different species and the possibility to choose arbitrary lengths of them for identification, this approach is not only suitable for polymerase chain reaction (PCR) and microarray-based assays but also has great potential for NGS analysis. The pipeline high-throughput signature finder (HTSFinder) that is proposed in this paper has been designed to address some of the challenges of DNA signature discovery in order to enhance the usability of DNA signatures for NGS analysis.
Several tools and algorithms of DNA signature discovery have been proposed in the literature in order to facilitate the design of microbial and pathogen-based diagnostic assays; notable instances are discussed in the following sections.
Tool for Oligonucleotide Fingerprint Identification (TO FI) 7 is designed to identify DNA fingerprints of a single genome as suitable probes for microarray-based diagnostic assays. It utilizes the whole genome of the pathogen instead of the special gene (such as 16s rRNA) or special regions of the genome for designing probes. 8 In order to design DNA microarray probes, TOFI reduces the solution space by discarding DNA sequences that are common to the target sequence and one or more phylogenetically close sequences. Then, each extracted DNA microarray probe is compared with all DNA sequences from the chosen reference database. 7
Tool for PCR Signature Identification (TOPSI) 9 is a pipeline for real-time PCR signature discovery. TOPSI detects common signatures among multiple strains of bacterial genomes by collecting the shared regions through pairwise alignments between the input genomes. It is an extended version of TOFI.9,10
Insignia 11 provides unique signatures that can be used to design primers for PCR and probes for microarray assays. It has two main components: the web interface and the computational pipeline. The computational pipeline uses grid computing and an algorithm to perform pairwise alignment of every pair of target genomes and background genomes for their comparison. Insignia provides signatures that are unique against the background genomes based on databases of bacterial and viral genomic sequences containing 13,928 organisms (11,274 viruses/phages and 2,653 bacteria). 12 In fact, when a user adjusts the desired options in the Insignia web interface, a query runs on the database that contains the results of DNA signature discovery which has already been provided.
TOFI, TOPSI, and Insignia use the open-source software MUMmer 13 that implements a suffix-tree-based algorithm for comparing genomic sequences.7,9,11 It is a package for the alignment of very large DNA and amino acid sequences. Furthermore, these three pipelines use Basic Local Alignment Search Tool (BLAST) for the evaluation of signatures regarding specificity.
CaSSiS 14 is an algorithm for detecting signatures with maximal group coverage within a user-defined specificity range for designing primers and probes. It provides signatures for single or group organisms in hierarchically clustered sequence datasets. This algorithm calculates the Hamming distance between a signature candidate and its matched targets. CaSSiS uses the rRNA sequences provided by the database SILVA to create a signature collection for designing primers and probes.
The consecutive multiple discovery (CMD) algorithm 15 is an iterative method including the parallel and incremental signature discovery (PISD) method as a kernel routine to discover implicit DNA signatures. PISD is a combination of the Hamming-distance-based algorithm, the Internal-memory-based unique signature discovery (IMUS) approach, 16 and Zheng's method 17 in terms of using the corresponding incremental and parallel computing techniques. PISD uses a mismatch tolerance and previously discovered signatures of specific lengths as candidates to find shorter signatures instead of scanning the whole database. CMD and PISD can find unique signatures for single sequences, but cannot search for signatures that are specific for groups; 16 they are designed to find signatures of sequences from expressed sequence tag (EST) databases.
The internal memory-based unique signature discovery algorithm IMUS 16 is an improvement of Zheng's method, 17 which is based on the Hamming distance for detecting unique signatures. IMUS tries to discard similar substrings of a sequence in order to obtain the DNA signatures as unique fragments. Parallel internal-memory-based unique signature discovery (PIMUS) 18 is the improved version of IMUS. Both algorithms load the complete DNA database into the main memory to find unique signatures in EST datasets.
A comparison of signature discovery algorithms according to the data format, computational resources, and ability to process single or multiple sequences.

Jellyfish 20 is an algorithm to count the k-mers in parallel. This algorithm implements a lock-free hash table optimization for counting k-mers up to 31 bases in length.
There are other approaches to find signatures or probe sequences, such as PROBESEL, 21 OligoArray, 22 OligoWiz, 23 YODA, 24 PRIMROSE, 25 and ARB-ProbeDesign. 26 All of them are limited to one selected target or single sequence in each run; thus, they are not applicable for large datasets. 14
In practice, despite the respected efforts of abovementioned and other methods, there are still a number of limitations for DNA signature discovery.
Since most existing methods of DNA signature discovery require significant computational resources, they are not applicable for the entire research community. Due to the size of genome databases, the large amount of random-access memory (RAM) and central processing unit (CPU) capacity requirements and long execution times are the major limitations of most of the abovementioned methods that are based on pattern comparison and pairwise alignment of the genomes. The determination of the mismatch tolerance level as a discovery condition also influences the results.
In some cases, it is necessary to load the whole dataset into the main memory for searching for unique or common signatures. When the size of the data exceeds the available memory, the execution will fail. For instance, in IMUS, PIMUS, and Zheng's methods, the entire database has to be loaded into the memory. 19 Thus, for such sequential algorithms like IMUS, increasing the number of CPU cores does not increase the discovery efficiency of the algorithm. 18 Another limitation for most of the abovementioned methods is the lack of efficiency to find both unique and common signatures simultaneously. Most of them are capable to find only DNA signatures of a single genome. In addition, the limitation of some of these methods is the lack of the possibility to select an arbitrary length (k) for the signatures.
The additional challenge as another major limitation for DNA signature discovery methods is the lack of option in the choice of target and nontarget genome databases. TOFI, TOPSI, and Insignia use BLAST databases (such as nt and nr databases) for the background or nontarget genomes for specificity evaluation of signatures and there is no option for the user to choose other target and nontarget genome databases. As an example, in the Insignia web interface, the user receives a quick response without special requirements on local computational resources. However, this privilege comes with the restriction that there is no option to use other sequences as the target and background genomes, because they are part of the Insignia database. 19 With the advancements of the sequencing technologies and the increasing number of complete genomes, whole-genome shotgun sequences, and draft genomes, it is obvious that some of these signatures will not be unique later using BLAST specificity evaluation. This issue is a challenge not only for DNA signatures but also for all the sequence-based identification methods.
Geographical distribution and diversity of the species, ecological and chemical status, host and environmental factors, isolation or complexity of the samples, and many other factors can have a great impact on the selection of target and nontarget genome databases for DNA signature discovery. When the absence of a considerable number of species in the sample is evident, it seems quite questionable that we eliminate a large number of useful DNA signatures through their assessment and specificity evaluation against the entire background sequence databases such as BLAST. For instance, when we are sure that, in the sample, there is nothing from zebra fish, mouse, chimpanzee, black cottonwood, Macaca fascicularis, etc., we do not need to check the uniqueness of our DNA signatures against their genomes; otherwise, we would lose a significant number of signatures.
ESTs are short fragments of mRNA sequences obtained by single sequencing of randomly selected cDNA clones. ESTs are mostly used either to identify gene transcripts or as an alternative cheap method of gene discovery and gene sequence determination. 27
IMUS, PIMUS, CMD, PISD, and DDCSD are designed to scan EST sequences for the unique signatures. However, the ESTs represent only fragments of genes, not complete coding sequences; 28 therefore, many signatures are missed.
The pipeline HTSFinder has significant advantages compared with the DNA signature discovery pipelines and algorithms described earlier.
First, HTSFinder is capable to detect all unique, common, and maximal group coverage signatures of the entire database or multiple databases simultaneously. Second, it becomes possible to select target and nontarget genome databases, based on user requirements. For instance, we have the ability to use both forward and reverse-complement genome sequences of a database for detecting DNA signatures. Third, the pipeline can be considered either a cluster of low-cost computer nodes that are commonly available in research facilities or a high-performance computing (HPC). Finally, the flexibility of the different phases of the pipeline makes it suitable for other bioinformatic and metagenomic studies such as NGS analysis.
HTSFinder is very efficient and powerful with high accuracy for both unique and group-specific signatures without discarding even a single signature from the database, except those ones that contain the International Union of Pure and Applied Chemistry (IUPAC) nucleotide codes such as K, M, N, R, S, W, and Y. Our GkmerG component will remove any k-mer containing IUPAC nucleotide codes after generating the k-mers. In this pipeline, there is nothing to worry about the mismatch tolerance and complexity of comparison and pairwise alignment search methods.
Materials and Methods
Description of the pipeline
HTSFinder consists of three computational phases as shown in Figure 1. This pipeline generates all the possibilities of k-mers for every genome individually and then determines their frequency in the entire database. Finally, DNA signatures of every species or strain are obtained in the database or multiple databases that have been involved in the pipeline. HTSFinder implements the parallel and distributed computational tool Hadoop for the second and third phases.
The three main phases of HTSFinder for detecting DNA signatures. We can repeat the second phase with the obtained results if required.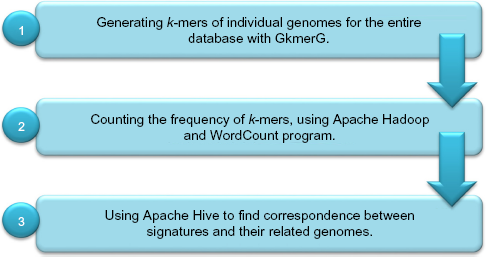
Data preparation
The first phase of the pipeline is carried out by GkmerG that is designed to obtain all the possibilities of k-mers of genome sequences with FAST-All (FASTA) format (*.fna or *.fa). This software tool removes the remarks of the genome and splits it to the specific length k. Then, it eliminates the k-mers that contain IUPAC nucleotide codes and every subsequence of length less than k which has remained from the end of the sequence after splitting. Figure 2 illustrates the split of the genome by GkmerG. Concatenating the files, sorting k-mers, and removing all duplicates except one are the last steps of GkmerG. For the species with multiple chromosomes and some bacterial genomes that are composed of multiple chromosomes
29
and plasmids, GkmerG concatenates them into a single file before sorting at the end of the first phase. GkmerG copies the original database into another directory as the reference database by appending a number to the beginning of every species name in it, to simplify the future data management. Once we get the output of the first phase for a database, we can keep it forever. In case of any update in the database, we need only to repeat this phase for the updated or new genomes, not for the whole database. The output of GkmerG is the input for the second step in the pipeline which is described in the following section.
Splitting of the genome by GkmerG for k = 18 to get all the possibilities of 18-mers. Generating k-mers for a single genome with GkmerG includes: purgation, splitting, concatenation, cleaning, sorting, and removing duplicate except one. The output of GkmerG is a file containing k-mers of a genome in a single column. The labels above the file numbers in this figure represent the beginning of four k-mers in the head of files.
The Apache Hadoop
Dramatic increase in the amount of data in various, particularly biological fields of science revealed the inadequacy of existing ordinary computers for big data analytics. It has prompted the developers to compose tools and applications using parallel and distributed computing that could be applicable on commodity hardware. The Apache Hadoop project30–32 has been designed as an open source, Java-based software framework for parallel and distributed computing on large datasets using commodity hardware. Hadoop allows to run simple programming models on large structured and unstructured datasets across an arbitrary number of nodes in a cluster. A Hadoop cluster has single master and several slave nodes that are connected to each other through Secure Shell. It can run as a single-node or multinode cluster with thousands of nodes. The Hadoop core has two primary components: Hadoop Distributed File System (HDFS) and MapReduce.
HDFS31,33 is the data storage part of Hadoop. It provides high-throughput access to large datasets across multi-nodes of a cluster. HDFS breaks down the data into small chunks, which are stored as independent elements. HDFS provides input data storage for the MapReduce framework.
MapReduce 31 is a programming model for parallel and distributed data processing. MapReduce works by breaking the processing into two phases: the Map and the Reduce. The Map phase processes a set of data in parallel and returns it as an intermediate result, and then the Reduce phase reduces it to a smaller set of data. Each Map and Reduce works independently. In fact, MapReduce decreases the large amount of raw input data into smaller amount of useful data for further processing.34,35
As another component of the second-generation Hadoop 2 release of Apache, YARN (Yet Another Resource Negotiator) was added in order to upgrade scheduling, resource management, and execution in Hadoop. 36
Although Hadoop is defined as a distributed system with multi-nodes, the ability of Apache Hadoop to use MapReduce for parallel processing of large datasets is an extra power to let even a single-node processes large datasets exceeding memory and CPU capacity.
In this research, we used the Hadoop framework and WordCount program to calculate the frequency of k-mers in very large genome datasets. In Hadoop 1.2.1 and earlier releases, the JAR (Java Archive) file of WordCount is also included. Figure 3 illustrates a MapReduce and WordCount process.
An example of the overall MapReduce Wordcount process. The original image was made by Trifork.
In the second step of the pipeline, we copy all the output files of the first step to the HDFS and run the Word-Count program.
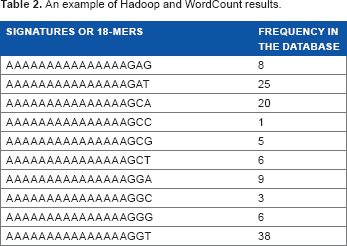
An example of Hadoop and Wordcount results.
Once we execute the second phase for a database, we can use the results in the future until the next update of the database. However, as a difference from the updatable first phase, in case of any update in the database, we have to repeat the second phase for the entire database.
When there are multiple target and nontarget databases, it is possible to merge all of them in the pipeline, but as the input grows larger, it requires far more computational resources. As a suggestion, it is better to implement the first and second steps for every database separately. With respect to the WordCount function that discards repeated k-mers and keeps only one in the output, we can reduce the size of output files and also the execution time. Then, we can merge the output of the second phase for all the databases and repeat the second phase with WordCount in Hadoop one more time. In this case, we have a shorter process. Moreover, for the future execution, we can select the output files of the second phase as the candidate of their corresponding databases. In this case, we do not need to perform the first phase of the pipeline for the previously processed databases and we can repeat the second phase for target and nontarget databases by merging the smaller files. For instance, the output of the first phase for the bacterial genome database resulted in a file with 177.35 GB of 18-mers. However, in the second phase, the size of this file was reduced to 103.03 GB that contained all the candidates of 18-mers in the database without any repeat. We can use this file as the candidate of bacterial genome database for further processing. Figure 4 illustrates the process of finding DNA signatures of the target database among nontarget databases.
The recommended process for detecting unique DNA signatures of a target database against nontarget databases. In step 2 of this figure, the frequency number of k-mers varies from 1 to n, where n is the total number of the databases that are used in the pipeline. Since there are four databases in this figure, the frequency of k-mers in step 2 is from 1 to 4. In step 3, there are two input files with the list of non-repeated k-mers; therefore, the frequency of k-mers in the output is 1 or 2. Hence, k-mers with frequency 2 that is common in both input files are the unique signatures of database 1 against all databases.
The input for the third phase of the pipeline is the output of the first and second phases. The proper steps of the third phase are described in the following section.
The Apache Hive
Hive37,39 is a data warehouse infrastructure on the top of the Hadoop MapReduce framework. It is designed to query a large dataset that is stored in the HDFS using an SQL-like language called HiveQL. Traditional, relational databases require the data to be in a structured format, while Hive can handle both structured and unstructured information. It lets the user to process large datasets with relatively little effort and in a reasonably short time. This research proves the efficiency of Hive to handle querying on billions of rows in a table or multiple tables. With HiveQL, we can extract whatever we need from the results of the second step of the pipeline. We can extract all the unique signatures of a specific species in the database or group-specific signatures that are common among 2, 3, 4, etc. Due to the flexibility of querying in Hive, there are various ways to create the tables and design the queries in the third step. Our future study is motivated by optimizing querying. After loading the data into the tables created with Hive, we can use queries such as SELECT and JOIN to extract relationships. We should create two tables with Hive: one for the output of the first phase and another one for the complete or a special part of the output of the second phase. By considering the ability of Hive to query very large tables and prevent the repetition of queries, we added a column containing the reference number to the files from the first step. For example, file 1 contains 18-mers from the first species in the database, so we inserted a column containing reference index 1 before all 18-mers in this file. Then, we merged all the 2,773 files in a single large one (220.35 GB) with two columns of k-mers and their related reference numbers. The reference number indicates the number that has been appended to the name of the species by GkmerG in the first phase.
There are several options to create the table from the output of the second step: one is to create the table without making any changes in the output and another one is to break down the output into smaller groups according to the targeted signature. For example, if we are looking for the unique signatures, it would be better to extract only 18-mers with frequency 1. However, if we are looking for a common signature, then it would be better to extract the 18-mers with a specific frequency number such as 2, 3, 4, etc. In order to have a faster and easier implementation with Hive and later steps, we recommend the second option.
Source code for GkmerG and information and command lines for Hadoop and Hive are freely available at: http://www.inf.unideb.hu/~hajdua/HTSFinder.html, https://sourceforge.net/projects/htsfinder/, and https://github.com/raminkm/HTSFinder.
Selected sequence databases
Bacterial genome database. To prove the efficiency of our proposed method, the bacterial genome databases with 2,773 complete genomes in FASTA format (*.fna) were downloaded from the National Center for Biotechnology Information (NCBI) database. The size of this database is 9.7 GB after decompression. The list of the bacterial genomes is available in Supplementary Files.
The reverse-complement bacterial genome database. Another database that we used in this study was the reverse-complement bacterial genome database. The revcom.pl 1.2 (available at: http://code.google.com/p/nash-bioinformatics-codelets/) is a Perl program written by John Nash (Copyright © Government of Canada, 2000-2012). We used this program to provide the reverse-complement sequences for the whole bacterial genome database.
Human genome database. The whole human genome is another database used in this research. The Homo sapiens hsref-GRCh38 sequences in FASTA format (*.fa.gz) were downloaded from the NCBI ftp database. The size of the genome was 2.9 GB after decompression.
Results and Discussion
Results for the bacterial genome database
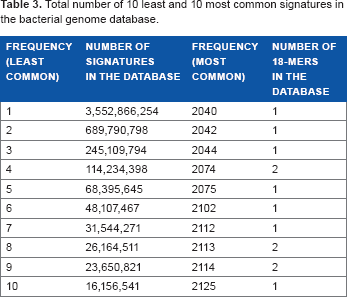
Total number of 10 least and 10 most common signatures in the bacterial genome database.
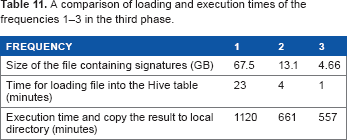
In the third phase, we have created tables in Hive and loaded files from the first and second phases. The table with the reference numbers and k-mers (220.35 GB) and the table with the list of unique signatures (67.5 GB) are used to run the query in Hive in order to specify the species and strains as the owners of the unique signatures. We have repeated the query on the table containing the list of signatures with frequency 2 instead of the unique signature's table to find every pair of species with a common signature. For other frequencies, the same implementation is required.
An example of the output for the third phase (the right side of the table). The reference numbers in this table indicates the numbers appended by GkmerG for easier tracking of data in the pipeline.

The following examples are parts of the results obtained by HTSFinder to show the efficiency of this pipeline.
No unique DNA signatures with k = 18 were found for 30 of the bacterial genomes in the database. They are listed in Supplementary Files.
The number of unique DNA signatures in 475 genomes was <10,000. Chlamydia as a genus of bacteria with 83 species and strains in the bacterial genome database has the lowest number of unique DNA signatures of 18-mers. The number of the unique signatures of 18-mers in 75 of them was <10,000 and in 57 it was <1,000. We have located 13 Chlamydia bacteria without unique signatures with k = 18. Top 10 bacterial genomes with the highest number of unique DNA signatures in the bacterial genome database are shown in Figure 5.
Top 10 bacterial genomes with the highest number of unique DNA signatures in the bacterial genome database.
B. mallei and B. pseudomallei genomes with their number of unique DNA signatures of 18-mers in the bacterial genome database.

For the frequencies >1, this pipeline detects the common signatures not only among a single species and its strains but also in the entire database. Frequencies 2 and 3 have been considered samples to prove the efficiency of this pipeline for discovering common DNA signatures within the bacterial genome database.
As an example, the following results were obtained for Acaryochloris_marina_MBIC11017_uid58167 that is the first bacteria in the database.
A total of 689,790,798 signatures of k = 18 with frequency 2 were found in the database, whereas 673,490 of them are shared between Acaryochloris_marina_MBIC11017_uid58167 and 2,382 other species.
There was not any signature of k = 18 with frequency 2 between Acaryochloris_marina_MBIC11017_uid58167 and 390 other bacterial genomes. Figure 6 presents the highest number of signatures with frequency 2 which are common between Acaryochloris_marina_MBIC11017_uid58167 and 10 other bacterial genomes in the database.
Ten bacterial genomes with the highest number of signatures common with Acaryochloris_marina_MBIC11017_uid58167 in the bacterial genomes database. This is an example of the results for common signatures with frequency 2 obtained by HTSFinder.
A portion of results for signatures with frequencies 2 and 3 in the database. concerning the reference numbers, most of the common signatures are shared among the phylogenetically close genomes. However, number of common signatures among unrelated species are also notable.

Number of unique DNA signatures in the human genome and its three chromosomes with different sequence sizes for a series of lengths of k-mers from 21 to 30.

A comparison of five Bacillus strains with the highest number of unique signatures and five others with the lowest number of signatures of length 18 within species and in the entire database. This table shows that within-species similarity and variability have more influence on the volume of signatures than the remainder of the database.

Results on both forward and reverse-complement sequences of bacterial genome
In the genome databases such as NCBI, only one strand of DNA sequence is provided. However, to design the primers, both forward and reverse-complement sequences should be considered. Moreover, depending on the sequencing technology, generated short reads can be from both strands. Therefore, the ability to obtain DNA signatures of both strands is potentially useful.
For the reverse-complement sequences, the size of the output files and the computational times of the first and second phases of the pipeline were the same as in the forward genome implementations. The output of the second phase for forward and reverse-complement genome databases resulted in a file of 103.03 GB for each. We have repeated WordCount on both of the databases one more time to determine the frequencies of k-mers as illustrated in Figure 4. The final result was a file of 52.53 GB for the forward and the same size for the reverse-complement genome database. On the one hand, it means that the volume of data containing unique signatures for the forward database decreased from 67.5 to 52.53 GB similarly to the reverse-complement genome database. On the other hand, the overall volume of DNA signatures that we could find for the species in the bacterial genome database increased from 67.5 GB containing signatures for a single strand to 105.06 GB for both strands of DNA.
Implementation results for the forward and reverse-complement bacterial genome database and the human genome database
We have considered the forward bacterial genome as the target database. We have applied the method that is described in Figure 4 and found 50.28 GB of k-mers for the target genome database which are unique among the three databases.
Number of unique DNA signatures for the forward bacterial genome database as the target and two other nontarget databases.

Performance evaluation and computational times
For this experiment, we have applied two different platforms. The first one was a single node with 12 processors of Intel Core i7-4930K CPU at 3.40 GHz and 55 GB of RAM and 6 TB of hard disk. The operating system was Ubuntu 12.04.5 LTS, Java SE Version “1.8.0-25”, Hadoop Version 1.2.1, and Hive-0.12.0. We have installed this node as a single-node Hadoop cluster. Another platform was a multi-node cluster with seven nodes including the master node and six slave nodes. The master node was an Intel Core2 Quad CPU Q6600 at 2.40 GHz and 8 GB of RAM and 3.2 TB of hard disk, while slaves had 4 GB of RAM, Intel Core i3-2100 CPU at 3.10 GHz and 500 GB of hard disk, all with the desktop version of Ubuntu 14.04.1 LTS 64-bit, Java Version “1.7.0-65” OpenJDK, Hadoop 12.1, and Hive-0.12.0.
The first phase of the pipeline executed with GkmerG took 156 minutes with five nodes and 780 minutes with a single node from the second platform to generate 18-mers from the original bacterial genome database (9.7 GB). As an output, we got 2,773 files containing 18-mers with a total size of 177.35 GB.
A comparison of computational results of the first and second platforms in the second and third phases of the pipeline in order to find unique DNA signatures and their related species in the forward genome database (time in minutes).

Although the whole computation on the second platform took about nine hours more than on the first one, comparing the RAM and CPU capacity of the two platforms confirms the ability of a cluster of low-cost computers that are commonly available in research facilities to accelerate big data analytics.
A comparison of loading and execution times of the frequencies 1-3 in the third phase.
Conclusions
Data obtained in this study clearly show the efficiency of our proposed pipeline to find all possible DNA signatures of a target database. In this pipeline, we intend to overcome some limitations of DNA signature discovery by focusing on efficiency issues to detect all the possibilities of unique and common DNA signatures in a database, regardless of such challenges as pairwise alignment and mismatch tolerance. Another important feature of this pipeline is its ability to select target and nontarget databases. From the standpoint of this research, nontarget genome database is not necessarily defined as the entire background genome databases such as BLAST for the assessment and specificity evaluation of DNA signatures. It can be determined due to the requirements. General applicability is another issue that is considered in this pipeline; it can be launched either in a cluster of low-cost nodes or in a HPC environment. Although the volumes of the datasets in this study are very large (eg, 287.85 GB in a single run), DNA signatures are detected very precisely and comprehensively in the target databases and the execution times are reasonably short. The proposed experiment is just the basic idea, and there is a great flexibility to design implementations for phases of this approach. Once the pipeline is implemented, the users will find how to manipulate their datasets according to the requirements. This pipeline can be an efficient method, not only for DNA signature discovery but also for other purposes in bioinformatic and metagenomic studies such as the alignment and assembly of short reads and next-generation sequencing analysis.
Author Contributions
Conceived and designed the experiments: RK, AH. Analyzed the data: RK. Wrote the first draft of the manuscript: RK. Contributed to the writing of the manuscript: RK, AH. Agreed with the manuscript results and conclusions: RK, AH. Jointly developed the structure and arguments for the paper: RK, AH. Made critical revisions and approved final version: RK, AH. Both authors reviewed and approved the final manuscript.
Supplementary Materials
Download source for GkmerG and supplementary data
Content (after decompression):
Hadoop and Hive installation guide and command lines. Excel file of bacterial genome database reference generated by GkmerG. List of bacterial genomes without any unique 18-mers (DNA signature) in the database. The GkmerG algorithm figure. GkmerG.tar.gz including software components and an example of database for testing.
Footnotes
Acknowledgments
The authors would like to gratefully thank Samira Sajjadian, Edéné Rutkovszky, Herendi Tamás, and Laszló Kovács for their help, support, and encouragement. Special thanks also to the Faculty of Informatics and Department of Computer Graphics and Image Processing at the University of Debrecen for providing computational resources for this research.