Microarray technology is highly used in biological research environments due to its ability to monitor the RNA concentration levels. The analysis of the data generated represents a computational challenge due to the characteristics of these data. Clustering techniques are widely applied to create groups of genes that exhibit a similar behavior. Biclustering relaxes the constraints for grouping, allowing genes to be evaluated only under a subset of the conditions. Triclustering appears for the analysis of longitudinal experiments in which the genes are evaluated under certain conditions at several time points. These triclusters provide hidden information in the form of behavior patterns from temporal experiments with microarrays relating subsets of genes, experimental conditions, and time points. We present an evaluation measure for triclusters called Multi Slope Measure, based on the similarity among the angles of the slopes formed by each profile formed by the genes, conditions, and times of the tricluster.
Microarray technology is highly used in biological research environments due to its ability to monitor, for a great gene collection, the RNA concentration levels, thus enabling the study of genetic functions of species.1 Bioinformatics and data mining have developed a vast number of computational tools that allow us to analyze data obtained using this technology and to find new knowledge that is hidden from human eyesight.2,3 One of the most studied approaches is pattern search in gene expression data. The genes exhibiting high correlation among their expression levels could be involved in similar regulatory processes.4 The relationship between correlation and functionality has been proved in several studies as in the study by D'haeseleer et al.5
Clustering techniques are suitable for performing pattern search by creating groups of genes that exhibit similar expression patterns.6 Traditional clustering algorithms analyze the whole microarray dimensional space grouping genes taking into account all experimental conditions.7 However, the activity of genes could only appear under a particular set of experimental conditions, exhibiting local patterns. Discovering these local patterns can be key to discover gene pathways, which could be hard to discover in other ways. For this reason, the paradigm of clustering techniques must be modified to methods that allow local pattern discovery in gene expression data.8 Biclustering9 addresses this problem by relaxing the conditions and by allowing assessment only under a subset of the conditions of the experiment, and it has proved to be successful in finding gene patterns.10,11
If a third dimension is added to the dataset besides genes and conditions, such as time, clustering and biclustering result insufficient. There is a lot of interest in temporal experiments because they allow an in-depth analysis of molecular processes in which the time evolution is important, for example, cell cycles, development at the molecular level, or evolution of diseases.12 In this sense, triclustering appears as a technique going one step further by grouping genes under particular conditions and under particular time points,13 thus being capable of managing three-dimensional (3D) data. Therefore, triclustering is suitable for the analysis of microarray experiments where several samples are taken at different time points.14 This is of great interest since it allows for a deep analysis of biological processes where temporary development is important.
Both biclustering and triclustering attack NP-hard problems.15 Therefore, algorithms based on heuristics are well suited to manage this kind of problem. In this sense, defining an appropriate quality measure for triclusters is an important and essential challenge.16
In this work, we propose a quality measure called Multi Slope Measure (MSL), which measures the quality of a tricluster based on the similarity among the angles of the slopes formed by each profile formed by the genes, conditions, and times of the tricluster.
We show the results obtained applying the MSL measure embedded in the TriGen Algorithm,17 an algorithm based on an evolutionary heuristic, genetic algorithms. The datasets used are a synthetic dataset and three real experiment datasets: the yeast cell cycle-regulated genes,18 mouse degeneration of retinal cells,14 and human transcription factor oncogene OTX2 silencing effect on D425 medulloblastoma cell line.19
The results have been validated by three different methods. First, by analyzing the correlation among the genes, conditions, and times in each tricluster using two different correlation measures (Pearson20 and Spearman21). Second, by a graphic validation of the patterns extracted based on the graphic representation (see Graphic Representation subsection), and third we have provided functional annotations for the genes extracted from the Gene Ontology (GO) project.22 The results obtained have been compared to two previously defined quality measures, MSRJD23 and LSL,24 showing improvement in the performance of the measure (see Results and Discussion section).
The rest of the article is structured as follows. A review of the latest related works can be found in State of the Art section. Methods section describes the MSL measure as well as a brief description of Triclustering, the graphic representation applied, and the TriGen algorithm. In the Results and Discussion section, we show the results and discussion of applying TriGen to the synthetic and real datasets. The last section shows the conclusions.
State of the Art
This section is to provide a general overview of recent works in the field of gene expression temporal data. In particular, for those works related to the application of triclustering, we focus on the measures applied to evaluate the triclusters.
We first present the authors’ previous contributions to this field. In our study,23 we described MSR3D, an adaptation of the Mean Square Residue (MSR)9 to the 3D space, so that a third factor, time in this case, can be taken into account. MSR3D measures the homogeneity of a tricluster in the relation of each value of the tricluster, with the average of all genes, average of all conditions, average of all times, average of all genes and conditions, average of all genes and times, average of all conditions and times, and average of all genes, conditions, and times in the tricluster. We also have presented LSL in our recent study,24 which measures the quality of a tricluster based on the similarity among the slopes of the angles formed by the least square lines from each of the profiles formed by the genes, conditions, and times of the tricluster. LSL has obtained better results than MSR3D applied to the same datasets along with the TriGen algorithm.24
Regarding other authors’ contributions, in 2005, Zhao and Zaki25 introduced the triCluster algorithm to extract patterns in 3D gene expression data. They presented a measure to assess triclusters's quality based on the symmetry property. This allows for very efficient cluster mining since clusters are searched over the dimensions with the least cardinality.
g-triCluster, an extended and generalized version of Zhao and Zaki's proposal, was published one year later.26 The authors claimed that the symmetry property is not suitable for all patterns present in biological data and proposed the Spearman rank correlation21 as a more appropriate tricluster evaluation measure.
An evolutionary computation proposal was made by Liu et al.27 The fitness function defined is a multiobjective measure that tries to optimize three conflicting objectives: clusters size, homogeneity, and gene-dimension variance of the 3D cluster.
LagMiner was introduced by Xu et al.28 to find time-lagged 3D clusters, what allows in turn to find regulatory relationships among genes. It is based on a novel 3D cluster model called S2D3 Cluster. They evaluated their triclusters on homogeneity, regulation, minimum gene number, sample subspace size, and time periods length.
Wang et al.29 proposed a new algorithm called ts-cluster basing their definition for coherent triclusters also on finding regulatory relationships among genes. For that purpose, time shifting is also considered among time points in the evaluated triclusters.
A new strategy to mine 3D clusters in real-valued data was introduced by Sim et al.30 The authors defined the Correlated 3D Subspace Clusters (CSCs), where the values in each cluster must have high co-occurrences and those co-occurrences are not by chance. They measure the clusters based on the correlation information measure, which takes into account both prerequisites.
Hu and Bhatnagar presented an approach focusing on the concept of Low-Variance 3-Cluster,31 which obeys the constraint of a low-variance distribution of cell values.
The work by Liu et al.32 was focused on finding Temporal Dependency Association Rules, which relate patterns of behavior among genes. The rules obtained are to represent regulated relations among genes.
Finally, a brief survey on triclustering applied to gene expression time series was published in 2011.13 There are three main features that a triclustering algorithm can perform. According to Mahanta et al.13, these features are temporal coherence that makes reference to the ability of the algorithm to capture the coherence of different genes in a single time point across samples while generating the final triclusters and the ability to find triclusters with nonconsecutive time points and tricluster with a specific type of pattern (shifting, scaling, delayed). g-triCluster,26 Moga3c,27 LagMiner,28 ts-cluster,29 and Temporal Dependency Association Rules32 perform the temporal coherence feature and only Tricluster25 and Moga3c27 perform finding triclusters containing non-consecutive time points. Tricluster25 finds scaling patterns, LagMiner28 finds shifting and scaling patterns and ts-cluster29 focuses on time-delayed patterns; the rest do not focus on finding a specific type of pattern. Another feature examined is the algorithm type distinguishing between deterministic (Tricluster25, g-triCluster26) and nondeterministic (Moga3c27) approaches.
Methods
In this section, we describe our proposal, the tricluster quality measure called MSL that is based on tricluster's angular features. We will analyze all MSL principles and fundamentals and how it has been developed.
This section is structured as follows: Triclustering subsection describes the triclustering procedure as an evolution of its well-known predecessor biclustering. In the subsection Graphic Representation, we introduce the graphic representation, which is key for understanding the MSL measure. Then, in the subsection MSL Measure, we analyze the core of our work, the MSL measure. Finally, in the TriGen Algorith subsection, we briefly describe the TriGen algorithm.
Triclustering
Clustering techniques are applied to analyze gene expression data from microarray experiments. The dataset obtained from the experiment, D, contains genes and experimental conditions and clustering aims at finding subgroups of genes that share a behavior pattern according to their expression level. Biclustering appears as an evolution of clustering due to its ability to mine subgroups of genes and conditions from the data set D, where the genes exhibit highly correlated patterns of behavior under certain experimental conditions.9
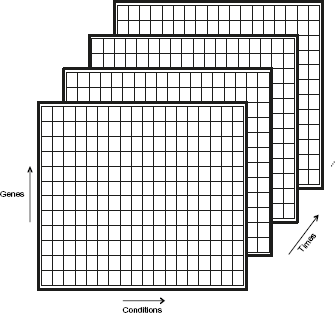
Triclustering emerges as an evolution of biclustering, taking into account the temporary evolution of genes under particular experimental conditions. In this way, from a dataset D obtained from a microarray experiment, which contains genes GD, conditions CD, and time points TD, we define triclustering as a technique that finds triclusters TRI1…,TRIn from D, where a tricluster TRI is formally defined as TRI = G × C × T, where G ⊆ GD, C ⊆ CD, and T ⊆ TD,17 ie, a subset of genes that contains information related to the behavior of some genes from dataset G under conditions C at times T. Figure 1 shows a tricluster with genes as rows, conditions as columns, and time as depth.
Tricluster representation.
Graphic representation
In order to explain the MSL measure, we define the graphic representation of a tricluster TRIxop, with x, o, and p being either genes G, experimental conditions C, or time points T, so that the x elements in TRIxop will be on X axis and o elements in TRIxop will be the outlines represented in as many panels as p elements in TRIxop indicates, as can be seen in Figure 2.
Graphic representation of a tricluster.
To visually analyze the behavior patterns of a tricluster TRI, we always consider three graphical views:
TRIgct (x = G, o = C, p = T): one panel for each time, genes on the X axis, the expression levels on the Y axis, and the lines of conditions as the outline.
TRIgtc (x = G, o = T, p = C): one panel for each condition, genes on the X axis, the expression levels on the Y axis, and the time lines as the outline.
TRItgc (x = T, o = G, p = C): one panel for each condition, times on the X axis, the expression levels on the Y axis, and the genes as the outline.
With TRIgct and TRIgtc, we can analyze how each gene expression level varies throughout conditions and times, respectively. TRItgc represents how each gene varies throughout time for each condition.
MSL measure
After analyzing the graphic representation of a tricluster, we describe our proposal: the Multi Slope Measure (MSL). MSL measures the differences among the angles formed by every series traced on each of three graphic representations taking into account TRIgct, TRIgtc, and TRItgc (subsection Graphic Representation). MSL takes into account the influence of neighboring time points. We can observe an example of TRItgc view of TRI = G {g1, g4, g7, g10C{c2, c5, c8} T{t0, t2t11} in Figure 3. We can see how each outline or gene forms a set of angles (two for this particular example) defined by each time point in the X axis for every panel or experimental condition.
Angles for TRItgc graphic view.
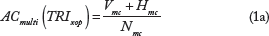
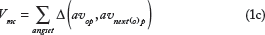
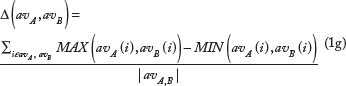
To calculate the MSL measure of a tricluster, we first perform the multiangular comparison term calculation. The multiangular comparison operation of a graphic representation xop from a tricluster TRI is defined in Equation 1a. We define ACmulti of a tricluster's graphic representation TRIxop as the average of the differences δ of angles vectors ang set (Equation 1b) of all outlines o for each panel p (Vmc in Equation 1c) and its equivalent for the rest of the panels (Hmc in Equation 1d), with Nmc being the number of differences made (Equation 1e). An angle vector of an outline o in a panel p is defined as a set of angles that are formed by the outline o taking into account every data point in the X axis (Equation 1f), each outline will have Number of X axis ticks – 1 angles as you can see in Figure 3. The difference δ between two angles vector avA and avB is defined as the average of the MAX – MIN (MAX being the maximum and MIN the minimum of two angles avA(i) and avB(i)) of each component (or angle) i of avA and avB (Equation 1g).
The ACmulti. term is based on several operations with avop angle vectors. These elements have been obtained based on concept of series (Equation 2a) so that a series Sop of a outline o for a panelp is a set of pair of values from the x axis (xi) and expression levels (elj) that form the outline. For each series Sop, the alpha angle is calculated as the spin of the arctangent of the slope of the line formed by (xi, eli) and (xnext(i), elnext(i)) points (Equation 2b). The spin operation of an angle showed in Equation 2c is the positive equivalent of this angle if it is negative.
To conclude, the MSL measure of a tricluster TRI (Equation 3) is the average of the angular comparison of the three graphic representations of the tricluster.
Following Figure 3, we show an example of ACmulti(TRLtgc) calculation in Figure 4. First, we arrange the example tricluster TRI so that for each condition (panel) we obtain a table with one row per gene (outline) and one column per time point (X axis). Second, in order to get each avgc (Equation 1f) of angset (Equation 1b), we use Equation 2b from Sgc series and obtain all angles of avgc vectors, and third, we use Equations 1c and 1d for Vmc and Hmc calculations, respectively, going through the av set in horizontal and vertical direction. Finally, we use Equation 1a to obtain the ACmulti(TRItgc) value. We will have to repeat this process twice more, once for each graphic representation TRIgct and TRIgtc, to obtain the MSL measure according to Equation 3.
ACmulti(TRItgc) example.
TriGen algorithm
In this section, we present the TriGen (Triclustering-Genetic based) algorithm,17 where the MSL measure has been embedded in order to test its effectiveness. TriGen applies a bio-inspired paradigm of an evolutionary heuristic, genetic algorithms, in such a way that finds a set of triclusters from gene expression datasets where the time is also a component taken into account in the experiment. This method mimics the process of natural selection by creating an initial population of individuals representing solutions that are crossed and mutated for a number of generations, with the best individuals in the population being finally selected. The MSL measure has been applied as the fitness function to assess the quality of the triclusters or solutions in the population. The flowchart of the TriGen algorithm can be seen in Figure 5. We now define the most important elements of the algorithm such as inputs, outputs, codification of individuals, and genetic operators.
TriGen algorithm flowchart.
Input: The TriGen algorithm has two input arguments:
D: A dataset containing the gene expression values from a microarray experiment containing genes DG, experimental conditions DC, and times DT. Therefore, each cell [i,j,k] from D where i ∊ DG, j ∊ DC, and k ∊ DT, represents the expression level of the gene i under the experimental condition j at time k.
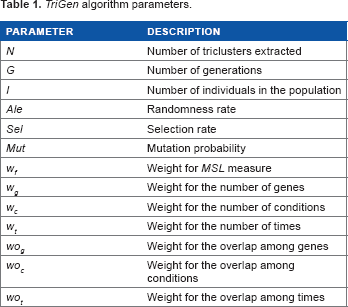
P: Set of parameters to execute the algorithm as described in Table 1. These parameters control the number of solutions or triclusters to find (N), the number of generations to execute (G), the number of individuals in the population (I), and the randomness factor they are generated with the initial population (Ale) as well as weights for the selection and mutation operators (Sel and Mut), weights to control the effect of the MSL measure (wf), the size of the triclusters (wg, wc, wt), and weights to control the overlap among solutions (wg, wc, wt).
TriGen algorithm parameters.
PARAMETER
DESCRIPTION
N
Number of triclusters extracted
G
Number of generations
I
Number of individuals in the population
Ale
Randomness rate
Sel
selection rate
Mut
Mutation probability
Wf
Weight for MSL measure
Wg
Weight for the number of genes
Wc
Weight for the number of conditions
Wt
Weight for the number of times
WOg
Weight for the overlap among genes
WOc
Weight for the overlap among conditions
WOt
Weight for the overlap among times
The parameters have been chosen after an exhaustive experimentation with all possible ranks of values. Each of the parameters has effect on the triclusters found: size, overlapping, exploration versus exploitation of the algorithm, etc. We now describe the effects of each of the parameters. In the execution of TriGen, each parameter is associated to a genetic operator, that is, G controls the whole evolutionary process so an increase in the number of generations implies a greater number of recombination of individuals. Therefore, an excessive increase in G may favor exploitation versus exploration in excess and the algorithm may return solutions that fall into a local minimum. I and Ale control the initial population creation, and when the number of individuals I is increased, a larger search space for the solutions is created so that an excessive increase can create a scatter search effect, and therefore, not return good quality solutions; an increase of the randomness rate Ale in the initial population has to be combined with the overlap control to make sure that a wide area of the space of solutions is initially covered. Sel controls the selection mechanism, and as a result, the crossover and a high Sel creates individuals with a low level of genetic recombination, favoring exploitation versus exploration, and if the parameter is increased in excess, the algorithm may fall into a local minimum. On the contrary, a high probability of mutation Mut favors exploration versus exploitation, and if increased in excess, we will end up with solutions in many areas of the search space but with low quality levels. w and wo combined with wf control the fitness function; w weights control the number of items in the solutions, an increase of these weights involves favoring solutions with more volume; the increase of wo weights leads to little or nonoverlapped solutions, an excessive increase can lead to the loss of interesting solutions. The content under Genetic Operators in the subsection TriGen Algorithm explains all operators and how a parameter variation affects the execution of TriGen.
Output: The TriGen algorithm's output will be a set of N triclusters, formally SOL = {TRI1, TRI2,…, TRIN}. Each TRIi ε SOL is composed of a subset of genes TRIG, conditions TRIC, and times TRIT from the input dataset D and has the best score in its population when evaluated under the MSL measure.
Codification of individuals: Each individual in the evolutionary process of the TriGen algorithm represents a tricluster, which is a potential solution. Therefore, an individual is represented as a subset of genes , a subset of conditions , and a subset of time points . The genes, conditions, and times subsets are extracted from the input dataset D. The algorithm selects time points as part of the tricluster but always keeping their order. All genetic operators are applied to each individual in the population, in each of these three subsets.
Overlapping control: We have designed an overlapping control mechanism to avoid overlapping among the tri-cluster solutions obtained. It is called Data Hierarchy and consists in maintaining the number of occurrences of genes, conditions, and time points of dataset D in each tricluster solution from less to most visited in such a way that, as we will explain in Initial Population in the subsection TriGen Algorithm, the initial population creation uses this structure to initialize population with the minimum overlapping. This Data Hierarchy is updated at every generation a new tricluster solution is selected.
Genetic operators:
Initial population: With the initial population method, I individuals are generated attending to the Ale randomness parameter. An Ale percent of individuals are created at random by two methods: half of the individuals are purely randomly generated, this is, a random subset of genes TRIG, conditions TRIC, and times TRIT are chosen from D and the other half is also randomly created but controlling that the values for the genes TRIG are contiguous, the values for the conditions TRIC are contiguous and the times TRIT are contiguous as well. The rest of the individuals are randomly created, but taking into account the previously created individuals to control overlapping of solutions according to Data Hierarchy structure (Overlapping Control in the subsection TriGen Algorithm).
Fitness function: Our proposed measure has been included as the genetic algorithm's fitness function FF(TRI) along with the size and the overlapping control. As can be seen in Equation 4, MSL has been combined with six other factors as a weighted average. Three of these factors and
measure the number of genes, conditions, and times of TRI(|TRIG, C, T|) relative to the dataset's size (|DG, C, T|). MSL is a minimizing fitness function, and we have to set 1 minus each amount proportion in order to favor TRI with greater sizes when wg, wc, or wt are increased. The other three members , and measure the repeated genes, conditions, or times elements of TRI in the set of already found solutions SOL (RG, C, T(TRI, SOL)) proportionally calculated supposing all of genes, conditions, or times are repeated in SOL (|TRIG, C, T|*|SOL|) in order to favor TRI with less overlapping when wog, woc, or wot are increased. Finally, the main member measures MSL (TRI) proportionally calculated to its maximum value 2π in order to favor TRI with smaller MSL when wf is increased. A default configuration for wf, wg, wc, wt, wog, woc, and wot consists in fixing wf to 0.8 and distributing 0.2 among wg, wc, wt, wog, woc, and wot.
Selection: Three groups of individuals are randomly selected sorted from lowest to highest according to the fitness function, and then a random selection from the three groups is made. The Sel parameter indicates how many of these individuals will pass to the next generation. The rest of the individuals until completing the next population (I – #Setected individuals) will be created based on the crossover operator.
Crossover: To complete the next generation, we create new individuals with this operator as follows: two individuals (parents, A and B) are combined to create two new individuals (offsprings, chitdl and chitd2). The parents are randomly chosen. Their genetic materials are combined by a random one-point cross in the genes TRIG, conditions TRIC, and time TRIT and mixing the coordinates in both children.17
Mutation: An individual can be mutated according to a probability of mutation, Mut. The mutation probability is verified for every individual, and if it is satisfactory, one out of nine possible actions is taken. These actions are add a new random gene to TRIG, add a new condition to TRIC, or add a new time point to TRIT, by removing a random gene, condition, or time, or by changing a random gene or condition for another that is randomly chosen. The election of these actions is also random. For the case of addition of a new gene, condition, or time, the operator checks whether the new member is already in the individual or not.
Results and Discussion
In this section, we show the results obtained by application of MSL as a fitness function embedded in the TriGen algorithm17 (see the subsection TriGen Algorithm).
MSL has been applied to four different datasets: one synthetically generated dataset and three real datasets. The real datasets are obtained from experiments with the yeast cell cycle (Saccharomyces cerevisiae),18 an experiment with mice (Mus muscutus) called GDS451014 and data from experiments with humans (Homo sapiens) called GDS4472.19 The last two data sets have been retrieved from Gene Expression Omnibus,33 a database repository of high-throughput gene expression data. All biological experiments examine the behavior of genes under conditions at certain times.
For the analysis of the triclusters obtained as the result of the experiments, we have developed a three-step process based on providing information related to correlation among expression values, the graphic properties of the representation of the values, and biological validation.
The correlation validation is based on the Pearson and Filon20 and Spearman21 coefficients. For every tricluster, we calculate the average of the correlation coefficients between each combination of gene, condition, and time for all genes. For instance, for a tricluster with four genes {1, 4, 8, 10}, two conditions {3 and 7}, and three times {1, 3 and 5}, we provide the Pearsons and Spearmans correlation coefficient average for values at the eight possible combinations, each having three time points: and .
The graphic properties of the representation are shown as described in the subsection Graphic Representation as a way to visually check how the gene patterns behave.
Finally, for the biological validation, we will show the GO terms22 related to the triclusters. We present a GO analysis table in which we include the most representative terms extracted by the Ontologizer software,34 each term associated to a P-value that denotes the relevance level of the term. In this type of studies, P-values are considered as relevant below 0.05 and are better when closer to 0. Regarding the GO project, it is a major bioinformatics initiative with the aim of standardizing the representation of gene and gene product attributes across species and databases. The project provides an ontology of terms for describing gene product characteristics and gene product annotation data. The ontology covers three domains: cellular component, the parts of a cell or its extracellular environment; molecular function, the elemental activities of a gene product at the molecular level, such as binding or catalysis; and biological process, operations, or sets of molecular events with a defined beginning and end, pertinent to the functioning of integrated living units: cells, tissues, organs, and organisms.
We have compared the results obtained to those from Gutiérrez-Avilés and Rubio-Escudero,23 where the fitness function was the MSR3D measure and also to the results in Gutiérrez-Avilés and Rubio-Escudero,24 where the fitness function was the LSL measure. The comparison has been made in terms of correlation and GO analysis. For each real experiment, we have compared the maximum, minimum, and mean Pearson's and Spearman's correlation index and the maximum, minimum, and mean P-value for each solution considered.
All experiments were executed on a multiprocessor machine with 64 processors, Intel Xeon E7-4820 2.00 GHz with 8-GB RAM memory. We have used Java to implement TriGen algorithm (and other ad hoc developments) and an R framework to create graphics and get dataset resources from GEO.33
We now analyze the results obtained in each of the four experiments.
Synthetic experiments
Synthetic data are widely used not only for testing the performance of microarray analyzing techniques14 but also in more general data mining publications.35 It has the advantage that the process that generated the data is well known and so one is able to judge the success or failure of the algorithm.36
In this work, we have used an application designed by ourselves to generate the synthetic data used in this experiment. We have executed the TriGen algorithm with the MSL measure over a synthetic dataset composed of 4,000 genes, 30 experimental conditions, and 20 time points whose expression levels were randomly generated by a cryptographic secure standard library Math3 provided by Apache Commons.37 In this dataset, we inserted 10 triclusters composed of 150 genes, 6 experimental conditions, and 4 time points, whose expression levels form a constant behavior pattern. These triclusters are located in random positions in the dataset.
To see the behavior of the MSL measure applied along with TriGen and also with the aim of analyzing the effect of the value of the parameters in the solutions, we have made executions setting N to 200 and varying other control parameters as follows: G ε {100, 200}, I ε {50, 100}, Sel ε{0.5}, Mut ε{0.2, 0.3}, Ale ε {0.3, 0.5}, wg ε {0.03, 0.05, 0}, wc ε{0, 0.01}, wt ε{0,0.01}, wog ε{0.04, 0.05}, woc ε {0,0.03}, and wot ε {0,0.03} (see Input in the TriGen Algorithm subsection for a detailed description of these parameters). The algorithm has been capable of finding between 94% and 100% of the inserted triclusters. There were no false positives or false negatives found. The application of the MSR3D along with the TriGen algorithm in the study by Gutiérrez-Avilés and Rubio-Escudero23 was capable of finding 91% to 95% and LSL24 obtained a matching ratio between 93% and 97% of the triclusters, so we can see in slight improvement when applying the MSL measure.
Yeast elutriation experiments
For this experiment, we have applied the TriGen algorithm with MSL measure to the yeast (Saccharomyces cerevisiae) cell cycle problem,18 specifically the Elutriation experiment. The yeast cell cycle analysis project's goal is to identify all genes whose mRNA levels are regulated by the cell cycle. The resources used are public and available in http://genome-www.stanford.edu/cellcycle/. Data have been normalized as part of the preprocessing. We have created a dataset Delu3D from the elutriation experiment with 7,744 genes, 13 experimental conditions, and 14 time points. Experimental conditions correspond to different statistical measures of the Cy3 and Cy5 channels while time points represent different moments of taking measures from 0 to 390 minutes.
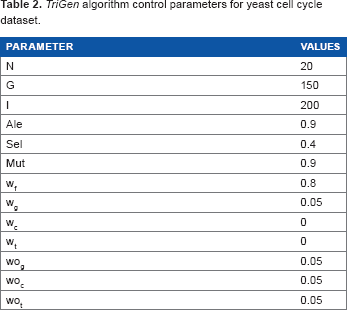
The parameter configuration used for this experiment is shown in Table 2. We set G and I values in order to obtain a default exploration of the solution space and Ale, Sel, and Mut provide us with a high random factor in population generation, low elitism in the next generation promotion, and high mutation factor, respectively. We favor solutions with a high number of genes setting wg to 0.05 and solutions with high variability in genes, conditions, and times thanks to wog, woc, and wot, set to 0.05. These configurations have been obtained as a result of a deep experimental study on the Delu3D dataset.
TriGen algorithm control parameters for yeast cell cycle dataset.
PARAMETER
VALUES
N
20
G
150
I
200
Ale
0.9
Sel
0.4
Mut
0.9
Wf
0.8
Wg
0.05
Wc
0
Wt
0
WOg
0.05
WOc
0.05
WOt
0.05
Regarding the correlation analysis, we can observe in Table 3 show Pearson and Spearman's values vary between [0.95,0.97] and [0.98,1], respectively, which implies a high correlation between genes series for every experimental condition through time points. These high values confirm us that the quality of the triclusters obtained from these experiments is very high in terms of correlation.
correlation results for triclusters from the yeast cell cycle dataset.
TRISOL
PEARSON
SPEARMAN
TRI1
0.97
0.98
TRI2
0.97
0.99
TRI3
0.96
0.99
TRI4,
0.96
0.98
TRI5
0.97
0.99
TRI6
0.96
0.99
TRI7
0.96
0.99
TRI8
0.96
0.98
TRI9
0.96
0.98
TRI10
0.96
0.99
TRI11
0.96
0.99
TRI12
0.95
0.98
TRI13
0.96
0.98
TRI14
0.96
0.98
TRI15
0.97
1
TRI16
0.96
0.98
TRI17
0.96
0.98
TRI18
0.96
0.99
TRI19
0.96
0.99
TRI20
0.96
0.98
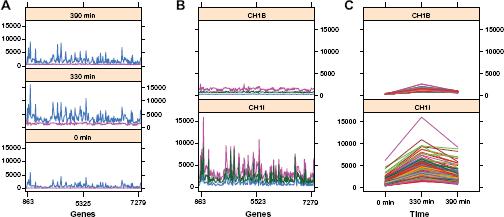
We can see the graphic representation of tricluster TRI11 in Figure 6. Only one out of the 20 triclusters obtained has been represented for legibility reasons. We can observe how TRI11 with 200 genes, 2 conditions, and 3 time points shows a coherent pattern through time points for CH1I and CH1B experimental conditions (TRIgct view, Fig. 6C). TRIgct (Fig. 6A) and TRIgtc (Fig. 6B) show how conditions vary for 0 minutes, 330 minutes, and 390 minutes for all genes and how times vary for CH1I and CH1B for all genes, respectively. In Figure 6A we can see that each of the two conditions vary in almost the same way for every time point. This can also be observed in Figure 6B but according to time variation for every experimental condition.
TRI11 graphic representations from yeast cell cycle results. (A) Sample curves, (B) time curves, (C) gene curves.
Finally, regarding the experiment biological analysis, we can see GO results of the biological annotations related to the genes selected in TRI11 (Table 4). We can see how three related biological processes have been annotated with TRI11 genes, these are cellular amide catabolic process (GO:0043605), allantoin metabolic process (GO:0000255), and catabolic (GO:0000256) process. These biological processes are related to a more general one called cellular amide metabolic process (GO:0043603) in which individual cells carry out the chemical reactions and pathways involving an amide. We can observe how two molecular functions as RNA-DNA hybrid ribonuclease activity (GO:0004523) and endonuclease activity with either ribo- or deoxyribonucleic (GO:0016893) have been annotated for TRI11 as well. Both groups of terms, biological processes, and molecular functions are related with the metabolic process of the cell. All terms annotated have a high level of statistical significance denoted by P-values in the [1.98E-09,1.01E-03] interval.
GO analysis for tricluster TRI11 found in the yeast cell cycle dataset.
ID
NAME
P-VALUE
GO:0043605
Cellular amide catabolic process
1.98E-09
GO:0000255
Allantoin metabolic process
1.17E-08
GO:0000256
Allantoin catabolic process
1.17E-08
GO:0004523
RNA-DNA hybrid ribonuclease activity
4.72E-05
GO:0016893
Endonuclease activity, active with either ribo- or deoxyribo nucleic acids and producing 5‘-phosphomonoesters
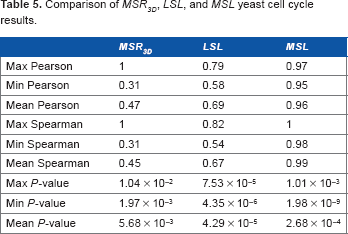
We can observe in Table 5 a comparison among MSR3D, LSL, and MSL measures according to the published Elutriation results published in the studies by Gutiérrez-Avilés and Rubio-Escudero23,24 Regarding correlation indexes, a clear improvement of MSL in relation to MSR3D and LSL can be observed as well as an improvement in terms of the P-value.
Comparison of MSR3D, LSL, and MSL yeast cell cycle results.
MSR3D
LSL
MSL
Max Pearson
1
0.79
0.97
Min Pearson
0.31
0.58
0.95
Mean Pearson
0.47
0.69
0.96
Max Spearman
1
0.82
1
Min Spearman
0.31
0.54
0.98
Mean Spearman
0.45
0.67
0.99
Max P-value
1.04 × 10⁻²
7.53 × 10⁻⁵
1.01 × 10⁻³
Min P-value
1.97 × 10⁻³
4.35 × 10⁻⁶
1.98 × 10⁻⁹
Mean P-value
5.68 × 10⁻³
4.29 × 10⁻⁵
2.68 × 10⁻⁴
Mouse GDS4510 experiments
In this experiment, we have used a dataset obtained from the GEO33 with accession code GDS4510 whose title is rd1 model of retinal degeneration: time course.14 In this biological experiment, the degeneration of retinal cells in different individuals of home mice (Mus musculus) is analyzed over 4 days just after birth, specifically on days 2, 4, 6, and 8. Data have been normalized as part of the preprocessing. We have formed our input dataset DGDS45103D with 22,690 genes, 8 experimental conditions (one for each individual involved in the biological experiment), and 4 time points. Each of the replicates has been treated as an independent condition.
The parameter configuration used for this experiment is shown in Table 6. We set G to a default value and I is increased in order to expand the exploration of the solution space, Ale, Sel, and Mut have been set to 0.5 in order to get a medium rate of randomness factor, elitism, and mutation rates, respectively. With this size and overlapping control, we use TriGen to find solutions with a high number and variability of time points. This configuration has been obtained as a result of an extensive experimental study over DGDS45103D dataset.
TriGen algorithm control parameters for mouse GDS4510 dataset.
PARAMETER
VALUES
N
20
G
150
I
500
Ale
0.5
Sel
0.5
Mut
0.5
Wf
0.8
Wg
0
Wc
0
Wt
0.1
WOg
0
WOc
0
WOt
0.1
According to Table 7, we can see how Pearson and Spearman's values vary between [0.54,0.96] and [0.56,0.9], respectively. Pearsons values fall in the [0.8,0.9] interval are predominant in most of the solutions as well as Spearman's ones. This fact implies a high correlation between gene series for every experimental condition through time points in most of the solutions of this experiment.
Correlation results for tricluster mouse GDS4510 dataset.
TRISOL
PEARSON
SPEARMAN
TRI1
0.93
0.9
TRI2
0.58
0.57
TRI3
0.92
0.89
TRI4
0.65
0.67
TRI5
0.61
0.65
TRI6
0.63
0.60
TRI7
0.54
0.62
TRI8
0.59
0.63
TRI9
0.63
0.65
TRI10
0.6
0.56
TRI11
0.95
0.9
TRI12
0.89
0.85
TRI13
0.93
0.89
TRI14
0.95
0.89
TRI15
0.95
0.9
TRI16
0.56
0.62
TRI17
0.93
0.87
TRI18
0.92
0.85
TRI19
0.94
0.89
TRI20
0.94
0.89
In Figure 7 we show three graphic representations of tri-cluster TRI10 composed by 50 genes, 2 experimental conditions, and 4 time points. In the TRItgc graphic representation, we can see how all genes form an almost perfectly coherent pattern through the four time points for all experimental conditions. This fact is reinforced when we observe TRIgct (Fig. 7A) and TRIgtc (Fig. 7B) graphic representations in which variation of expression levels in sample and time perspectives show coherent patterns.
TRI10 graphic representations from mouse GDS4510 results. (A) Sample curves, (B) time curves, (C) gene curves.
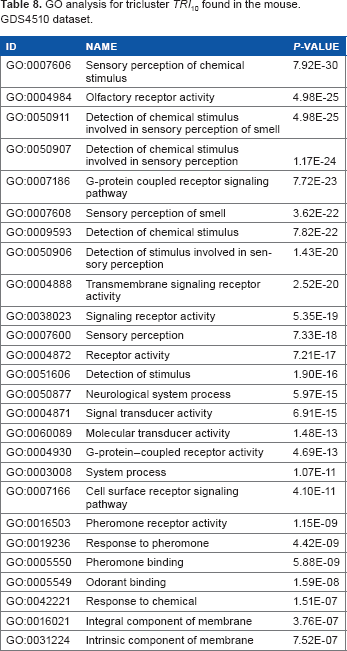
We can see the biological validity of TRI10 in Table 8. It reflects very good results with P-values in the [7.92E-30,7.52E-07] interval. Terms like olfactory receptor activity (GO:0004984), which is the molecular function that denotes the transmission of the signal from both sides of cellular membrane in order to initiate a change in cell activity due to detection of smell, has been annotated close to sensory perception of chemical stimulus (GO:0007606) and detection of chemical stimulus involved in sensory perception of smell (GO:0050911), which have a very low P-value, are biological processes that have olfactory receptor activity as a part of them. We can see how pheromone receptor activity (GO:0016503), that involves the effects of pheromone in cell activity, is related with G-protein-coupled receptor signaling pathway (GO:0007186) since it is a biological process whose pheromone receptor activity is part of this aforementioned term through G-protein coupled receptor activity (GO:0004930) term that has been annotated as well.
GO analysis for tricluster TRI10 found in the mouse. GDS4510 dataset.
ID
NAME
P-VALUE
GO:0007606
Sensory perception of chemical stimulus
7.92E-30
GO:0004984
Olfactory receptor activity
4.98E-25
GO:0050911
Detection of chemical stimulus involved in sensory perception of smell
4.98E-25
GO:0050907
Detection of chemical stimulus involved in sensory perception
1.17E-24
GO:0007186
G-protein coupled receptor signaling pathway
7.72E-23
GO:0007608
Sensory perception of smell
3.62E-22
GO:0009593
Detection of chemical stimulus
7.82E-22
GO:0050906
Detection of stimulus involved in sensory perception
1.43E-20
GO:0004888
Transmembrane signaling receptor activity
2.52E-20
GO:0038023
Signaling receptor activity
5.35E-19
GO:0007600
Sensory perception
7.33E-18
GO:0004872
Receptor activity
7.21E-17
GO:0051606
Detection of stimulus
1.90E-16
GO:0050877
Neurological system process
5.97E-15
GO:0004871
Signal transducer activity
6.91E-15
GO:0060089
Molecular transducer activity
1.48E-13
GO:0004930
G-protein-coupled receptor activity
4.69E-13
GO:0003008
System process
1.07E-11
GO:0007166
Cell surface receptor signaling pathway
4.10E-11
GO:0016503
Pheromone receptor activity
1.15E-09
GO:0019236
Response to pheromone
4.42E-09
GO:0005550
Pheromone binding
5.88E-09
GO:0005549
Odorant binding
1.59E-08
GO:0042221
Response to chemical
1.51E-07
GO:0016021
Integral component of membrane
3.76E-07
GO:0031224
Intrinsic component of membrane
7.52E-07
Regarding the comparison with MSR3D and LSL measures (see Table 9), we can see that MSL performs slightly better than MSR3D and very similar to LSL, which performs exceptionally well for this particular experiment, in terms of correlation indexes. In terms of GO analysis, we can see a marked improvement of MSL against MSR3D and the minimum P-value of the LSL measures.
Comparison of MSR3D, LSL and MSL GDS4510 results.
MSR3D
LSL
MSL
Max Pearson
1
1
0.95
Min Pearson
0.52
0.64
0.54
Mean Pearson
0.91
0.89
0.78
Max Spearman
1
1
0.9
Min Spearman
0.5
0.6
0.56
Mean Spearman
0.91
0.89
0.77
Max P-value
7.34 × 10⁻⁴
7.40 × 10⁻⁸
7.52 × 10⁻⁷
Min P-value
1.53 × 10⁻⁶
8.79 × 10⁻²¹
7.92 × 10⁻³⁰
Mean P-value
3.33 × 10⁻⁴
8.02 × 10⁻⁹
5.02 × 10⁻⁸
Human GDS4472 experiments
For this experiment, the DGSD44723D dataset has been built from source data obtained from GEO33 under code GDS4472 titled Transcription factor oncogene OTX2 silencing effect on D425 meduttobtastoma cell line: time course.19 In this experiment, the effect of doxycycline on medulloblastoma cancerous cells at six time points after induction for 0, 8, 16, 24, 48, and 96 hours has been analyzed. Data have been normalized as part of the preprocessing. DGSD44723D is composed of 54,675 genes, 4 conditions (one for each individual involved), and 6 time points (one per hour).
We can see the parameter configuration for TriGen used for this experiment in Table 10. We want to expand the search space setting G to 700 and I to 500 due to the size of the input dataset, we increase the random factor setting Ale to 0.8 and we combine low elitism with high-variability setting Sel to 0.2 and Mut to 0.9, respectively. Regarding size control, we can see how we want triclusters with a balance between a high number of genes, wg to 0.01, and a high number of conditions and times, wc to 0.045 and wt to 0.045, respectively. The overlapping control follows the same proportion with wog set to 0.01, woc set to 0.045, and wot set to 0.045 in terms of variability of genes, experimental conditions, and time points of the solutions.
TriGen algorithm control parameters for human GDS4472 dataset.
PARAMETER
VALUES
N
20
G
700
I
500
Ale
0.8
Sel
0.2
Mut
0.9
Wf
0.8
Wg
0.01
Wc
0.045
Wt
0.045
WOg
0.01
WOc
0.045
WOt
0.045
As regards the correlation analysis, we can observe in Table 11 how Pearson and Spearman's values vary between [0.47,0.96] and [0.45,1], respectively, and most of the solutions found have both index above 0.9; therefore, this is a good experiment in terms of correlation.
Correlation results for tricluster human GDS4472 dataset.
TRISOL
PEARSON
SPEARMAN
TRI1
0.96683677
1
TRI2
0.48750048
0.47676471
TRI3
0.47592126
0.47121212
TRI4
0.75202621
0.79373957
TRI5
0.95392167
1
TRI6
0.94749964
1
TRI7
0.74349846
0.80536153
TRI8
0.47685516
0.46931529
TRI9
0.95370964
1
TRI10
0.95102082
1
TRI11
0.94672151
1
TRI12
0.48325216
0.47366678
TRI13
0.72992209
0.80331134
TRI14
0.95754954
1
TRI15
0.95225892
1
TRI16
0.95262299
1
TRI17
0.95113522
1
TRI18
0.9536509
1
TRI19
0.47363796
0.45628145
TRI20
0.95549408
1
According to graphic representation, we show the tri-cluster TRI19 in Figure 8, which has 40 genes, 4 experimental conditions, and 5 time points. We can see a coherent behavior pattern for all genes through five time points for every experimental condition in the TRItgc graphic representation (Fig. 8C). In the TRIgct graphic representation (Fig. 8A), we can see a homogeneity variation of expression levels of all genes for all experimental conditions at each time point. We can also see this fact in TRIgtc graphic representation (Fig. 8B).
TRI19 graphic representations from human GDS4472 results. (A) Sample curves, (B) time curves, (C) gene curves.
We can see the biological analysis of TRI19 in Table 12 in which there is a set of terms annotated with P-value in [3.33E-60,5.99E-48] interval that is a very low rate of P-value; therefore, they are good biological results. We pay attention to term GO:0006614 named SRP-dependent cotranslational protein targeting to membrane that describes the targeting of proteins to a membrane that occurs during translation and it is related to another two biological processes annotated as well: cotranslational protein targeting to membrane (GO:0006613) and protein targeting to ER (GO:0045047). We also underline the GO:0019083 term named viral transcription that describes the process by which a viral genome is transcribed within the host cell that is closely related with viral gene expression (GO:0019080) biological process since the transcription process is part of the gene expression one. Finally, we can see how nuclear-transcribed mRNA catabolic process, nonsense-mediated decay, GO:0000184 term, is annotated beside nuclear-transcribed mRNA catabolic process (GO:0000956) and mRNA catabolic process (GO:0006402) whose biological processes define the first one.
GO analysis for tricluster TRI19 found in the human GDS4472 dataset.
ID
NAME
P-VALUE
GO:0006614
SRP-dependent cotranslational protein targeting to membrane
3.33E-60
GO:0006613
Cotranslational protein targeting to membrane
6.24E-60
GO:0045047
Protein targeting to ER
1.15E-59
GO:0022626
Cytosolic ribosome
2.83E-59
GO:0072599
Establishment of protein localization to endoplasmic reticulum
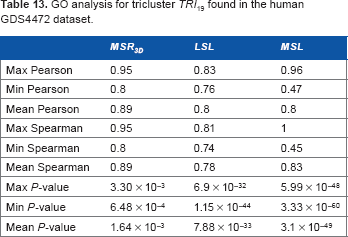
Regarding to the comparison between MSL and the other two measures, MSR3D and LSL (Table 13) we can see an improvement of MSL from MSR3D and LSL in terms of maximum correlation indexes, this fact is less perceptible in terms of minimum and mean correlation indexes. We can also appreciate a high improvement of MSL over MSR3D and LSL in terms of three considered aspects of P-value. Therefore, we can affirm that MSL globally improves the other two measures.
GO analysis for tricluster TRI19 found in the human GDS4472 dataset.
MSR3D
LSL
MSL
Max Pearson
0.95
0.83
0.96
Min Pearson
0.8
0.76
0.47
Mean Pearson
0.89
0.8
0.8
Max Spearman
0.95
0.81
1
Min Spearman
0.8
0.74
0.45
Mean Spearman
0.89
0.78
0.83
Max P-value
3.30 × 10⁻³
6.9 × 10⁻³²
5.99 × 10–48
Min P-value
6.48 × 10⁻⁴
1.15 × 10–44
3.33 × 10–60
Mean P-value
1.64 × 10⁻³
7.88 × 10⁻³³
3.1 × 10–49
Conclusion
In this work, we have presented a new evaluation measure for triclusters, MSL, which measures the homogeneity among genes, conditions, and times in a tricluster. We have analyzed how this measure has been formulated in detail and we have also applied it as a part of TriGen algorithm,17 which is our triclustering approach to mine triclusters from microarray experiments involving time, in order to assess the quality of the measure.
We have applied MSL embedded in the TriGen algorithm in four datasets: synthetically generated data, data from experiments with the yeast cell cycle (Saccharomyces cerevisiae) obtained from the Stanford University18 and two datasets retrieved from Gene Expression Omnibus,33 an experiment with mice (Mus muscutus) and an experiment with humans (Homo sapiens). All experiments examine the behavior of genes under conditions at certain times. The results obtained in real experiments have been validated by a three-way analysis: first analyzing the correlation among the genes, conditions, and times in each tricluster using two different correlation measures: Pearson20 and Spearman,21 second graphical analysis and finally providing functional annotations for the genes extracted from the GO project.22 We have provided a comparison among MSL and another two developed measures and LSL24 as well, showing that MSL performs better in terms of correlation coefficient and functional annotations.
Summarizing, regarding synthetic experimental results, we can observe how MSL combined with TriGen has been capable to extract from 94% to 100% of the triclusters. Regarding the real dataset results, they are also successful, with correlation values close to 1, good graphical representations in which you can distinguish very clear behavior pattern and GO validation with high levels of significance for the terms extracted (P-values smaller than 0.05 and very specific terms).
MSL is a tricluster evaluation measure created to assess the quality of triclusters extracted from temporal experiments with microarrays, but it can be used in other biologically related fields, for instance combining expression data with gene regulation information by means of substituting the time dimension by ChIP-chip data representing transcription factor-gene interactions what can provide us with regulatory network information. This proposal can also be applied to mine RNA-seq data repositories. Triclustering can also be applied to not biologically related fields, for instance, the seismic zonification of areas at risk of undergoing an earthquake.38 In this case, the third component does not identify time points but features associated to every pair of geographical coordinates of the area under study.
The next step in our researching work is to gather all aspects of tricluster experimental evaluation presented in Results and Discussion section, that is correlation, graphic representation, and biological validation, in one measure, and thus, improving the experimental workflow of triclustering.
Author Contributions
Conceived and designed the experiments: DG-A, CR-E. Analyzed the data: DG-A. Wrote the first draft of the manuscript: DG-A. Contributed to the writing of the manuscript: DG-A, CR-E. Agree with manuscript results and conclusions: DG-A, CR-E. Jointly developed the structure and arguments for the paper: DG-A, CR-E. Both authors reviewed and approved of the final manuscript.
References
1.
BrownP.O., BotsteinD.Exploring the new world of the genome with DNA microarrays. Nat Genet.1999; 21: 33–7.
2.
BajcsyP., HanJ., LiuL., YangJ.Advanced Information and Knowledge Processing: Data Mining in Bioinformatics. Part I. Survey of biodata analysis from a data mining perspective. Data Min Bioinf.2005; 1: 9–39.
3.
QuackenbushJ.Computational analysis of microarray data. Nat Rev Genet.2001; 2(6): 418–27.
4.
TanM.P., SmithE.N., BroachJ.R., FloudasC.A.Microarray data mining: a novel optimization-based approach to uncover biologically coherent structures. BMC Bioinformatics.2008; 9(1): 268.
5.
D'haeseleerP., LiangS., SomogyiR.Genetic network inference: from co-expression clustering to reverse engineering. Bioinformatics (Oxford, England).2000; 16(8): 707–26.
6.
Rubio-EscuderoC., Martínez-ÁlvarezF., Romero-ZálizR., ZwirI.Classification of gene expression profiles: comparison of K-means and expectation-maximization algorithms. In: Proceedings of the 8th International Conference on Hybrid Intelligent Systems. Publisher: IEEE, Barcelona. 2008: 831–6.
7.
HartiganJ.A.Direct clustering of a data matrix. J Am Stat Assoc.1972; 67(337): 123–9.
8.
Ben-DorA., ChorB., KarpR., YakhiniZ.Discovering local structure in gene expression data: the order-preserving submatrix problem. In: Proceedings of the 6th International Conference on Computational Biology.Publisher: ACM, New York. 2002: 49–57.
9.
ChengY., ChurchG.M.Biclustering of expression data. ISMB.2000; 8: 93–103.
10.
MadeiraS.C., OliveiraA.L.Biclustering algorithms for biological data analysis: a survey. IEEE/ACM Trans Comput BiolBioinform.2004; 1(1): 24–45.
11.
PontesB., DivinaF., GiráldezR., Aguilar-RuizJ.S.Improved biclustering on expression data through overlapping control. IJICC.2010; 3(2): 293–309.
12.
Bar-JosephZ.Analyzing time series gene expression data. Bioinformatics (Oxford, England).2004; 20(16): 2493–503.
13.
MahantaP., AhmedH.A., BhattacharyyaD.K., KalitaJ.K.Triclustering in gene expression data analysis: a selected survey. In: Proceedings of IEEE 2011 2nd National Conference on Emerging Trends and Applications in Computer Science, Publisher: IEEE, Shillong. 2011: 1–6.
14.
DickisonV.M., RichmondA.M., Abu IrqebaA.. A role for prenylated rab acceptor 1 in vertebrate photoreceptor development. BMC Neurosci.2012; 13: 152.
DivinaF., PontesB., GiráldezR., Aguilar-RuizJ.S.An effective measure for assessing the quality of biclusters. Comput Biol Med.2012; 42(2): 245–56.
17.
Gutiérrez-AvilésD., Rubio-EscuderoC., Martínez-ÁlvarezF., RiquelmeJ.C.Tri-Gen: a genetic algorithm to mine triclusters in temporal gene expression data. Neurocomputing.2014; 132: 42–53.
18.
SpellmanP.T., SherlockG., ZhangM.Q.. Comprehensive identification of cell cycle-regulated genes of the yeast Saccharomyces1 cerevisiae by microarray hybridization. Mol Biol Cell.1998; 9(12): 3273–97.
19.
BuntJ., HasseltN.E., ZwijnenburgD.A.. otx2 directly activates cell cycle genes and inhibits differentiation in medulloblastoma cells. Int J Cancer.2012; 131(2): E21–32.
20.
PearsonK., FilonL.N.G.Mathematical contributions to the theory of evolution. IV. On the probable errors of frequency constants and on the influence of random selection on variation and correlation. Philos Trans R Soc A.1898; 191: 229–311.
21.
SpearmanC.Correlation calculated from faulty data. Br J Psychol.1910; 3(3): 271–95.
22.
AshburnerM., BallC.A., BlakeJ.A.. Gene Ontology: tool for the unification of biology. The Gene Ontology consortium. Nat Genet.2000; 25(1): 25–9.
23.
Gutiérrez-AvilésD., Rubio-EscuderoC.Mining 3D patterns from gene expression temporal data: a new tricluster evaluation measure. Sci World J.2014; 2014: 1–16.
24.
Gutiérrez-AvilésD., Rubio-EscuderoC.LSL: a new measure to evaluate triclusters. In: IEEE International Conference on Bioinformatics and Biomedicine, IEEE, Belfast2014: 30–7.
25.
ZhaoL., ZakiM.J.triCluster: an effective algorithm for mining coherent clusters in 3D microarray data. In: Proceedings of the 2005 ACM SIGMOD international conference on Management of data -SIGMOD ‘05.New York, NY, USA: ACM Press, 2005: 694.
26.
JiangH., ZhouS., GuanJ., ZhengY.gTRICLUSTER: a More general and effective 3D clustering algorithm for gene-sample-time microarray data. In: BioDM, Springer, Berlin Heidelberg, Singapore. 2006: 48–59. [No. 60373019].
27.
LiuJ., LiZ., HuX., ChenY.Multi-objective evolutionary algorithm for mining 3D clusters in gene-sample-time microarray data. In: 2008 IEEE International Conference on Granular Computing, no. 60573057. IEEE, Hangzhou. 2008: 442–7.
28.
XuX., LuY., TanK-L, TungA.K.H.Finding time-lagged 3D clusters. In: 2009 IEEE 25th International Conference on Data Engineering. IEEE, Shanghai. 2009: 445–56. Shanghai.
29.
WangG., YinL., ZhaoY., MaoK.Efficiently mining time-delayed gene expression patterns. IEEE Trans Syst Man Cybern B.2010; 40(2): 400–11.
30.
SimK., AungZ., GopalkrishnanV.Discovering correlated subspace clusters in 3D continuous-valued data. In: 2010 IEEE International Conference on Data Mining. IEEE, Sydney, NSW. 2010: 471–80.
31.
HuZ., BhatnagarR.Algorithm for discovering low-variance 3-clusters from real-valued datasets. In: Data Mining (ICDM), 2010 IEEE 10th International Conference on. IEEE, Sydney, NSW 2010: 236–45.
32.
LiuY-C, LeeC-H, ChenW-C, ShinJ., HsuH-H, TsengV.S.A novel method for mining temporally dependent association rules in three-dimensional microarray datasets. In: Computer Symposium (ICS), 2010 International. IEEE, Tainan 2010: 759–64.
33.
BarrettT., WilhiteS.E., LedouxP.. NCBI GEO: archive for functional genomics data sets – update. Nucleic Acids Res.2013; 41(Database issue): D991–5.
34.
BauerS., GrossmannS., VingronM., RobinsonP.N.Ontologizer 2.0-a multifunctional tool for GO term enrichment analysis and data exploration. Bioinformatics (Oxford, England).2008; 24(14): 1650–1.
35.
PargasR.P., HarroldM.J., PeckR.P.Test-data generation using genetic algorithms. J Softw Test Verif Rel.1999; 6: 263–82.
36.
MendesP.GEPASI: a software package for modelling the dynamics, steady states and control of biochemical and other systems. Bioinformatics.1993; 9(5): 563–71.
Morales-EstebanA., Martínez-ÁlvarezF., ReyesJ.Earthquake prediction in seismogenic areas of the Iberian peninsula based on computational intelligence. Tectonophysics.2013; 593: 121–34.