
Abstract
Advances in high-throughput sequencing have generated a vast amount of transcriptomic data that are being increasingly used in phylogenetic reconstruction. However, processing the vast datasets for a huge number of genes and even identifying optimal analytical methodology are challenging. Through de novo sequenced and retrieved data from public databases, we identified 221 orthologous protein-coding genes to reconstruct the phylogeny of Ericales, an order characterized by rapid ancient radiation. Seven species representing different families in Ericales were used as in-groups. Both concatenation and coalescence methods yielded the same well-supported topology as previous studies, with only two nodes conflicting with previously reported relationships. The results revealed that a partitioning strategy could improve the traditional concatenation methodology. Rapidly evolving genes negatively affected the concatenation analysis, while slowly evolving genes slightly affected the coalescence analysis. The coalescence methods usually accommodated rate heterogeneity better and required fewer genes to yield well-supported topologies than the concatenation methods with both real and simulated data.
Introduction
Phylogenetic analysis is essential for understanding evolution and is used in various kinds of analyses and applications, such as comparative genomics, 1 character evolution,2–4 natural selection, 5 and crop breeding. 6 Twenty years ago, due to the limitations of sequencing technology, only a few genes were used for phylogenetic reconstruction. For example, the phylogeny of seed plants inferred by Angiosperm Phylogeny Group system was initially based on several chloroplast genes and nuclear ribosomal sequences. 7 Due to the limited number of genes used, the relationships within several orders, including Malpighiales, 8 Caryophyllales, 9 Ericales, 10 Lamiales, 11 and Zingiberales, 3 remained unclear.
Advances in next-generation sequencing have led to a massive increase in the amount of available genomic and transcriptomic data, which are being increasingly used in phylogeny reconstruction. As a cost-effective source of protein-coding gene sequence data, transcriptomic data have helped extend the data available for phylogenetic analyses from a few to hundreds or even thousands of genes. 12 Hence, substantial advances in animal phylogeny have been made in dozens of studies using the transcriptomic data to explore obscure relationships of annelids,13,14 arthropods,15–23 mollusks,24,25 echinoderms,4,26 and vertebrates.2,27–29 Trees resulting from such analyses often generate novel hypotheses regarding relationships among taxa. 24 Transcriptomic data have also been used in a few phylogenetic studies of plants, mainly in an attempt to resolve deep relationships of land plants, seed plants, or angiosperms.30,31 To our knowledge, the only analogous studies on relationships within plant orders or shallower levels have focused on Caryophyllales, 32 Vitaceae, 33 Leguminosae, 34 and Linum. 35
Although the vast amount of transcriptomic data available for nonmodel organisms provides potent new possibilities to explore phylogenetic relationships, analyzing the data poses major challenges. Most studies on broad phylogenies have been mainly based on concatenation methods, in which all considered genes are linked and analyzed as a single “supergene.”36,37 A drawback of concatenation methods is an underlying assumption that different genes have the same, or very similar, evolutionary histories. This could be highly inaccurate due to various processes, including horizontal gene transfer, 38 hybridization, 39 and incomplete lineage sorting.6,40 In order to overcome the shortcomings of concatenation methods, partitioned concatenation methods were subsequently developed, 41 which can account for differences in the branch length (ie, evolutionary rates) and parameters of substitution models among partitions.42,43 Thus, partitioned concatenation partly overcomes some disadvantages of unpartitioned concatenation although it still ignores topological heterogeneity, and has completely replaced unpartitioned concatenation in some studies. 23 It should be noted that in spite of the drawbacks of concatenation methods, they still frequently provide robust, well-supported trees,2,23,44 except when rapid species radiation has complicated the individual evolutionary history of the genes.40,45–47
Rapid species radiations characteristically result in phylogenetic trees with very short internal branches 48 ; therefore, ancestral polymorphism resulting from deep coalescence in the ancestral populations may be retained. 49 To deal with this incomplete lineage sorting, coalescence-based methods have been recently developed based on population genetic approaches.50,51 Coalescence-based approaches allow all the included genes to have different evolutionary histories; thus, species trees are reconstructed by analyzing the incongruent gene trees. 50 However, gene tree-based coalescence methods have been criticized for not fully exploiting sequence data because the analytical foundations are the gene tree topologies. 52 Moreover, gene tree topologies may contain high levels of stochastic error. 53 Partly for these reasons, coalescent methods have rarely been used for inferring plant phylogenies.30,46,54,55 However, their potential utility for exploring ancient radiations is still debated and warrants further tests.53,56
To obtain a fully resolved phylogeny for ancient radiation using hundreds or thousands of genes, it is also important to select appropriate characters for analysis. There are two main strategies for this, with highly distinct rationales. One is to use slowly evolving characters because they have few multiple substitutions, which cannot be typically explained in most evolutionary models and can generate erroneous phylogenetic signals, such as the well-known “long branch attraction.”4,46,57,58 Conserved genes are often less affected by saturation and easy to align, but slowly evolving characters usually contain limited information, leading to weakly supported nodes. The other main strategy is to select a rapidly evolving region because with dense species sampling most multiple substitutions can be detected and may provide valuable phylogenetic information.59,60 Some authors have noted that these two strategies are complementary because phylogenetic information in rapidly evolving regions could recover the shallow relationships, while information in slowly evolving regions could recover the deep relationships. 58
Ericales consists of 22 families and >11,500 species including many economically important species, for example, sources of the most widely consumed drink in the world after water (tea), nutritious fruits (eg, kiwifruits, blue berries, and persimmons), horticultural plants (eg, azaleas, primroses, and Impatiens balsamina), and various carnivorous plants. 7 While the monophyly of Ericales is well supported, the backbone of its phylogenetic tree has not fully been resolved due to a rapid species radiation in the order's early evolutionary history.10,61 Previous phylogenetic analyses support three major clades within Ericales consisting of: (i) Balsaminaceae, Marcgraviaceae, and Tetrameristaceae; (ii) Fouquieriaceae and Polemoniaceae; and (iii) the other Ericales families (the biggest clade). 62 Within the biggest clade, Actinidiaceae, Rodidulaceae, and Sarraceniaceae form a strongly supported subclade. 63 However, the exact relationships of the constituent families are uncertain, and widely differing conclusions regarding them have been presented.10,62,64–67
We have recently engaged in de novo sequencing of the Primula chrysochlora transcriptome, and several other projects have generated transcriptomic data for various members of Ericales,68–72 providing abundant data for phylogenetic reconstruction. Thus, in the study presented here, we combined our P. chrysochlora data with genomic or transcriptomic data retrieved for 10 other species (six other species in Ericales and four out-groups) from public databases. We have applied these data to explore relationships in Ericales using several concatenation-and coalescence-based analytical methods. Here, we discuss the relative merits of concatenation and coalescence for reconstructing ancient rapid radiative phylogenies, the potential for data partitioning to improve traditional concatenation methodology, and the optimal genes (slowly or rapidly evolving) for discerning genuine phylogenetic signals, as well as present the results.
Materials and Methods
Plant material, RNA isolation, and sequencing
Fresh leaves and whole flowers of a P. chrysochlora (Primulaceae) plant growing in Tengchong, Yunnan Province, China (25 21'05.74'N, 98 08'18.90'E, alt. 1810 m), were sampled and immediately stored in RNAlater solution (Takara Biotechnology Co., Ltd.) to preserve the RNA. Total RNA was subsequently extracted using a modified hexadecyltrimethylammonium bromide (CTAB) method. Quantified total RNA (concentration ≥100 ng/μL; rRNA ratio ≥1.5) was delivered to Macrogen, where cDNA sequencing was performed with the Roche GS FLX Titanium platform. Raw data were filtered for adapters, low-quality reads, or short reads below 40 bp. For P. chrysochlora, 428,716 cleaned reads with average length of 368 bp (range: 40–1044 bp) were obtained and deposited in the Sequence Reads Archive (SRA) database under accession number SRX1037980.
Data retrieval and assembly
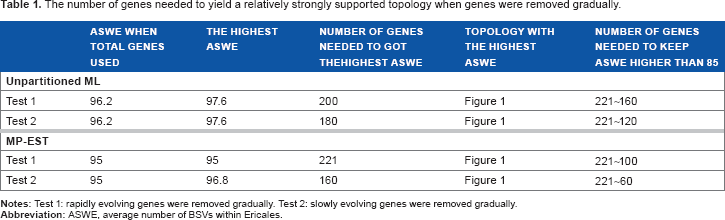
The number of genes needed to yield a relatively strongly supported topology when genes were removed gradually.
The cleaned reads from different experiments were separately assembled de novo using the GS de novo assembler package (http://www.454.com) with default parameters. Any reads that could not be assembled into isotigs and EST sequences were recleaned using SeqClean (http://www.tigr.org/tdb/tgi/software/) to obtain high-quality singletons. Obtained isotigs, singletons, and cleaned EST sequences were then reassembled using CAP3, 76 with default parameters into unigenes.
Ortholog identification, alignment, and filtering
We utilized HaMStR to identify orthologs among different species because it can cope with EST data more effectively than other possible tools. 77 After the core ortholog set was created, we sought matches to the core orthologs in the unigenes via both HMM and BLAST searches using HaMStR. Non-overlapping transcripts assigned to the same core ortholog were concatenated with “- concat” and “- representative” options.
We only included core orthologs shared by all the 11 focal species in subsequent analyses to reduce the influence of missing data. Due to the low coverage in the transcriptomic datasets (especially in the EST library of I. aggregata), the full length of many transcripts was not recovered, which also introduced missing data in the sequence alignment. Each ortholog was aligned by codons using MUSCLE 78 implemented in MEGA6 79 ; then manual correction was applied and ambiguous alignments were removed from each ortholog. One orthologous cluster was removed if at least one representative ortholog is shorter than 300 bp. We used BLAST searches against NCBI's nr database implemented in Blast2GO to assign function to orthologs. 80
Reconstruction of gene and species trees
For each gene, a gene tree was reconstructed using the maximum likelihood (ML) methodology with RAxML in parallel threads mode. 81 For nucleotide sequences, the GTR + G model was selected. Two thousand rapid bootstrap analyses were performed to assess the bootstrap support values (BSVs). 82 All the gene trees were rooted at C. acuminata because not all the gene trees could recover the monophyletic group of (C. acuminata, H. macrophylla). We also extracted 100 replicate bootstrap trees to use as the input for coalescence analysis.
After the alignment of each gene was concatenated, unpartitioned ML analysis was applied using RAxML in parallel threads mode with the GTR + G model. This was followed by partitioned ML analysis, in which we applied two strategies: one based on codon positions and the other based on genes. In each case, partitioning information was passed to RAxML via the -q parameter, and the data were analyzed under the GTR + G model for every gene or every codon position. We also extracted sites at each codon position and analyzed them separately with RAxML under the GTR + G model. In each case, 2000 rapid bootstrap analyses were performed to acquire BSVs. All estimated species trees were rooted using the monophyletic group of (C. acuminata, H. macrophylla).
We also applied the widely used coalescence method maximum pseudo-likelihood estimation of the species tree (MP-EST) for reconstructing species trees. 51 More specifically, 100 bootstrap replicate trees extracted earlier for each of the 221 genes were used to estimate species trees (with BSVs) in MP-EST as implemented at the STRAW web site. 83
Gene categorization and reconstruction
We categorized the genes into 11 equally sized groups, based on the total branch length of their gene trees, and designated as 1–11 (from shortest to longest total branch length). Thus, each group included 20 genes with a similar total gene tree branch length (except group 11, which included 21 genes). We conducted three tests on these groups of gene trees to assess the influence of evolutionary rates on the estimated species tree.
In Test 1, we successively removed the gene groups with the most rapid evolutionary rates from analysis, starting with group 11, until only group 1 was left. In contrast, in Test 2, we successively removed the groups with the slowest rates, starting with group 1, until only group 11 was left. In both of these tests, we estimated species trees by unpartitioned ML and MP-EST analyses every time a gene group was removed. Based on the results described later, we also conducted unpartitioned ML analysis with groups 3–10. To further assess the effects of differences in evolutionary rates, in Test 3, we created three subsets with 100 genes - designated as S (slow), M (medium), and R (rapid), including groups 1–5, 4–8, and 7–11, respectively - then conducted unpartitioned ML, partitioned ML, and MP-EST analyses with all three of these datasets.
Simulation
Nucleotide sequence data were simulated using the MCcoal program in bpp package.50,84 We specified an asymmetric tree ((((E, D), C), B), A) as an output as the phylogeny of Ericales is also an asymmetric tree. We set the population size parameter, 9, at 0.2. This value was much larger than that in all the previous simulations,46,51,85,86 allowing for the extraordinarily large amount of deep coalescence. We set divergence time parameters at 0.1, 0.09, 0.08, and 0.07, respectively, for ABCDE, BCDE, CDE, and DE to make the divergence times comparable to those estimated for the Ericales in this study. Three hundred genes with a length of 1000 bp were simulated using the GAMMA model, and 20 replicates were conducted. For each replicate, we repeated the phylogenetic analysis as described earlier for the Ericales. Briefly, genes were categorized into 15 groups according to the total branch length of the corresponding gene trees, the genes with rapidly evolving rates (Test 1) or slowly evolving rates (Test 2) were then removed successively, and ML and MP-EST analyses were conducted each time one gene group was removed. To evaluate the BSVs and accuracy simultaneously, we calculated average BSVs for each node by assigning positive BSVs to a correct node while assigning negative BSVs for an incorrect node.
Results
Data assembly
We acquired data from the P. chrysochlora transcriptome by 454 sequencing and retrieved genomic, transcriptomic, and EST data for 10 species, representing 6 other families in Ericales and 4 out-groups as described earlier. Following assembly (as summarized in Supplementary Table 1), orthologous searches, and further filtering, we obtained 221 putative orthologous genes shared by all the 11 species. Detailed information for each gene (including length, missing data, total branch length of ML trees, and predicted protein function) is shown in Supplementary Table 2. The total length of the concatenated supergene was 215,247 bp. The amount of missing data (including gaps) was unevenly distributed across species, from 0% for potato to 40% for I. aggregata. Thus, there was missing information for some parts of genes in various species because the sequencing coverage was incomplete, but no total lack of any gene in any species.
Phylogeny reconstruction of Ericales
Phylogeny reconstruction. Unpartitioned ML analysis of the concatenated nucleotide data resulted in a highly supported topology (Fig. 1), with BSVs of 100 for all except two nodes. The MP-EST analysis produced the same topology (Fig. 1), with BSVs of 100 for all nodes except one. In this topology, Cornales (C. acuminata, H. macrophylla) is at the base of asterids, and lamiids (represented by Solanum tuberosum) and campanulids (represented by L. sativa) form a clade that is sister to Ericales. Ericales is highly supported as a monophyletic group. Within Ericales, I. aggregata diverged first, successively followed by P. chrysochlora, D. kaki, C. sinensis, S. psittacina, V. corymbosum, and Actinidia chinensis. The position of P. chrysochlora was weakly supported in unpartitioned ML analysis but maximally supported in MP-EST analysis (with BSVs of 82 and 100, respectively). Within Ericales, only P. chrysochlora and I. aggregata were characterized by long branches compared with other species. The position of S. psittacina was not maximally supported in either unpartitioned ML or MP-EST analysis, with BSVs of 99 and 75, respectively.
The species tree yielded by unpartitioned ML analysis with our 221 genes.
Both partitioned ML analysis strategies (based on genes or codon positions) yielded the same topology as unpartitioned ML analysis (Fig. 1). Partitioned analysis based on genes increased BSVs for the positions of P. chrysochlora and S. psittacina (to 92 and 100, respectively), while partitioned analysis based on codon positions increased the BSV only for the position of P. chrysochlora (to 92). We also extracted and analyzed sites at each codon position separately (Supplementary Fig. 1). As expected, the branch lengths were longest for the third codon position and shortest for the second codon position (Supplementary Fig. 1). Accordingly, the third codon position data yielded the most strongly supported tree, and the second codon position data yielded the most weakly supported tree. In both cases, the topology was the same as that shown in Figure 1. The topology reconstructed using first codon positions differed slightly in the position of S. psittacina, which formed a weakly supported clade with V. corymbosum (Supplementary Fig. 1A). However, there were no well-supported conflicts among the topologies yielded by different codon positions. In contrast, different gene trees varied widely, so partitioned ML analysis refers to gene-based partitioned ML analysis hereafter.
Conflicts with previous studies. Although the relationships within Ericales have not been resolved yet, most previous phylogenetic studies of Ericales agreed to a topology of (Polemoniaceae, ((Ebenaceae, Primulaceae), (Theaceae, (Ericaceae, (Sarraceniaceae, Actinidiaceae))))) for the seven families included in this study.61,62 We obtained two findings that conflicted with the previous studies. First, we found that Sarraceniaceae was sister to (Actinidiaceae, Ericaceae) rather than Actinidiaceae according to unpartitioned ML analysis, partitioned ML analyses (using both strategies), and MP-EST analysis. However, the position of Sarraceniaceae was never fully supported (with a BSV of 100) in this study, except in the partitioned ML analysis. Second, according to all our analyses, Ebenaceae was sister to the monophyletic group (Theaceae, (Ericaceae, (Sarraceniaceae, Actinidiaceae))), and this relationship was strongly supported in several analyses (Fig. 1), not agreeing that Ebenaceae was sister to Primulaceae as suggested by Soltis et al. 61 In contrast, Primulaceae was characterized with a long branch in this study, and its position was consistently weakly supported in ML analysis. A long branch was also obtained for Polemoniaceae. Thus, the affinity between these two long branches requires further tests, partly because long branches are difficult to resolve in phylogenetic analysis. 15
Phylogenetic analysis after removing genes
To analyze the influence of gene heterogeneity, all the genes were categorized into 11 groups according to their evolutionary rates, and then we reconstructed the phylogeny by ML and MP-EST analyses as the gene groups were successively removed.
Influence of gene heterogeneity. We repeated unpartitioned ML analysis after each removal of a gene group (Table 1 and Supplementary Table 3). In Test 1, as groups of the most rapidly evolving genes were successively removed, the average number of BSVs within Ericales (ASWE) first rose and then declined. The ASWE was maximal, at 97.6, when 200 genes were left, and at least 160 genes were needed to keep the ASWE above 85. In Test 2, when the groups of most slowly evolving genes were successively removed, a similar pattern was observed. The ASWE was maximal, at 97.6, when 180 genes were left, and at least 120 genes were required to keep the ASWE above 85. Results of Tests 1 and 2 showed that fewer rapidly evolving genes than slowly evolving genes were required to reconstruct a well-supported topology and all species trees with ASWE >85 had the same topology, as that shown in Figure 1.
We also found that gene groups 1, 2, and 11 negatively influenced the ASWE in unpartitioned ML analysis. Thus, we excluded these three gene groups to form a new dataset (designated as ML-ex) and subjected it to unpartitioned ML analysis. This analysis produced a tree with the same topology, as in Figure 1, and ASWE of 96.8. Thus, using only 160 genes with medium evolutionary rates, we obtained the same topology (Fig. 1) as that generated using all the data. Moreover, the ASWE was higher when using the ML-ex dataset. These results show that the genes with particularly slow or rapid evolutionary rates negatively affected the BSVs yielded by the concatenation method. After excluding these genes, the topology remained the same and the ASWE was even higher than that for the tree generated using all the data.
We also repeated MP-EST analysis after each removal of a gene group (Table 1 and Supplementary Table 3). In Test 1, when groups of the most rapidly evolving genes were successively removed, the ASWE always declined. More specifically, it was consistently maximal (95) when all of the data were used, and at least 100 genes were required to keep it above 85. In Test 2, when groups of the most slowly evolving genes were successively removed, the ASWE first rose and then declined, peaking (at 96.8) when 160 genes were left, and at least 60 genes were needed to keep it above 85. The results of Tests 1 and 2 confirmed that fewer rapidly evolving genes than slowly evolving genes were required to reconstruct a well-supported topology and all species trees with ASWE above 85 had the same topology, as that shown in Figure 1. We also found that only gene groups 1–3 negatively influenced the ASWE. Therefore, only genes with particularly slow evolutionary rates negatively influenced the BSVs obtained using the coalescence method, and genes with particularly rapid evolutionary rates did not significantly affect them.
The earlier results demonstrated that gene heterogeneity influenced both the degree of support for reconstructed trees and the number of genes required for strong support. Genes with particularly rapid or slow evolutionary rates had negative effects on BSVs obtained using concatenation. However, only genes with particularly slow rates significantly impaired BSVs obtained using coalescence methodology. Fewer genes were needed to reconstruct a well-supported topology if they were rapidly evolving rather than slowly evolving and if coalescence rather than concatenation methodology was used.
Influence of genes with medium evolutionary rates. We tested whether the genes with medium evolutionary rates contained more phylogenetic information by creating three datasets with the same number of genes but with different evolutionary rates: designated as S (slow), M (medium), and R (Rapid). Unpartitioned ML analysis with datasets S or R yielded deviant topology with relatively weak support (Supplementary Fig. 2A and C). Unpartitioned ML analysis with dataset M yielded relatively strong support (ASWE, 86.6), but a new topology (Fig. 2A), differing from the one shown in Figure 1, with Sarraceniaceae sister to Theaceae. This relationship has not been found in previous published studies or any of our analyses described earlier. We further analyzed the three datasets with the partitioned ML method, which yielded the same topology, as shown in Figure 1 when using datasets M (Fig. 2B) and R (Supplementary Fig. 2D), with ASWE values of 87.8 and 90.8, respectively. The topology produced with dataset S by partitioned ML analysis was again deviant and weakly supported (Supplementary Fig. 2A). This suggests that taking into account gene heterogeneity can improve the topology and support of phylogenetic trees generated by unpartitioned ML (at least for our dataset). Dataset S did not contain enough information to reconstruct a well-supported tree by either the unpartitioned or partitioned ML method.
The species trees yielded with dataset M (100 genes with medium evolving rates).
MP-EST analysis with all three datasets (M, S, and R) yielded the same topology, as shown in Figure 1, with ASWE values of 85.2, 96, and 91.8, respectively (Fig. 2B and Supplementary Fig. 2B and D). Thus, as in the unpartitioned ML analysis, the support was strongest when dataset M was used in the MP-EST analysis. Therefore, for both unpartitioned ML and MP-EST analyses, the most strongly supported trees were obtained when using data for genes with medium evolutionary rates, suggesting that they are optimal for constructing species trees.
Simulation
To test the generalizability of the earlier results, we further conducted the abovementioned analyses with simulated data. For ML analysis with 300 genes used, 14 of 20 replicates supported the correct topology. Furthermore, only 2 of those 14 replicates supported the correct topology with <100 BSVs on the average (70 and 80). However, 6 of the 20 replicates recovered incorrect topologies with a strong support. By contrast, for MP-EST analysis, all the 20 replicates supported the correct topology. Only 6 replicates supported the correct topology with 100 BSVs on the average, and the average BSVs for 20 replicates was 90.
In the next step, we repeated unpartitioned ML analysis after each removal of a gene group (Supplementary Table 4A) in the simulated data. In Test 1, as groups of the most rapidly evolving genes were successively removed, we revealed the results in two situations based on whether the correct topology recovered with 300 genes. In the first situation (six replicates with correct topology not recovered), when rapidly evolving genes were successively removed, three replicates recovered the correct topology, but the other three did not. In the second situation (14 replicates with correct topology recovered), the average BSVs (see Materials and methods section for more details about the calculation) increased (or decreased first then increased) in three replicates. For all the 20 replicates, the average BSVs peaked (75.5) when using only 240 genes. In Test 2, when the groups of most slowly evolving genes were successively removed, the average BSVs never increased except one replicate, so the average BSVs was highest (68.4) when using all 300 genes.
In the last step, we repeated MP-EST analysis after each removal of a gene group (Supplementary Table 4B). In Test 1, as groups of the most rapidly evolving genes were successively removed, the average BSVs declined or did not greatly change in 17 of 20 replicates, so the average BSVs was highest (95.7) when using all 300 genes. In contrast, in Test 2, when the groups of most slowly evolving genes were successively removed, BSVs increased in at least 5 of 20 replicates. For all the 20 replicates, the average BSVs peaked (96) when using only 260 genes, although the peaking BSVs was not significantly larger than the BSVs (95.7) when all 300 genes were used. On an average, it needed at least 160 genes to recover the correct topology with relatively strong support (85) in MP-EST analysis.
The results of simulation largely reflected the results of empirical data. Rapidly evolving genes negatively affected unpartitioned ML analysis not only in BSVs but also in topology. In contrast, slowly evolving genes slightly affected MP-EST analysis, only in BSVs. The results of simulation also indicated that, in certain situations (three replicates), unpartitioned ML analysis produced an incorrect topology, regardless of the evolving rates and the number of genes. It suggested that biases did happen in ML analysis. In contrast, MP-EST analysis consistently recovered the correct topology with a relatively strong support in all replicates with at least 160 genes.
Discussion
Implications for relationships within Ericales
Numerous ancient rapid radiations contributed to the evolution of most extant species and are notoriously difficult to resolve because of various complexities, including deep coalescence, species extinctions, and homoplasy.48,87 In recent years, the availability of virtually unlimited transcriptomic data has allowed the resolution of many long-standing problematic species radiations in insects and land plants.23,30 Thus, we have applied transcriptomic data in addition to genomic data to explore the relationships within Ericales, which diversified with the emergence of several main clades within a short time. 10 More specifically, we acquired transcriptomic data for P. chrysochlora and retrieved a huge dataset for another 10 plant species. Through searches for orthologs and further filtration, we successfully identified 221 orthologous genes shared by all of these 11 species and fully resolved the phylogenetic family-level relationships in Ericales. The results confirmed that transcriptomic data contained valuable information for resolving ancient rapid radiations. Thus, although most transcriptomic data were not produced for phylogenetic analysis,68,69,72,73 they constitute a potent source of information for phylogenetic reconstruction.
In accordance with the previous findings, our results corroborated the early divergence of Polemoniaceae in Ericales.10,62 However, there was some concern that the relatively low coverage of the I. aggregata (Polemoniaceae) transcriptome might have led to some artifacts in this phylogenetic analysis. Although we could not test whether the position of I. aggregata was affected by the low coverage, we could test whether the relationships among other species were affected by it. To test this possibility, we excluded I. aggregata and reanalyzed our data (analyses not shown). We found that the relationships among other species were again the same, as shown in Figure 1, while BSVs increased a little. This results indicated that the influence of low coverage in I. aggregata was not likely to influence the relationships among other species in this study.
However, two conflicts between our results and those of previous researchers were identified, related to the position of Sarraceniaceae and the relationship between Primulaceae and Ebenaceae. Several important morphological features were not constant in Ericales, 62 making it difficult to find corresponding phenotypic synapomorphy for either hypothesis. Generally, differences in sampled genes or taxa are the main reasons for conflicts in phylogeny reconstruction. Accordingly, previous phylogeny reconstructions of Ericales were based on a few genes, which could lead to stochastic error, while we used up to 221 genes. Thus, our results are probably more robust, as several studies have shown that hundreds of genes are needed to fully resolve rapid species radiations6,40,88,89 and that both the resolution and support improve with increasing the number of genes used.33,40,46,90 A shortcoming of this study is the limited number of species being sampled (due to the limitations of data in the SRA database). However, simulations have shown that increasing the number of genes used improves the phylogenetic analysis more than increasing the number of taxa.40,91 Our results corroborated this conclusion because although only 11 species were included, the analyses provided new and apparently robust indications of relationships within the Ericales. Furthermore, as the abundance of available transcriptomic data increases, the sampling density can be correspondingly increased.
Implications for analysis methods
Partitioned and unpartitioned ML analyses. Partitioned concatenation has generally outperformed unpartitioned concatenation methodology in previous studies.18,92–94 Our results confirm that partitioning can improve not only the support but also the topology, especially when a limited number of genes are used (here: datasets M and R). Data partitioning has not been applied in most previous phylogenetic studies, probably mainly because of the additional complexity involved. The length of each gene must be entered before partitioned analysis, and if a large number of genes are included, this is extremely difficult without using custom scripts. Furthermore, we find that partitioned methods are more computationally time-consuming but did not improve the topology significantly when a large number of genes were used. In response to these problems, there have been rapid improvements in partitioned methods recently, including the emergence of several statistical approaches for identifying the optimal number of partitions,93–95 rather than simply the number of genes or codon positions.
Unpartitioned ML analysis and MP-EST analysis. There is a heated ongoing debate regarding the relative merits of concatenation and coalescence analyses.53,56 Concatenation has been criticized for underestimating the heterogeneity among genes and hence overestimating the nodal support.40,56 However, it is relatively straightforward, so it has been widely applied in the analyses of diverse kinds of taxa covering diverse time spans and generally yields the same results as coalescence analyses.2,44 In contrast, coalescence methods comprehensively address gene heterogeneity and can often resolve difficult phylogenetic problems in the anomaly zones that cannot be resolved by concatenation.45,47,96 Furthermore, a two-stage coalescence approach can be used to relieve the computational burden. 56 However, a major drawback is that the variance may be overestimated through attributing all conflicts to deep coalescence, resulting in tendencies to characterize nodes with weaker support and shorter branch lengths.53,56 In this study, when all the data were used, the concatenation and coalescence methods gave the same topology, suggesting that it is sufficiently robust for detection by multiple methods. Concatenation yielded a species tree with a stronger support than the coalescence methods, as the former tended to overestimate nodal supports or the latter underestimated them. However, results obtained after removing various groups of genes before analysis indicate that both methods are affected in differing ways by variations in evolutionary rates and number of genes used.
The influence of substitution rates on phylogenetic analysis. If the substitution model fails to correct for high levels of saturation in rapidly evolving sites, it can give misleading results in phylogenetic analysis, especially for deep relationships.97,98 In this study, after removing particularly rapidly evolving genes, both accuracy and support obtained from concatenation (the unpartitioned ML method) rose, but the support obtained from coalescence (the MP-EST method) was almost unchanged. Several other studies have also found that concatenation yields more correct and strongly supported topologies after the removal of rapidly evolving genes.46,57,92 Because rapidly evolving genes have no significant effect in coalescence analysis, it may provide consistent results with the sites of different substitution rates.46,54 Our results also showed that the coalescence method accommodated rapidly evolving genes better than the concatenation method and recovered the correct topology consistently.
Some authors regard slowly evolving genes as good phylogenomic markers, while others disagree.4,58,99 Several studies have shown that concatenation may yield a more correct species tree for deep relationships if only slowly evolving genes are used. 46 This is probably related to the low saturation in these genes. 46 However, after removing particularly slowly evolving genes in our study, the support values increased when using both concatenation (unpartitioned ML) and coalescence (MP-EST) methods. Nevertheless, the improvements were higher for coalescence, in which species trees are inferred from the gene trees. If there are only a few informative sites, the gene trees will be poorly supported or have high levels of stochastic error. 53 Thus, if all the conflicts among many poorly supported or erroneous gene trees are explained by deep coalescence, the resulting species trees will be misleading. 53 Accordingly, previous studies have found that removing poorly supported gene trees before coalescence analysis raises nodal support.55,91 Our results confirmed that uninformative or highly conserved genes decreased nodal support in coalescence analysis, however, did not change the topology.
Given the differences in the effects of rapidly and slowly evolving genes on phylogeny reconstruction, we suggest that the divergence of the molecular markers should ideally match the divergence among the studied taxa. In this study, better results were obtained using dataset M than when using datasets S or R in terms of both topology and support. Therefore, for exploring family-level relationships within Ericales, the divergence level is medium; genes with medium evolutionary rates are optimal for both coalescence and concatenation analyses.
The influence of gene number on phylogenetic analysis. Nodal support values always increase with the increase in the number of loci used.40,90 However, the number of loci needed to resolve the phylogeny of lineages has varied from study to study.6,33,40,88 Simulations have shown that the number of loci required is positively related to the speed and age of radiations and the number of taxa.40,48,89,100 It is also related to several features of loci applied, such as their information content, evolutionary rates, and base composition.46,56,101 In addition, our findings indicate that the complexity of analytical models used is negatively related to the number of loci needed to resolve the phylogeny. Accordingly, Zou et al found that more genes were needed to resolve the deep relationships in rice (Oryza) when using a simple maximum parsimony method than when an ML methodology was applied. 6 In a study on the phylogeny of green plants, Zhong et al found that the same topology could be obtained from the subsets of their data as well as the total dataset when using coalescence, but not when using concatenation. 55 Recently, Liu et al also found that coalescence analysis was able to recover correct topologies with <100 genes even when severe deep coalescence was involved, while concatenation analysis was more likely to produce incorrect results. 86 Our results showed that fewer genes were required for robust phylogenetic inference using coalescence analysis than concatenation analysis. More specifically, the unpartitioned ML method performed less well than the partitioned ML method, and the MP-EST method provided the best performance with the small datasets S, M, and R. The results of simulated data also indicated the MP-EST analysis could recover the correct topology with only 160 genes, but unpartitioned ML analysis could not when using as many as 300 genes in certain cases. This suggests that complex models have greater power for detecting patterns in limited information, provided they have appropriate settings, and that coalescence methods are more likely to provide correct indications of species trees for taxa that have been affected by ancient rapid radiations than concatenation methods. 56
Conclusion
Our phylogenetic analyses resulted in a robust, well-supported topology of relationships within Ericales, using both concatenation and coalescence methods. Two relationships we identified conflict with the previous findings. According to our topology, Sarraceniaceae is sister to (Actinidiaceae and Ericaceae) and not to Actinidiaceae, and Primulaceae and Ebenaceae do not form a single clade. Our results confirm that partitioning can improve traditional concatenation methods, in terms of both support and topology, especially when small datasets are used. Including rapidly evolving genes lower both accuracy and support in concatenation analysis, while including slowly evolving genes lower the support in coalescence analyses slightly. Coalescence analysis generally requires fewer genes than concatenation to produce a well-supported phylogeny.
Author Contributions
Conceived and designed the experiments: WW, H-FY, X-JG. Analyzed the data: LZ, X-JG. Wrote the first draft of the manuscript: LZ. Made critical revisions and approved the final version: X-JG. All the authors reviewed and approved the final manuscript.
Supplementary Material
Supplementary Figure 1
The species trees yielded by unpartitioned ML analysis with every codon position.
Notes
(
Supplementary Figure 2
The species trees yielded with dataset S (100 genes with slowlyevolving rates) and dataset R (100 genes with slowlyevolving rates).
Notes
(
Supplementary Table 1
List of taxon sampling and summary of assembly for this study.
Supplementary Table 2
The detailed information of 221 orthologous genes used in this study.
Supplementary Table 3
The changes of BSV and topology when genes were removed gradually.
Supplementary Table 4
The changes of average BSVs when genes were removed gradually in simulation study.