
Abstract
The combined therapy of pegylated interferon (IFN) plus ribavirin (RBV) has been for a long time the standard treatment for patients infected with hepatitis C virus (HCV). In the case of genotype 1, only 38%–48% of patients have a positive response to the combined treatment. In previous studies, viral genetic information has been occasionally included as a predictor. Here, we consider viral genetic variation in addition to 11 clinical and 19 viral populations and evolutionary parameters to identify candidate baseline prognostic factors that could be involved in the treatment outcome. We obtained potential prognostic models for HCV subtypes la and lb in combination as well as separately. We also found that viral genetic information is relevant for the combined treatment assessment of patients, as the potential prognostic model of joint subtypes includes 9 viralrelated variables out of 11. Our proposed methodology fully characterizes viral genetic information and finds a combination of positions that modulate interpatient variability.
Keywords
Introduction
Hepatitis C virus (HCV) causes a disease that affects the human liver in more than 185 million people worldwide, 170 millions of whom are estimated to be chronic patients with increasing risk of developing cirrhosis and cancer of the liver.
1
The World Health Organization (WHO) estimates that between 3 and 4 million people are infected each year and about 70% of them will develop chronic hepatitis.
2
HCV belongs to the genus
Despite several strategies against HCV being deve-loped, 5 the combined therapy of pegylated interferon (IFN) plus ribavirin (RBV) has been for a long time the standard treatment for patients infected with HCV. IFN treatment is effective in 39% of patients, 6 but when combined with RBV, it is effective in more than 60% of patients. 7 However, there are differences in the response to treatment among the viral genotypes. In the case of genotype 1, about 48% of patients have a positive response to the combined treatment, 8 but in the case of genotypes 2 and 3, it is about 80%. 7 Moreover, the cost of HCV treatment is high, 9 it has numerous side effects, and it might not be appropriate for some patients. 10
The selective pressure of drugs, the high replication rate of HCV, and its low replication fidelity are the main viral causes of treatment resistance. It is estimated that, on average, a nucleotide change is produced per replication cycle. 11 The identification of specific mutations and genetic patterns responsible for clinical phenotypes would improve diagnosis and treatment of patients. 12 Some studies have revealed that HCV's genetic variability contributes to its escape from the patient's immune response.13,14
HCV variability is not distributed evenly along its genome, and it affects differently to treatment in each genome region. 15 It has been established that the greater the immune pressure in a region, the higher the genetic variability, 16 and, therefore, most studies of treatment–variability relationship have focused on these genome regions. On the other hand, it has been suggested that it is the overall genome variability that influences treatment response. 17
Treatment response
Different HCV treatment response types have been established depending on the number of weeks until HCV-RNA levels in serum or plasma are not detectable.
7
A rapid virological response (RVR) appears at treatment week 4, an early virological response (EVR) appears at treatment week 12, an end-of-treatment response (ETR) appears at the end of 24 or 48 weeks of treatment, and a sustained virological response (SVR) appears at 24 weeks after cessation of treatment. It has been observed that the latter type of response depends mainly on the viral genotype.
18
In the case of HCV genotype 1, patients treated during 48 weeks have an SVR rate of 38%–48%.
8
On the other hand, a patient is considered a
Personalized therapy of HCV infection is a common practice due to the diversity of disease progression. 19 Identifying those patients that will respond or not to the treatment before starting it would increase therapeutic efficacy and reduce personal suffering. Viral, environmental, treatment, and host factors play important roles in the outcome of HCV infection and treatment response.20–22 Several studies on treatment–outcome prediction have taken into account factors measured before treatment.23–27 In general, these studies take into account variables that describe the patient from clinical (alanine transaminase levels, viral load in serum, kidney biopsy, etc) and demographic (age, sex, habits, etc) points of view and also include some viral variables such as genotype, core and interferon sensitivity determining region (ISDR) region substitutions, and some variability parameters of the E1E2 region. It has been shown that the most consistent factors with treatment outcome are the viral genotype and viral load. 28
Phylogenetic predictors
A methodology to detect candidate genetic polymorphisms influencing clinical outcome from pathogen genomes 29 uses well-supported clades in a phylogeny as statistical predictors. Differences between clades were not well defined at the viral subtype level in our dataset; therefore, the statistical power of the previous methodology was diluted. Here, we propose an alternative methodology that overcomes the lack of statistical support at the phylogenetic subtype level but considers major determinants of genetic variation in the viral genome to help in the prediction of treatment response.
Materials and Methods
Clinical and epidemiological data were retrieved together with viral sequences from the local epiPATH bioinformatics platform. 30
Patients
Serum samples were obtained from 49 patients infected with HCV genotype la (17 patients, of which 11 had a positive response and 6 had a negative response) and genotype 1b (32 patients, of which 12 had a positive response and 20 had a negative response).31,32 In summary, our sample included 23 patients with a positive response and 26 patients with a negative response. All patients provided written consent to be included in the study, which was approved by the corresponding ethics committees of the institutions involved (Hospital General de Valencia, Hospital Clínico Universitario de Valencia, and Hospital General de Alicante). The research was conducted in accordance with the principles of the Declaration of Helsinki.
Treatment response assessment was done by the institutions involved with the following criteria:
The following demographic, clinical, and treatment variables were included in this study (Table 1): age, sex, Knodell index, 33 the ratio between Glutamic-oxaloacetic transaminase and Glutamic-pyruvate transaminase (GOT/GPT) serum levels, alanine transaminase (ALT) serum levels, treatment duration, completed treatment, number of treatment, IFN dose and RBV dose.
Demographic, clinical, and treatment factors.

HCV sequences
Host's immune pressure affects HCV variants but not equally through all the viral genome regions. 32 Two of the most studied regions in relation to genetic variability and treatment response are the E1E2 and NS5A viral regions. Independently of the genotype, viral factors included in our study were calculated using a high number of partial sequences from both regions described elsewhere 34 to capture the amount of variability of the viral quasispecies. Specifically, we used 100 sequences per patient of 472 nucleotides from the E1E2 region (nucleotides 1310–1781 of HCV genome reference sequence with accession number D50481), which includes three hypervariable regions (HVR-1, HVR-2, and HVR-3) but does not include the E2-PePHD region. Regarding the NS5A region, we used between 25 and 96 sequences per patient of 743 nucleotides (nucleotides 6742–7484 in the HCV genome reference sequence), which includes the ISDR, protein kinase R binding domain (PKR-BD), and variable region 3 (V3) regions that have been related to the combined treatment outcome. 35 Therefore, viral genome variability from about 7,500 sequences were summarized in the viral factors.
RNA extraction, reverse transcription, amplification, cloning, and sequencing, were explained in detail elsewhere. 36 Briefly, after viral RNA extraction (High Pure Viral RNA Kit; Roche, Mannheim, Germany), reverse transcription reactions were performed with random hexadeoxynucleotides in order to prevent any bias during reactions due to unspecific oligonucleotides. Amplified DNA products for each region were purified with High Pure PCR product Purification Kit (Roche) and directly cloned into EcoRV-digested pBluescript II SK (+) phagemid (Stratagene, Heidelberg, Germany). Plasmid DNA was purified with High Pure Plasmid Isolation Kit (Roche). Cloned products for E1E2 region or NS5A region were sequenced using vector-based primers KS and SK (Stratagene).
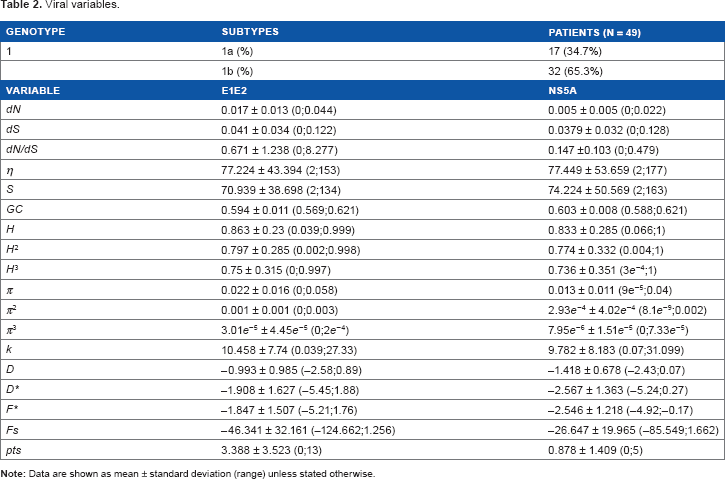
The following intra-patient viral variables per region were included in this study (Table 2): genotype, number of non-synonymous substitutions per non-synonymous site (
Viral variables.
Sequence similarity
In addition to population and evolutionary viral parameters, we obtained a sequence similarity measure at the molecular level. We used a
Statistical methodology
The treatment response was modeled using a logistic regression with 49 patients and 66 variables, including viral, demographic, and clinical data. We applied two methodologies in obtaining the regression model: (a) using variable subgroups, and (b) using all variables together. In an epidemiological context, logistic regression coefficients are interpreted as the odds ratio (OR) logarithm, ie, the effect of a unit of change in its corresponding variable on having a positive treatment response. OR is an association measure between the treatment outcome and the variables included in the regression model.
In the subgroup-based method (a), we created four groups of variables depending on which environment they were related to: patients, E1E2 region, NS5A region, and MCA dimensions. Then, a subgroup-based model was balanced among different treatment response factors. It was obtained following a generalized linear model (GLM) approach with a stepwise selection process in R using a logit transformation. First, we applied the following methodology to each subgroup of variables. We generated a
Once the subgroup-based models were obtained, we used them to predict the treatment outcome of three datasets: (1) the 49 patients used to obtain the models, (2) 8 new patients with complete clinical information, and (3) 10 new patients with some missing clinical factors which were estimated following four methods: the expectation-maximization algorithm (EM) implemented both in R and SPSS, mean substitution, and SPSS regression estimation. Predictions were made in R using the corresponding subgroup-based model, and prediction results were compared with the observed treatment outcome.
In the all-variables method (b), we applied the LASSO methodology
42
implemented in R also to genotypes la and lb jointly and separately. The LASSO method selects variables penalizing regression coefficients so that, if the coefficients are not greater than a given threshold, the corresponding variables are not included in the model. This method is also used to study how subgroup variables are affecting each other. We used minimum estimated
Results
Subgroup-based models
The best model obtained for HCV subtypes la and lb combined (AIC = 24) included the following parameters: treatment duration and ALT levels from the patients’ variables subgroup; some parameters related to the NS5A region subgroup, including
Subgroup-based model of 1a+1b HCV genotypes.

With respect to the best model obtained for subtype la separately (AIC = 8), the following parameters were included:
The goodness of fit of the best models was quite good despite the low sample size (Table 4). All predictions were correct using patients included in the development of prediction models (test dataset), and about 66%–70% of predictions were correct using a new dataset of patients: 6 new patients for the best model of subtype la, 9 new patients for the best model of subtype lb, and 10 new patients for the joint subgroup-based model. The selection of new patients for each validation dataset was performed taking into account the parameters included in each model, in such a way that not all the patients from separate subtypes had information about parameters required in the combined subtypes model. Therefore, the number of new patients used in the validation dataset of the combined subtypes model was lower than that of the separate subtypes model.
Goodness of fit from response predictions.

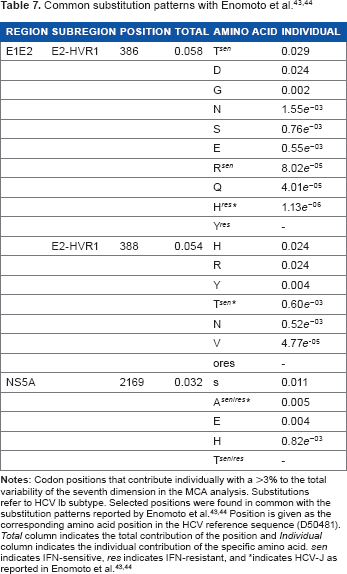
After obtaining the dimensional variables in the final models, we tried to find positions that modulate interpatient variability. We found that, in the NS5A region, the 11th dimension retained more than 95% of the variability in 10/69 polymorphisms of subtype la and in 100/127 of those in subtype lb. With regard to the E1E2 region, the seventh dimension retained more than 95% of the total variability in 27/65 polymorphisms of subtype la and 44/93 of lb polymorphisms. A summary of the positions that contribute with more than 3% individually can be found in Tables 5 and 6. We did not find a clear relationship between the type of amino acid in each position and treatment response (results not shown). Nevertheless, when comparing the positions with the highest individual contribution to global variability with the substitution patterns reported by Enomoto et al.43,44, we found that IFN-sensitive amino acid substitutions in 386 and 388 codons of 1b E1E2 region had a greater variability contribution than IFN-resistant ones (Table 7).
Contribution of amino acid positions to the total variability of NS5A region.

Contribution of amino acid positions to the total variability of E1E2 region.

All-variables models
The main disadvantage of the subgroup-based approximation is that the influence between the parameters of different subgroups is not evaluated. Therefore, we applied a secondary methodology to check the influence between all variables included in this study. We used minimum

Parameter estimates based on the LASSO method for the HCV subtypes 1a+1b combined.
LASSO-based model of 1a+1b HCV genotypes.

Discussion
The aim of this study was to identify candidate baseline prognostic factors that could be involved in the response of patients infected with HCV subtypes la and lb to combined treatment with IFN and RBV. Although HCV drug therapies have experienced a recent change with the availability of new antiviral drugs, 5 the time required to design and conduct treatment–response studies led us to outline a retrospective study with data previously generated in our group.31,32 We used treatment and patient variables along with more viral variables than similar previous studies.23–27 A new viral factor included was a multidimensional measure of sequences similarity that accounts for inter-patient viral variability. The hypothesis based on which this study was designed is that the integration of treatment response with viral sequences data would provide new insights into the interaction between different viral genomic regions and the treatment outcome, which eventually would improve our understanding of the viral evolution role towards patient therapy. In this sense, ourproposed methodology could be applied in future studies, which include the recently developed drugs.
Diferent models were obtained with two distinct methodologies (Table 3, Supplementary Tables 1 and 2 with subgroupbased methodology; and Table 8 with LASSObased methodology). The main difference between the two methods is that the LASSO method studies how subgroup variables affect each other. Results from LASSObased method demonstrate that variables included belong to different groups defined in subgroup-based methodology. Therefore, it can be concluded that there is no relevant influence between subgroups of variables. The subgroup-based method weights all subgroups equally and evaluates parameters thoroughly.
Subgroupbased model for both viral genotypes is balanced regarding variable subgroups, because it includes variables from the different subgroups defined for this methodology (Table 3). It includes treatment duration and ALT levels as patient variables. The current recommended duration of treatment for genotype 1–infected patients is 48 weeks, 7 although an extension to 72 weeks in patients without RVR has been proposed 46 and a reduction to 24 weeks in those patients with RVR. 47 Before treatment, ALT levels could represent the patient's immune system activity, as they include the elimination of infected cells by natural killer (NK) cells and cytotoxic T lymphocytes (CTL).48,49 The fact that ALT levels appear in the model could indicate that the higher the immune activity, the more effective the treatment. In this respect, ALT levels have also been obtained in other models.24,27 Nevertheless, it has been shown that the SVR rate in patients with normal levels of ALT is equivalent to patients with higher ALT levels 50 and there are other factors that could influence before-treatment ALT levels such as an imbalance of fatty acids and carbohydrates metabolism, 51 alcohol abuse, 52 and other drugs. 53
Sequence similarity measures at the molecular level are obtained in our results. NS5A 11th and E1E2 7th dimensions account for specific amino acids in certain sequence positions. There has been extensive discussion about the relationship between treatment response and mutations in both regions. There is a correlation between treatment response and NS5A substitutions in Japanese patient cohorts,54,55 but it has not been reported in European56,57 or American patients. 58 However, some European studies have found a correlation between the ISDR sequence of genotype lb and treatment response.59,60 After a long controversy, a correlation between NS5A's ISDR region and treatment response has been reported in three different meta-analyses61–63 and in more recent studies.64,65 Moreover, substitutions in other NS5A regions seem to be related to treatment response,35,65,66 and recently an association between an SVR and combined mutations in NS5A and core regions has been shown. 67
With regard to the genetic variation in the E1E2 region, some studies have found no relationship between the E2-PePHD region and treatment response because it is a highly conserved region and its variability levels do not differ between responder and non-responder patients,35,68 although some studies have found this relationship.69,70 Despite the fact that the E2-PePHD region was not included in our study, we found that some originally reported IFN-sensitive codon substitutions 43 had greater contribution to the total variability than IFN-resistant in specific E2-HVR1 positions (Table 7). An interesting aspect of our results is that, in addition to including sequence similarity variables in the final la+lb HCV genotype subgroup-based model, we also obtained the interaction of both NS5A 11th and E1E2 7th dimensions. This result could indicate that a joint substitution profile of both regions might increase the chances of responding to treatment. In this respect, a correlation between the number of mutations in the E2 and ISDR regions has been found 70 ; and another study obtained significant results for the correlation between nucleotide diversity of both E1E2 and NS5A regions. 34 A possible explanation of these observations could be that variants in both viral regions interact in an epistatic way due to the functional and/or structural relationship between them, as it has been previously suggested with E2, NS2 y NS5A regions. 71
Some variables related to the viral response to selection were included in the joint subgroup-based model for HCV subtypes 1a+1b. This is the case for the rate of synonymous substitutions (
Intra-patient viral variability factors that are included in the final 1a+1b HCV genotypes subgroup-based model are E1E2
Models obtained for la and lb genotypes separately are completely different (Supplementary Tables 1 and 2). Variables included in genotype la results are related to viral polymorphisms, but variables obtained for genotype lb are related to treatment, viral polymorphisms, and sequence similarity measures. The latter variable appears also in the model for both viral genotypes but not in the la model. In this sense, a significant correlation between ISDR mutations and treatment response has been observed in lb but not in la patients. 60
It is not always easy to provide a biological explanation when obtaining models under statistical criteria. We have provided a biological interpretation for every variable included in the final 1a+1b HCV genotype subgroup-based model; however, all variables should be considered together in the interpretation of our results. The methodologies that we used in this study include variables depending on their statistical significance; and because of high standard errors in the subgroup-based methodology, more tests would be necessary before applying these results to personalized therapy. Moreover, coefficients and OR values shown are the final result from the complete statistical methodology applied and should not be interpreted as their final individual significance. In this respect, we have used statistical methods for the identification of relevant candidate prognostic factors for HCV treatment response and not for the quantification of their individual effect in treatment response.
Nevertheless, our results indicate that viral genetic information is essential for the IFN–RBV combined treatment assessment of patients. In this sense, identifying a profile of combined mutations along viral genome regions that modulate treatment outcome could help treatment management, reducing costs and side effects. In general, our methodology can be applied to identify different joint-substitution patterns that could arise comparing the new HCV therapies that are currently being developed, eg, different patients, drug combinations, different time points of the treatment, in order to assess the best therapy approach for each case. Moreover, it could also be applied in the study of different viruses as well as in co-infections.
Conclusions
Population and evolutionary parameters quantify genetic sequences in terms of variability and its functional effect. In a high replication rate and a low replication fidelity scenario such as RNA viruses, the action of selective pressures could modulate the treatment response. Therefore, the relevance and interest of studying viral populations under an evolutionary perspective has a direct application on therapy improvement. As far as we know, population and evolutionary parameters together with the complete sequence variability have not been used before to study HCV treatment response.
In our study, we have found that these kinds of parameters are relevant prognostic factors, as they have been included in the best prognostic models obtained from different datasets. The best prognostic model of la and lb joint subtypes includes 9 out of 11 variables related to population and evolutionary parameters. We have discussed the interpretation of each of them separately, and we have also given some insights of the applicability of our proposed new measurement to related studies.
The integration of clinical and viral genetic data is an important issue for the evaluation of different factors related to HCV treatment response. In this study, a new viral factor that accounts for inter-patient viral variability was suggested. One of the advantages that we have found by using the sequence similarity measure is that we were able to reduce the number of parameters for regression analyses. Moreover, it preserved patient variability in terms of complete viral sequences and could be integrated with clinical data. These characteristics make our multidimensional measure of sequence similarity useful for the identification of joint substitutions profiles that might modulate the chances of responding to treatment.
Our proposed new methodology could be applied in related studies to identify viral positions involved in treatment response and also in a comparison of new therapies at different time points to study the evolution of viral joint-mutation profiles regarding treatment outcome.
Author Contributions
Conceived and designed the experiments: AA, FG-C. Analyzed the data: AA. Wrote the first draft of the manuscript: AA. Contributed to the writing of the manuscript: AA, FG-C. Agree with manuscript results and conclusions: AA, FG-C. Jointly developed the structure and arguments for the paper: AA, FG-C. Made critical revisions and approved final version: AA, FG-C. Both authors reviewed and approved of the final manuscript.
Supplementary Data
Supplementary Table 1.
Subgroup-based model of la HCV genotype.
Supplementary Table 2.
Subgroup-based model of lb HCV genotype.
Footnotes
Acknowledgments
We thank Vicente Sentandreu, María Alma Bracho, Nuria Jiménez, and Manoli Torres for sharing their HCV sequence data. We also thank Dr. Enrique Ortega, Dr. Fernando Carnicer, and Dr. Juan del Olmo for patient information and Enrique Vidal for statistical suggestions.