
Abstract
The composition of a defined set of subunits (nucleotides, amino acids) is one of the key features of biological sequences. Compositional biases are local shifts in amino acid or nucleotide frequencies that can occur as an adaptation of an organism to an extreme ecological niche, or as the signature of a specific function or localization of the corresponding protein. The calculation of probability is a method for annotating compositional bias and providing accurate detection of biased subsequences. Here, we present a Sequence Analysis based on the Ranking of Probabilities (SARP), a novel algorithm for the annotation of compositional biases based on ranking subsequences by their probabilities. SARP provides the same accuracy as the previously published Lower Probability Subsequences (LPS) algorithm but performs at an approximately 230-fold faster rate. It can be recommended for use when working with large datasets to reduce the time and resources required.
Introduction
Compositional biases are local shifts in amino acid or nucleotide frequencies in biological sequences. This is a widespread natural phenomenon occurring at all levels of biological material, from genomes and proteomes down to short regions of genes and proteins. These regions are called compositionally biased (CB) regions. It is now clear that CB regions play a significant role in the adaptation of organisms to extreme ecological niches1,2 and determine certain properties of proteins.3,4 Some types of CB regions in protein sequences are strongly associated with completely disordered sequences, 5 and have the ability to form amyloids6,7 or other cellular functions. 8 Certain compositional biases play significant roles in human neurodegenerative diseases.9,10
The great success of recent genome projects is an important factor in the development of algorithms and tools for the automated annotation of biological sequences. In recent years, in addition to a large number of prokaryotic genomes, the genomes of thousands of different eukaryotic species have been sequenced and assembled. The almost exponential growth of genomic and proteomic data is an important incentive for the development of algorithms and tools for the automated annotation of biological sequences. Some algorithms for the annotation of CB regions have previously been derived. The general aim of these existing algorithms has been the selective masking of CB regions without affecting other regions that could be potentially important. Examples of such algorithms are SEG (Segment Sequence(s) by Local Complexity) and CAST (Complexity Analysis of Sequence Tracts).11,12 Later, a method for the identification of CB regions based on defining the lowest-probability subsequences (LPSs) for a given amino-acid composition was proposed. 6 This algorithm (referred to below as the original LPS algorithm) is based on scanning along the input sequence in a decreasing series of moving windows whose range of window sizes is specified by the user. The next adaptation of this method was an algorithm for the complete annotation of multiple amino acid residue biases. 8 This algorithm provides an exhaustive assignment of CB regions with a precise localization of boundaries. It was employed for the development of the LPS-annotate server and “Prion Home” database.13,14 The LPS algorithm is a very useful and powerful tool for the annotation of LPSs, but some of its features reduce its efficiency. For examples, it uses an enumerative technique in which LPSs are found by checking all possible subsequences from 25 residues to the full sequence length with a step size of 1 residue. 6 In this algorithm, the dependence of processing time on the length of the sequence is nearly quadratic. Annotation of CB regions requires a lot of time and resources, especially for relatively long sequences.
Considering that processing time is essential for the processing of large datasets, we developed Sequence Analysis based on the Ranking of Probabilities (SARP): a novel algorithm for the annotation of LPSs. SARP provides a precise annotation of LPSs; it finds all of the LPSs that would be found by the original LPS algorithm. Our algorithm is based on ranking subsequences by their probabilities, followed by the selection of LPSs, which avoids enumeration. We achieved an approximately 230-fold faster performance with a dependence on sequence length that is closer to a linear relationship. SARP is especially useful for the processing of large datasets, such as sets of eukaryotic proteomes, as it permits the user to drastically reduce the computing time and hardware requirements for computation.
Methods
Materials
Algorithms were implemented using C#. All calculations were performed on a computer with a single 2.8 GHz Intel Core i7 CPU and 6 GB RAM. The probability threshold in all cases was 10−12. The minimum window size for both algorithms was 25 aa, and the maximum window size for the original LPS algorithm was 1000 aa. The source code for SARP is available upon request.
All protein sequences were downloaded from the NCBI RefSeq database (http://www.ncbi.nlm.nih.gov/refseq/). To generate the sets of 1000 proteins of yeast
Original LPS algorithm
We used the LPS algorithm described previously.
6
This algorithm is based on calculating the probabilities for all subsequences of the given sequence. To generate the set of subsequences, the authors used sliding windows of different sizes. For each individual amino acid of type

where
Description of SARP
Unlike original LPS algorithm, our algorithm, SARP, finds short subsequences, which are likely to be the parts of LPSs, and extends them to cover the whole LPSs. A flow diagram of SARP is shown in Fig. 1. First, SARP finds the lower limit of LPS length for the given sequence. The procedure for the optimization is described below. Then, the window of the calculated length moves along the sequence with a step size of one residue, and both the count of x-type amino acids and the probability are calculated for each subsequence. Probability is calculated as for the original algorithm (1).

A workflow of SARP. The steps of SARP performance are shown below. The beginning and end of the algorithm are indicated. The steps suggesting alternative solutions are indicated with rhombs.
Next, all subsequences are split into groups so that all elements in each group have equal probabilities, and the groups are added to the queue in order of ascending probability. So, at the beginning of the queue, we have the group of subsequences with the lowest probability among the all subsequences of the same size, which are more likely to be the parts of LPSs. Then, the first group is taken from the queue and split into subgroups in such a manner that each subsequence in the subgroup overlaps with at least one other subsequence in the subgroup. We expect that all members of each subgroup are the parts of one LPS, if they are. Next, SARP determines the boundaries and probability of the LPSs covering the subgroups. For each subgroup, the first and last subsequences are selected, and each of these sequences is extended towards the beginning and end of the sequence as follows. At each step, one residue is added to the subsequence, and a new probability is calculated until the extension reaches the border of the sequence or the explored subsequence. Then, the subsequence with the lowest probability is chosen. Next, the extensions are combined as follows. We select the subsequence with the lowest probability from the extensions to the beginning, to the end and the union of both extensions. Then, from the first and last extended subsequences of the subgroup, the subsequence with the lowest probability is selected. For this subsequence, the procedure of extending to both ends and selecting the extension with the lowest probability is repeated until the beginning and end of the subsequence do not change. The LPS at each step is saved.
The LPSs generated for the subgroups, could overlap. To resolve overlapping, SARP uses the following procedure. For the group, the lowest probability subsequences from the last extension step for each subgroup with a probability lower than the threshold are checked for overlap. If there is a pair of overlapping subsequences, the subsequence with the higher probability is substituted with the LPS from the previous step for that subgroup, and checking is repeated. If the probability of the new LPS is higher than the threshold, it is excluded from the list of LPSs. The explored sequences for each group are excluded from further analysis. The final list of LPSs for each group is added to the final list of LPSs, which is returned by the algorithm. The example of running SARP is shown in Fig. 2.

The scheme of search for LPS in example sequence with SARP for the amino acid alanine (A). The groups of the fragments with equal probability and the subgroups are shown. The process of extension is demonstrated for the first group.
Length optimization procedure
SARP outputs only the LPSs, whose probabilities are lower than the user-defined threshold, and whose lengths are bigger than the user-defined limit. We conclude that if the probability for every subsequence of the smallest window's length is much higher than the threshold, we can increase the length of the window until the probability of at least one of the subsequences is closer to the threshold. Therefore, we developed the window length optimization procedure. The length optimization procedure works as follows: SARP calculates the probability for an initial length w of each subsequence 
Let

and

Taking Equations (3) and (4) together, we can conclude that
Results
Faster algorithm with the same accuracy
The original LPS algorithm uses sliding windows, which have sizes that vary over a broad range, and a binomial distribution to calculate the probability of each subsequence.
6
The employment of sliding windows with sizes that vary from several residues to thousands requires the calculation of approximately
We benchmarked SARP with the original LPS algorithm using 1000 random protein sequences from

The scheme represents all LPSs found with the original LPS algorithm and with SARP in a set of 1000 yeast proteins. The numbers are the GI numbers of proteins in the NCBI database. The horizontal black line represents a protein sequence. Different green regions represent overlapping LPSs found with the original algorithm and SARP. Blue regions denote parts of an LPS that were not identified by the original algorithm. Vertical red dashes denote an exact match of the LPS boundaries found with the original LPS algorithm and SARP.
We compared computation times between the original LPS algorithm and SARP. As expected, SARP demonstrated dramatic reductions in computation time. The tested set of 1000 proteins was processed in 1465 seconds of running time, ie, approximately half an hour, whereas for the original LPS algorithm, this index was 341,914 seconds (approximately 4 days). Thus, SARP is approximately 230-fold faster than the original algorithm. A summary of the time consumed by each algorithm to find the LPSs in 1000 yeast proteins is presented in Table 1.
A comparison of the efficiency between SARP and the original LPS algorithm.

Computation time strongly depends on protein length
It is clear that the computation time required to find the LPSs within a protein sequence depends on the length of the sequence. Over the range of protein lengths in our testing set (Fig. 4C), the computation time of the original algorithm increases very quickly, reaching up to approximately 2 hours for a sequence of 2800 residues (Fig. 4B), whereas SARP required only approximately 12 seconds for the same sequence length (Fig. 4A). To better understand this dependence, we sorted all sequences into several groups by length with an increment of 200 residues (Fig. 4C). A comparison between SARP and the original LPS algorithm in processing times for proteins grouped by size is shown in Figure 4D. Because the difference in computation time for SARP and the original LPS algorithm is too large to illustrate both in the same histogram, an additional histogram for SARP alone is included (Fig. 4E). As discussed above, the upper limit of runtime of the original algorithm is close to

(A) A distribution of computation times for separate proteins of different lengths using SARP. Lengths of protein sequences (aa) and times of computation (ms) are shown. (B) The same as A. for the original LPS algorithm. (C) A histogram of relative numbers of proteins from the set of 1000 sequences that were analyzed grouped by their lengths. (D) A comparison of CPU running times for the original LPS algorithm and SARP dependent on the length of proteins. The columns of SARP results are nearly invisible due to its very fast computation time relative to the original algorithm. The results are indicated as the mean ± the confidence interval (
Another question was whether the computing time for SARP depends on the frequencies of amino acids within the proteome. To test this, we compared the speed of LPS detection between proteins from 5 different species. We selected 250 random proteins from
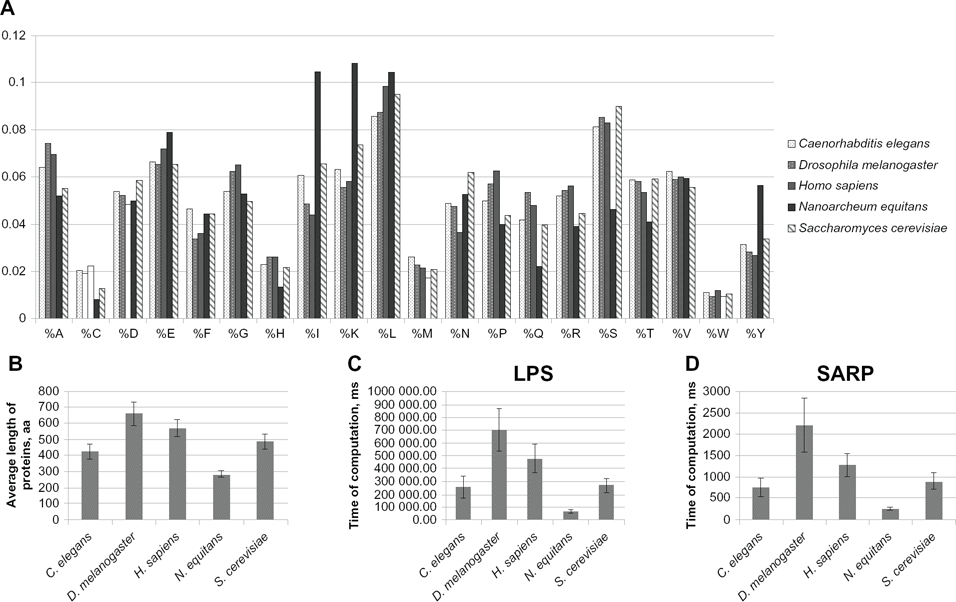
(A) The frequencies of amino acids for the sets of 250 proteins for each of the five species analyzed. The means of frequencies are indicated as percentages. (B) The average protein length (aa) is indicated for the set of sequences from each species. (C) Computation time using the original LPS algorithm for the sets of 250 proteins from five different species. Computation time is indicated in ms. The results are shown as the mean ± the confidence interval (
Discussion
The role of amino acid composition was first discussed many years ago. 15 Since then, shifts in the composition of protein sequences have been attributed to a large number of interesting phenomena of the living world, including adaptations to extreme ecological niches by Archaea and bacteria,1,2 prions and amyloids6,16 and many others. Analysis of composition is used to characterize the structure, 13 functions and evolution of proteins.8,17 There is evidence suggesting that the composition of amino acids is a unique “molecular signature” of each species, similar to the GC content of genomes. 1 However, unlike GC content, the amino acid composition of proteomes has been studied very poorly to date, primarily due to the relatively weak elaboration of algorithms for systemic annotation of compositional biases in proteins. It is noteworthy that there are a lot of papers describing shifts in the composition of entire proteomes or individual proteins, but that the number of papers dedicated to the systematic analysis of CBs in proteins is much lower. One of the most convenient algorithms allowing such analysis is the LPS algorithm. 6 It was successfully utilized in the original paper for the annotation of potentially amyloidogenic and prionogenic proteins based on their enrichment in asparagine and glutamine, which is the common feature of prions. Furthermore, this algorithm was used for the “Prion Home” (http://www.libaio.biol.mcgill.ca/prion) 14 and “LPS annotate” (http://cedra.biol.mcgill.ca/lps-annotate.html) databases 13 and for a series of studies dedicated to the characterization of CB regions. These implications of the LPS algorithm confirm its relevance. Our algorithm, SARP, can also be used in such studies with the advantage of very fast processing times. Our algorithm permits the annotation of LPSs in eukaryotic proteomes within several hours of CPU running time on a single CPU machine without using high-performance computer systems. SARP may be useful for any web resources demanding permanent annotation of novel LPSs, such as “LPS annotate”, because compared with the LPS algorithm, it strongly reduces the required computation capacity.
To conclude, we herein described the use of SARP, a novel algorithm for assessing compositional biases. This algorithm was shown to have high fidelity, allowing the precise identification of CB regions in proteomes. Indeed, comparing the original LPS algorithm and SARP for 1000 yeast proteins, we found only 1 protein for which the original algorithm was more precise than SARP. We did not filter the LPSs by the frequency of residues of type
The general advantage of this algorithm is its significantly faster performance. The basis of such a performance improvement is the method of identification of LPSs. In contrast with the previously published LPS algorithm, SARP does not use enumeration of subsequences but directly ranks their probabilities and uses a new procedure of optimization of window lengths. A performance test showed that CPU running time with SARP was approximately 230-fold faster than the original LPS algorithm. For the set of 1000 yeast's proteins we achieved the reduction of the runtime up to approximately 95 hours, using SARP instead of the original algorithm. We could expect that the typically used data sets are the whole proteomes, which are much larger. The whole proteome of
Thus, SARP is a powerful tool for the annotation of LPSs in large datasets, which is important for comparative, functional and evolutional proteomics.
Footnotes
Author Contributions
Conceived and designed the experiments : KSA, AAN. Designed the algorithm: KSA. Analyzed the data: KSA, AAN. Wrote the first draft of the manuscript: AAN. Contributed to the writing of the manuscript: KSA. Agree with manuscript results and conclusions: KSA, AAN. Jointly developed the structure and arguments for the paper: AAN. Made critical revisions and approved final version: KSA, AAN. All authors reviewed and approved of the final manuscript.
Funding
The study was supported by the Ministry of Education and Science of Russia, project 14.132.21.1324. This work was supported by a grant from the St. Petersburg Government.
Competing Interests
Author(s) disclose no potential conflicts of interest.
Disclosures and Ethics
As a requirement of publication the authors have provided signed confirmation of their compliance with ethical and legal obligations including but not limited to compliance with ICMJE authorship and competing interests guidelines, that the article is neither under consideration for publication nor published elsewhere, of their compliance with legal and ethical guidelines concerning human and animal research participants (if applicable), and that permission has been obtained for reproduction of any copyrighted material. This article was subject to blind, independent, expert peer review. The reviewers reported no competing interests.
Supplementary material
Supplementary File 1
List of LPSs found by SARP and by the original LPS algorithm.