
Abstract
Background
Body mass index (BMI) has been used widely among clinicians to assess obesity in their patients due to its ease and availability. However, BMI has some diagnostic limitations and other measures related to health risks; in particular, body shape may be of greater relevance to health outcomes.
Objective
The objective of this study was to illustrate the importance of body shape assessments above and beyond BMI and its relationship to health risk among a sample of African-American and European American women.
Methods
African-American and European American women aged 19–78 years (n = 552) in Birmingham, Alabama, were recruited and stratified by menopausal status (ie, pre- or postmenopausal). Pictorial body shapes were derived from digital photographs, while body fat distribution defined by android-gynoid ratio (AGR) and body composition were obtained from dual-energy X-ray absorptiometry.
Results
Images of BMI and age-matched women illustrate variability in fat distribution. Among both menopausal status groups, more than 50% of women had a pear body shape (AGR < 1). An apple body shape was associated with higher odds of having diabetes (unadjusted odds ratio [OR]: 4.1, 95% confidence interval [CI]: 1.9–9.3), hypertension (unadjusted OR: 3.1, 95% CI: 2.0–4.7), and high cholesterol (unadjusted OR: 3.0, 95% CI: 1.8–5.1).
Conclusion
Use of visual cues alongside traditional methods of weight status assessment may help to facilitate weight management conversations between physicians and female patients. However, next steps should include the validation of visual assessments of body shape in women for use by physicians.
Introduction
The U.S. Preventative Services Task Force recommends that clinicians screen all adults for obesity, which continues to be a significant public health issue. 1 To date, body mass index (BMI, kilograms per meter squared), a measure of weight (kilograms) adjusted for height (meter squared), is the most widely used screening tool to identify obesity and related health risk among the general population. BMI is used widespread in clinical practice and research due to it being simple, inexpensive, noninvasive, and reasonably accurate. 2 The widespread and longstanding application of BMI contributes to its utility at the population level. 2 Its use has resulted in an increased availability of published population data that allows public health professionals to make comparisons across time, regions, and population subgroups. 2 Previous research has shown that BMI “is significantly correlated with total body fat content”. 3 While a positive relationship exists between BMI and overall mortality, 4 the use of BMI as a diagnostic tool in weight management is inadvisable as BMI has been consistently shown to be limited across diverse populations.5,6
It has been demonstrated that physicians are more likely to recommend and counsel weight loss to patients with higher BMIs 7 and that “at similar weights and with other examined factors being equal” 8 the odds of receiving a BMI-based obesity diagnosis is two times greater for women than men. 8 However, solely relying on BMI has misrepresented the obesity prevalence, particularly among women.6,9 Studies in African-American (AA) women have indicated that the prevalence of obesity is overestimated by BMI criteria relative to the National Institute of Diabetes and Digestive and Kidney Diseases >30% body fat criteria (obesity prevalence 34% vs. 26%, respectively), 9 but underestimated relative to the World Health Organization criteria (BMI ≥ 30 kg/m2 vs. BMI = 28.7 kg/m2 corresponding to 35% body fat). 6 In addition, the relative contributions of fat and muscle to body composition, as well as body fat distribution (eg, abdominal adiposity, waist-to-hip ratio), are not accounted for by BMI and have been shown to be independent risk factors for health.10–13 Specifically, intra-abdominal fat and trunk fat (eg, upper body adiposity) have been positively associated with cardiovascular disease (CVD) risks, 14 hypertension,15,16 and diabetes mellitus, 15 whereas lower body adiposity (eg, leg fat) is negatively associated with CVD health risks. 14 The different health outcomes and risk associated with regional fat distributions are particularly important among women, as the distribution of fat has been shown to vary across race/ethnicity and age among these individuals.17–20 When matched for BMI, AA women tend to have smaller abdominal girths, 17 more leg fat, 5 and less visceral fat18–21 compared to their pre-menopausal5,19,20 and postmenopausal 17 European American (EA) counterparts. These data indicate that the fat distribution and/or body shape of women needs to be discussed in health risk assessments and recommendations for weight management. 5
Common methods to assess body fat include body composition assessment (eg, dual-energy X-ray absorptiometry (DXA), total body water, bioelectrical impedance) and methods to assess abdominal fat include circumference measurements (eg, waist circumference, waist-to-hip ratio, magnetic resonance imaging, computed tomography). 3 However, routine body fat measurements are impractical due to the cost and availability of equipment. 3 Likewise, despite recommendations for both BMI and annual waist circumference (marker of fat distribution) measures during clinical assessments for obesity and cardiovascular risk, 22 the majority of primary care physicians (PCP) fail to obtain waist circumference measurements.10,23 This may be due to the challenges of obtaining accurate measurements, difficulty incorporating measurement in clinic routine, and staff education. 23 Of the adults at risk for CVD in the U.S., 65% reported having never received knowledge pertaining to fat distribution from their PCP. 10 Given the cardiometabolic importance of fat distribution, it is evident that an examination of body shape should be integrated into clinical assessments to help patients better understand their health risks above and beyond weight and BMI. Enabling PCPs with the ability to provide patients with a visual reference of their fat distribution may better facilitate and motivate patient education in the importance of body shape during weight management and health risk counseling. The purpose of this study was to illustrate why body shape assessments may be useful in clinical practice above and beyond BMI, and its relationship to health risk among a sample of AA and EA women by: 1) pictorially presenting different body shapes at the same BMI among pre- and postmenopausal women pairs by race/ethnicity and 2) examining associations between body shape and health outcomes after controlling for BMI and menopausal status within racial/ethnic groups.
Methods
This study is based on a subset of participants within a larger body composition methods development study. The design of the larger study has been previously reported. 24 The current study focuses on AA and EA women whose BMI status was classified as normal, overweight, or obese.
Participants
Our sample included a total of 552 non-Hispanic women. AA (n = 259, 39.0 ± 14.1 years old) and EA women (n = 293, 42.6 ± 15.1 years old) were recruited from Birmingham, Alabama, between November 2012 and September 2015 to participate in a large-scale body composition study. Participant recruitment was facilitated by the study recruitment coordinator who placed advertisements in local newspapers and organizational newsletters, distributed flyers throughout the community (ie, college campus, gyms, barbershops, and other businesses), and approached potential participants at community events (ie, health fairs and local running events). Inclusion criteria consisted of the following: (1) not pregnant, (2) no missing body parts beyond a finger or toe, (3) free of genetic diseases known to alter body composition, (4) under 450 lbs (weight limit of DXA scan), and (5) no conditions that would prevent them from standing to have pictures taken or lying down for body composition assessments. Participants meeting the aforementioned study criteria provided written informed consent and had their photographs taken and body composition measured during a single study visit. All participants also provided demographic information (participants self-identified their race and ethnicity), completed a medical history (health conditions, medication use) questionnaire, and were compensated $20 for their participation. The University of Alabama at Birmingham's Institutional Review Board approved this study. This study complied with the principles of the Declaration of Helsinki.
Anthropometric measurements
Participants were provided with close-fitting tank tops and Lycra shorts to wear during the assessments. Height and weight were measured by trained staff to the nearest 0.1 cm and 0.1 kg, respectively, using a physician's balance beam scale (HealthOMeter—Model 402LB). BMI (weight in kilograms/height in meter square) was calculated thereafter. BMI of participants were classified into standard obesity status categories as follows: normal weight (18.5–24.9 kg/m2), overweight (25.0–29.9 kg/m2), and obese (≥30 kg/m2). 3 For the purpose of examining associations among similar participants (ie, those within ±1 BMI unit—kg/m2), we created four BMI reference groups (n = 242) to correspond to commonly used BMI cutoffs (BMI 22, BMI 25, BMI 30, and BMI 35).
Body shape silhouettes
To illustrate variation in body fat distribution at the same BMI, the anterior, and side view, whole body silhouettes were purposively selected from a subset of age- and BMI-matched (range of difference is ≤6 years and 0.3–2.0 kg/m2) participants (n = 16). Using photographs captured with a digital camera (Canon PowerShot—Model SX50, Cannon USA Inc.), the images were processed to extract the body shape silhouettes by separating the subject from the background, as described elsewhere. 24
Body composition and body shape identification
Total body fat percent, regional body fat (trunk25,26 and leg),27,28 and android-gynoid ratio 29 (AGR, an indicator of body fat distribution) were determined using DXA (GE Lunar Corporation). To characterize body fat distribution from DXA, an AGR ≥ 1 indicated an apple body shape (upper body adiposity), while an AGR < 1 indicated a pear body shape (lower body adiposity). 29 To categorize obesity status from DXA body fat, we used a cutoff of ≥35%. 30
Health outcomes
The presence of any cardiometabolic health conditions (eg, diabetes, hypertension, high cholesterol, kidney, liver, and heart disease, polycystic ovarian syndrome) and current medication usage (eg, beta-blocker, diabetic pill, diuretic, insulin, lipid-lowering medication) were self-reported by participants on their medical history via an interviewer-administered questionnaire. Of the total sample, 74.5% reported that they visited the doctor's office at least once in the past year. These data were used to examine the relationship between body shape and health conditions when stratified by race and body shape (as determined by AGR).
Data analysis
Participants were stratified by menopausal status (ie, pre- or postmenopausal). Summary statistics (mean, SD, and frequencies) were calculated for the stratified sample. T-tests were used to examine racial differences in anthropometric, body composition, and fat distribution within menopausal status. Chi-square analyses were conducted to identify differences in the following distributions: (1) BMI status and body shape by race/ethnicity, (2) the presence of cardiometabolic health conditions by race/ethnicity and body shape, and (3) medication use by race/ethnicity and body shape. No comparisons were made between menopausal status and specific types of medications used due to the limited responses. Logistic regression was used to examine associations between cardiometabolic health conditions and body shape controlling for race/ethnicity, BMI (continuous), and menopausal status. All analyses were conducted using SAS 9.4 (SAS Institute Inc.) and significance was accepted at P < 0.05.
Results
BMI and body composition comparisons stratified by menopausal status and race/ethnicity
Compared to premenopausal EA women, premenopausal AA women had a higher mean BMI (t(379) = −9.30, P < 0.0001) and mean AGR (t(366) = −7.86, P < 0.0001). Similarly, mean total body fat (t(397) = −9.08, P < 0.0001), mean trunk fat (t(377) = −8.05, P < 0.0001), and mean leg fat (t(360) = −9.86, P < 0.0001) were greater in premenopausal AA women compared to premenopausal EA women (Table 1). There was a significant difference in the distribution of BMI status by race/ethnicity (χ 2 (2, n = 399) = 82.0, P < 0.0001). Similarly, there was a significant difference in the distribution of body shapes by race/ethnicity (χ 2 (1, n = 399) = 16.5, P < 0.0001; Table 1). Apple body shape was represented more in AA women than in EA women.
Anthropometric and body composition comparisons (mean ± SD).

P < 0.0001 for AA vs. EA within menopausal status.
Postmenopausal AA women had a higher mean BMI (t(151) = −3.79, P < 0.0002) and mean AGR (t(151) = −3.39, P = 0.0009) than postmenopausal EA women. Likewise, postmenopausal AA women had greater mean total body fat (t(141) = −2.89, P = 0.004), mean trunk fat (t(151) = −2.77, P = 0.006), and mean leg fat (t(97) = −3.71, P = 0.0003) than EA women (Table 1). Similarly, there was a significant difference in the distribution of BMI status by race/ethnicity (χ 2 (2, n = 153) = 14.5, P = 0.007). There was also a significant difference in the distribution of body shapes by race/ethnicity (χ 2 (1, n = 153) = 11.0, P = 0.009; Table 1).
BMI-matched silhouettes and body composition comparisons
The body silhouettes from a subset (n = 16) of BMI-matched pre- and postmenopausal women for each BMI reference group are illustrated in Figure 1. When matched for BMI and menopausal status, the racial differences in total and regional body fat and fat distribution were small in these pairs of women; however, body shapes varied among these women. With the exception of the BMI 22 group, premenopausal EA women had slightly higher total body fat, trunk fat, and leg fat compared to their AA counterparts. In postmenopausal women, EA had higher total body fat and trunk fat only in the BMI 22 and 30 groups. Postmenopausal AA women had greater leg fat than EA women for the following BMI reference groups: 25, 30, and 35 (Fig. 1). Total body fat percentages for 14 women (87.5%) were above the 35% body fat percentage threshold of obesity and 7 (43.7%) had an apple body shape based on their AGR.
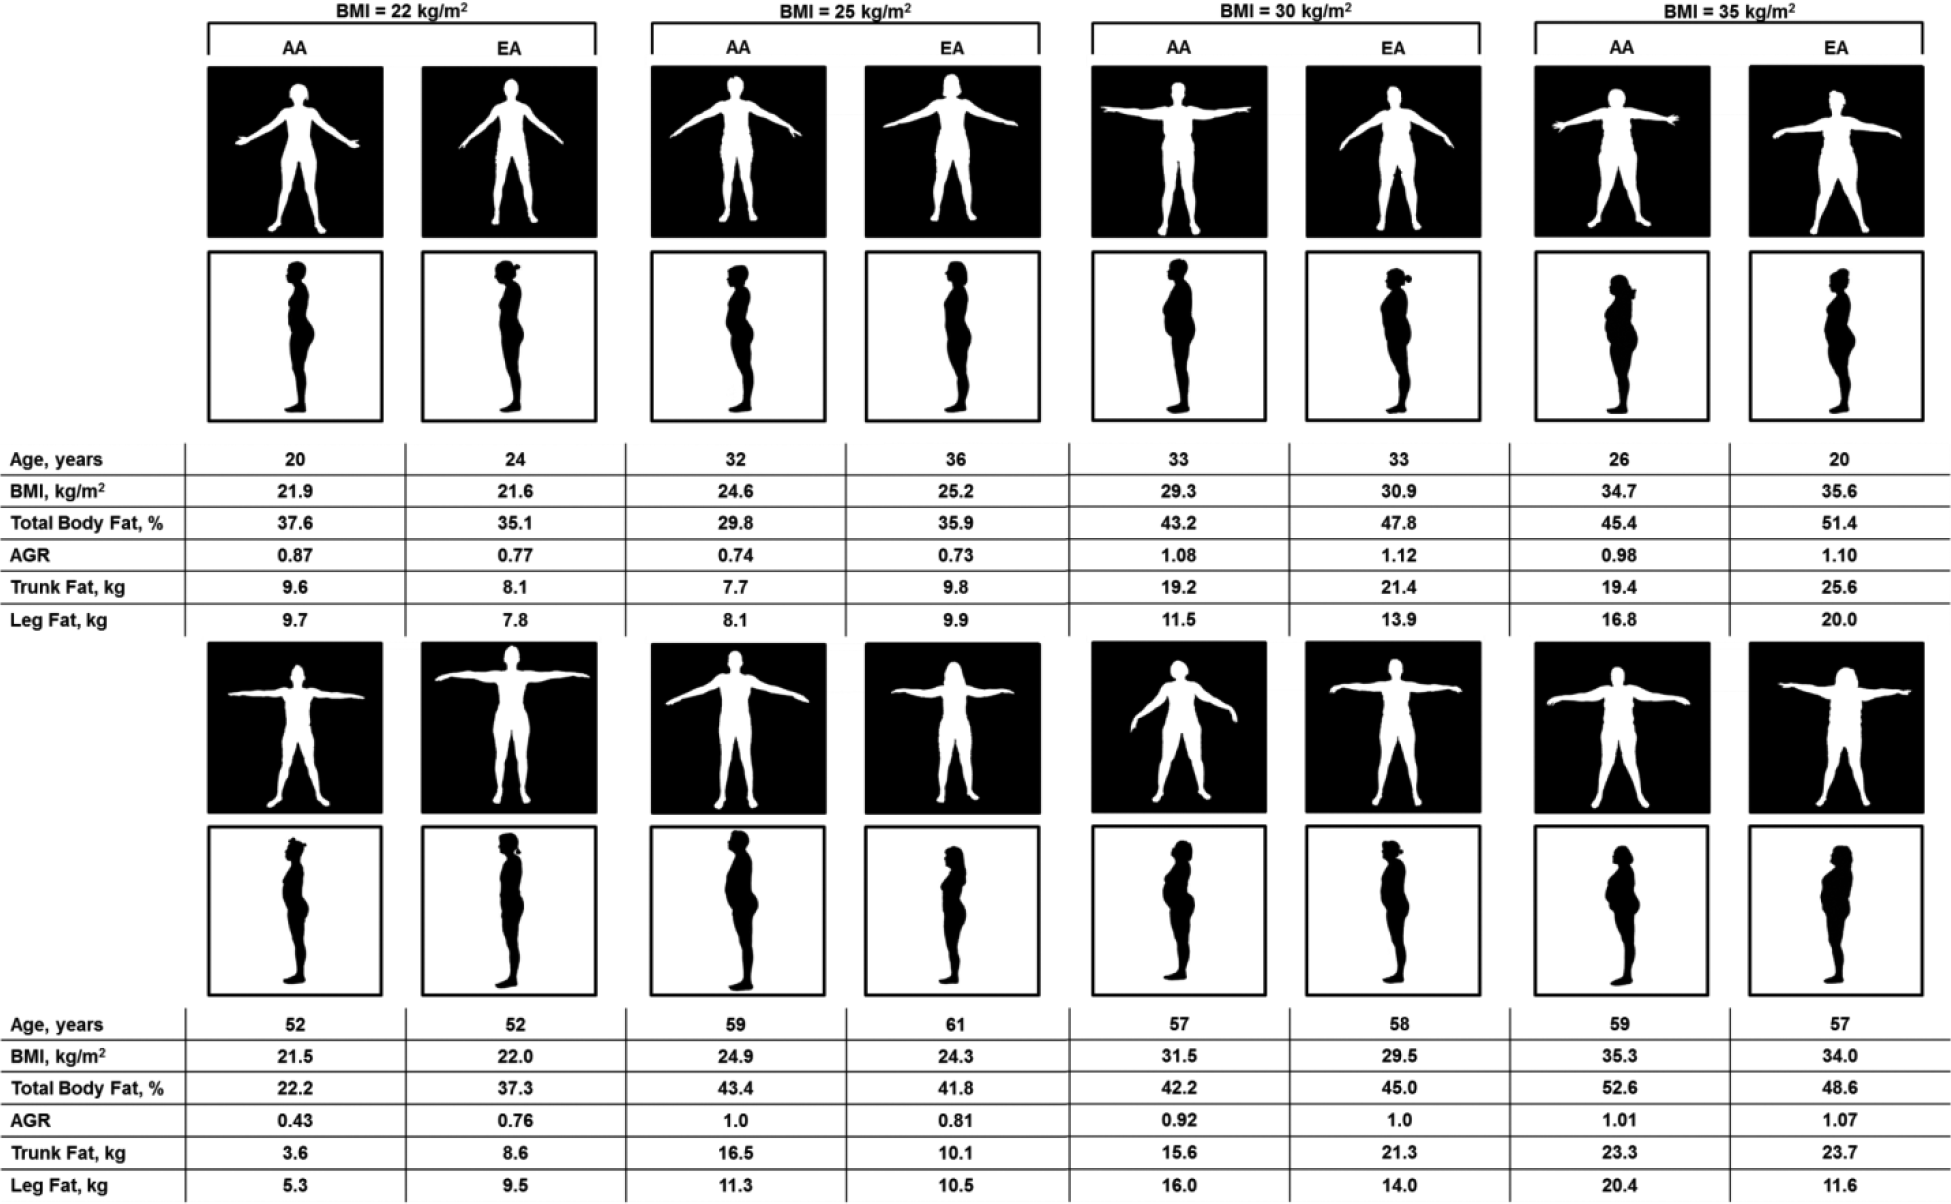
BMI-matched body silhouettes in pre- (top) and postmenopausal (bottom) women.
Table 2 is an extension of Figure 1 (without silhouettes) and includes a subset of participants that were within ±1 kg/m2 of the BMI groups referenced in Figure 1 (ie, BMI 22, 25, 30, and 35 kg/m2). A total of 242 participants (premenopausal, n = 179; postmenopausal, n = 63) met our subset stratification criteria (±1 kg/m2 of the BMI reference groups), and the small and unbalanced sample sizes within each BMI reference group are due to the racial differences in women meeting these criteria (Table 2). For premenopausal women in the BMI 22 group, there was a significant effect of age, in that EA women were older than AA women (t(64) = 2.68, P < 0.05). In the BMI 35 group, premenopausal EA women had significantly more trunk fat than AA women (t(22) = 2.18, P < 0.05). For postmenopausal women in the BMI 30 group, EA women had significantly more trunk fat than AA women (t(10) = 5.37, P < 0.05).
BMI-matched anthropometric and body composition comparisons (mean ± SD).

P < 0.05 for AA vs. EA within BMI-reference group of menopausal status.
Prevalence of cardiometabolic conditions and medication use
Of our total sample, 32.1% (n = 177) reported a health condition, while 43.5% and 56.5% were EA and AA women, respectively. Medication use was reported by 19.6% (n = 108) of women (38.0% EA women and 62.0% AA women). A significant difference in proportions was found for race/ethnicity and the presence of at least one self-reported cardiometabolic condition (χ 2 (1, n = 552) = 9.59, P = 0.002) and medication being used (χ 2 (1, n = 552) = 12.3, P = 0.0004).
In EA women, there was a significant difference in the distribution of body shapes and the prevalence of at least one cardiometabolic condition (χ 2 (1, n = 293) = 22.71, P < 0.0001) but not in AA women (χ 2 (1, n = 259) = 3.76, P = 0.053). Among the EA women reporting a cardiometabolic condition, 41.6% had an apple body shape and 58.4% had a pear body shape. Among AA women reporting a cardiometabolic condition, 48% had an apple body shape and 52% had a pear body shape. Similarly, there was a significant difference between body shape and the use of at least one medication in EA women (χ 2 (1, n = 293) = 31.76, P < 0.0001) but not in AA women (χ 2 (1, n = 259) = 2.84, P = 0.092). Among the EA women reporting medication usage, 56.1% had an apple body shape and 43.9% had a pear body shape. Among the AA women reporting medication usage, 49.3% had an apple body shape and 50.7% had a pear body shape.
Specific cardiometabolic conditions and medications used by the participants are displayed in Table 3. Since many women reported having more than one health condition and/or using multiple medications, the frequencies listed in Table 3 are greater than the total number of participants who reported a health condition or medication.
Prevalence of cardiometabolic conditions and medication use by body shape.

P < 0.05 for apple vs. pear within racial/ethnic group. The percentages in parentheses represent the proportion of women diagnosed with the disease in our entire participant sample for a given race. Category frequencies are greater than the total number of participants due to the presence of more than one health condition and medication being used by participants.
In EA women, there was a significant difference between body shape and diabetes (χ 2 (1, n = 293) = 20.65, P < 0.0001), hypertension (χ 2 (1, n = 293) = 24.66, P < 0.0001), and high cholesterol (χ 2 (1, n = 293) = 17.18, P < 0.0001), with a greater proportion having an apple body shape. In AA women, there was a significant difference in the distribution of body shapes and hypertension (χ 2 (1, n = 259) = 4.49, P = 0.03) and high cholesterol (χ 2 (1, n = 259) = 5.42, P < 0.02; Table 3).
Odds ratios for cardiometabolic conditions by body shape
To examine associations between body shape and cardiometabolic conditions, the unadjusted and adjusted odds ratio (OR) controlling for race/ethnicity, menopausal status, and BMI were determined for each condition. There was a positive association for women with an apple body shape and diabetes (OR: 4.1, 1.9–9.3, P = 0.0005) even after controlling for race/ethnicity, BMI, and menopausal status (OR: 3.2, 1.2–8.4, P = 0.02). The apple body shape was positively associated with hypertension (OR: 3.1, 2.0–4.7, P < 0.0001). An interaction term (race × body shape) was included in the adjusted model only for hypertension as data support a higher prevalence of hypertension in AA compared to EA, 31 and therefore, race may be driving the relationship between body shape and hypertension in the current study. The interaction term was significant in the adjusted model (P = 0.02), suggesting that race and body shape both influence the likelihood of having hypertension when controlling for BMI and menopausal status. Having an apple body shape was positively associated with high cholesterol (OR: 3.0, 1.8–5.1, P < 0.0001), and a trend for significance was apparent when controlling for race/ethnicity, BMI, and menopausal status (OR: 1.9, 1.0–3.7, P = 0.05). Furthermore, body shape was not associated with kidney, liver, or heart disease or polycystic ovarian syndrome in any model.
Discussion
The purpose of this study was to illustrate the benefits of body shape assessments beyond BMI and its associations with health risk in a sample of AA and EA women. Previous studies have shown that fat distribution varies by race/ethnicity in women.17–20 The present study reinforces these findings by demonstrating a clinical association between body shape and health risks beyond BMI as well as providing photographic representations of body shape to display differences in fat distribution among women. The main findings in the present study are: (1) AA women have higher BMIs and more total and regional body fat compared to EA women however, when stratified by BMI reference groups with similar body composition between race/ethnicity and more favorable fat distribution (less trunk fat) in AA women was noted, (2) of the 12 women classified as overweight or obese according to BMI in the whole body silhouettes (Fig. 1), 5 women were misclassified as having an increased risk when they had favorable body fat distribution (ie, pear body shape), (3) 30.7% of the total sample had an apple body shape, and (4) an apple body shape (AGR ≥ 1) was associated with the prevalence of diabetes, hypertension, and high cholesterol.
In line with other studies,18–21 we report that BMI-matched AA women have less abdominal fat than EA women. Similar to previous work, 5 we found that AA women have more leg fat than EA women. It has been suggested that the distribution of fat, but specifically in the abdominal region negatively influences cardiometabolic health. 14 Overall, more AA women had an apple body shape compared to EA women. Although the number of women reporting at least one cardiometabolic condition was higher for women with the pear body shape, those with the apple body shape reported multiple cardiometabolic conditions and more medication usage. Moreover, the apple body shape was positively associated with diabetes, hypertension, and high cholesterol, even after controlling for BMI.
Three of four women pictured in the BMI 25 reference group (Fig. 1) were classified as overweight according to BMI, but they had a favorable body fat distribution (AGR < 1, pear body shape). For these three women, PCPs may waste important clinical time by focusing on an apparent unhealthy BMI and divert attention away from other preventative medical issues. When looking at women classified as obese, 2 of 8 women would be misclassified as having increased risk while having a favorable body fat distribution. The use of visual assessment of fat distribution presents an opportunity to discuss health risks associated with abdominal and trunk fat, which have been linked to cardiometabolic conditions. Illustrations of body shape (digital pictures, silhouettes) have been previously integrated in studies examining body image perception and satisfaction, 32 in the clothing industry to assist in apparel sizing, 33 and editorials demonstrating how body shape can vary within the same BMI.34,35 Despite the importance of fat distribution on health outcomes, only a limited number of studies have examined the use of visual representations of body shape and its relation to health outcomes. 36
PCPs are more likely to frequently counsel on and promote weight loss to patients with a higher BMI. 7 Despite recommendations to obtain waist circumference measurements in addition to BMI during routine clinical visits, 20 many PCPs fail to do so. 6 One explanation for this may be that manual circumference measurements, while advertised as quick and easy, may actually be time consuming (due to multiple measurements needed) and also perceived as invasive or uncomfortable for obese individuals. Here, we provide body silhouettes using a simple photograph and use of the AGR as an indicator of body fat distribution to illustrate the variations among pre-and postmenopausal AA and EA women beyond BMI. It has been demonstrated that PCPs have poor visual judgment of weight status and that this judgment influences their propensity for weight management counseling. 37 However, they may be better at identifying fat distribution visually. Additionally, PCPs tend to endorse more stringent weight loss goals for women than men. 38 Findings in the present study indicate that tailoring patient recommendation toward a discussion on their body shape may be more appropriate to facilitate patient education, in lieu of relying on BMI and focusing primarily on overall weight loss, and guide recommendations for optimal health. This is similar to previous research, 5 suggesting that prevention and intervention campaigns should target specific at-risk populations. Discussing body shape and fat distribution may provide a deeper understanding of the potential health concerns associated with regional body fat, but future studies are needed to confirm the proposed benefits of body shape assessments.
The strengths of our study include the use of silhouettes to illustrate the racial differences in body fat distribution among women. We also highlight the relationship between objectively measured body shape and cardiometabolic conditions among women of different racial backgrounds. There were several limitations to the current study. Our use of self-reported data to indicate cardiometabolic health conditions and medications may be limited due to potential errors in reporting as well as the potential of participants being undiagnosed. However, it has been previously shown that participants are able to give accurate recall of medical and drug usage history in well-defined chronic conditions. 39 The generalizability of our sample is limited as we report only on AA and EA women. Within our total sample, the BMI of our participants varied widely between AA and EA, leading us to group women with similar BMI into obesity status groups to examine potential racial/ethnic differences in body shape and composition that may have been missed when examining our total population. Furthermore, the difference in BMI resulted in a small sample size for some of the analysis comparing fat distribution and body composition by race/ethnicity.
The use of visual cues alongside traditional methods of assessing weight status may help facilitate weight management conversations between PCPs and patients. However, further development of a cost-effective visual method for PCPs to help depict and examine fat distribution is warranted.
Author Contributions
Conceived and designed the experiments: OA. Analyzed the data: PLC, AWK, ELM, and OA. Contributed to the writing of the manuscript: PLC, AWK, ELM, and OA. Agreed with manuscript results and conclusions: PLC, AWK, ELM, and OA. Jointly developed the structure and arguments for the paper: PLC, AWK, ELM, and OA. Made critical revisions and approved the final version: PLC, AWK, ELM, and OA. All authors reviewed and approved the final manuscript.
Footnotes
Acknowledgments
We would like to thank all of our participants for participating in our study. We would also like to thank Howard William Wiener, Pradip Chitrakar, Ligaj Pradhan, Dr. Tiffany L. Carson, and Dr. Nicole Redmond.