
Abstract
The protease inhibitor Lopinavir (LPV) combined with low dose ritonavir (r) in the formulation of a soft gelatine capsule (SGC) has been widely used in antiretroviral therapy and has been shown to produce safe therapeutic plasma levels. In June 2006, the LPV/r combination was approved as a tablet (TBL) in Germany and since then has replaced the capsule form. The purpose of this study was to analyze and compare pharmacokinetics of Lopinavir both in the new meltrex tablet formulation and the LPV/r soft gelatine capsule during long-term treatment of HIV.
Methods
Included in this study were all patients followed at multiple study centers between January 2003 and August 2007 for whom LPV plasma levels were archived during therapeutic drug monitoring. A total of 4010 LPV plasma levels from 721 patients met these inclusion criteria. From these, those patients for whom complete data sets were missing were excluded from the study. Complete data sets were defined as those data that included information regarding cumulative daily dose, the patient's anti-retroviral drug regimen, and the time of measurement after drug intake. A total of 571 LPV plasma levels from 138 patients met the full criteria for inclusion in this retrospective study. Additionally, a small prospective study of LPV plasma levels in 6 patients with 24 data points was conducted in order to increase the reliability of this report.
Results
At 3 h after dosing, plasma levels of LPV were significantly higher in patients who had received the meltrex tablet (Mdn = 10030 ng/ml, min = 3323, max = 17280) compared to those who had received the soft gelatine capsule (Mdn = 7964 ng/ml, min = 120, max = 17900). This difference was statistically significant (p < 0.05). There were no statistically significant differences between the LPV plasma levels of the tablet and the capsule at 6, 9 and 12 h after dosing. Additionally, there were no differences between the trough levels of LPV in the two formulations. However, great variances of plasma levels were detected at time 12 h after dosing for both treatment groups (s(capsule) = 3213 ng/ml, s(tablet) = 2273 ng/ml).
Conclusion
The LPV/r tablet formulation is able to produce equivalent to significantly higher plasma levels of LPV when compared with the SGC formulation at time 3 h after drug intake. In addition, the known sex difference in the pharmacokinetic profile of the tablet formulation was verified in this study.
Introduction
The HIV protease inhibitor Lopinavir was licensed in a coformulated regimen with a pharmacoenhancer, low-dose Ritonavir (r), for antiretroviral therapy (ART) in 2000 by the U.S. Food and Drug Administration.1,2 Recommended for first and second line therapy in HIV-1 infections, LPV/r is a highly potent and clinically effective antiretroviral drug with a high genetic barrier to viral resistance. It was originally available as soft gelatine capsules (SGC, 133.33/33.33 mg; Kaletra®, Abbott Laboratories, Chicago, IL, USA) dosed 3 × 133.33/33.33 mg BID with food intake and required refrigerated storage. In June 2006 a melt-extrusion LPV tablet (200/50 mg) was approved with a recommended dosing regimen of 2 × 200/50 mg BID independent from food and no requirement of refrigerated storage.3–5 Since there is only limited pharmacokinetic data on TBL-LPV collected in HIV positive patients available, this study analyzes the plasma levels of LPV in HIV-positive patients treated with either the TBL or the SGC formulation in a retrospective-type study. Additionally, in order to increase the statistical reliability of this report, we analysed consecutive LPV plasma levels in a prospective study of patients receiving either the TBL or the SGC formulation.
Material and Methods
Retrospective study: Inclusion and exclusion criteria
From January 2003 to August 2007, 721 HIV-positive patients being treated with LPV/r in either the TBL or the SGC formulation underwent therapeutic drug monitoring of LPV plasma levels at the Laboratory of the Department of Infectious Diseases at the University of Wuerzburg. Plasma samples were collected from 81 different departments, hospitals and clinics from all over Germany. A total of 4010 LPV plasma levels were collected, and all samples were measured using a high performance liquid chromatography (HPLC) based method. LPV plasma trough levels as well as plasma levels at 3, 6, 9 and 12 hours after dosing were recorded for all patients. For patients with more than one plasma sample at a given time after dosing, the calculated mean of the LPV plasma levels was used for purposes of statistical analysis. Only those plasma samples taken from HIV positive patients on LPV/r medication dosed BID with a cumulative daily dose of 800 mg/100 mg were included in this study. Patients with a measured LPV plasma level of <100 ng/ml were excluded based on the high likelihood that these patients did not take the required dose within 12 hours prior to plasma sampling. 6 Additionally patients for whom data sets were incomplete with respect to documentation of cumulative daily dose, regimen and/or time after dosing were excluded. A total of 571 LPV plasma levels from 138 patients met the full criteria for inclusion in this study.
Prospective study: Study design
A prospective pharmacokinetic study was performed with 6 HIV positive patients on LPV/r SGC (3 × 133.33/33.33 mg BID). Consecutive LPV plasma levels at times of Ctrough and 3 h, 6 h and 9 h after dosing were analysed. The same patients were then transitioned to the LPV/r TBL (2 × 200/50 mg BID) regimen. After a minimum of four weeks on the TBL formulation, LPV plasma levels were again analysed in the above-described way.
Analytical method
LPV plasma levels were analyzed in the Laboratory of the Department of Infectious Diseases at the University of Wuerzburg. Blood samples were collected using EDTA-treated tubes which were then centrifuged for 1min at 1000 × g. The plasma was frozen at -20 °C until the date that it was analyzed. After defrosting, each sample was HIV-inactivated by heating to 56 °C for one hour. 500 μl of each plasma sample were mixed with 500 μl of sodium carbonate buffer pH 9.4 and then extracted 2 × with 3 ml diethylether through 5 minutes of centrifugation. After phase separation, the organic phase was evaporated under a stream of mitrogen. The sample extracts then were dissolved in 300 μl 1/15 M KH2PO4: MeOH: CH3CN (1:0.5:0.5 pH 6.3) and washed with 1ml of n-Hexane (5 min centrifugation). The n-Hexane was subsequently decanted and discarded. One-hundred microliters of each sample were injected into a High Performance Liquid Chromatography (HPLC) System. The eluate was analyzed using a wavelength of 210 nm. The control samples were obtained from Abbott Laboratories. All chemicals and solvents used were from Merck (Darmstadt, Germany). The HPLC-System consisted of a Beckman solvent delivery pump, a Triathlon autosampler, and a Beckman 168 PDA. The analytical software used was 32 Karat Software (Beckman).
Statistical analysis
Data were compared using a two-tailed t-test in cases where all data were normally distributed or the Mann-Whitney test and Wilcoxon signed rank test in all other cases. Outliers detected in data using t-tests were square root transformed to reduce their impact. Significance was set at p < 0.05. The analyses were performed using SPSS software 11.0. All LPV concentrations are stated in ng/ml.
Results
In the retrospective study there was no difference in TBL-LPV plasma levels compared to the SGC-LPV plasma levels at 6 h, 9 h and 12 h after dosing or for the trough level. However, at time 3 h after dosing the TBL-LPV plasma levels (Mdn = 10030 ng/ml, n = 48) were significantly higher than the SGC-LPV plasma levels (Mdn = 7964 ng/ml, n = 93) (Fig. 1). Additionally, the variances of plasma levels of both groups (n(cps) = 54, n(tbl) = 129) at the time 12 h after dosing (s(tablet) = 2273 ng/ml, s(capsule) = 3213 ng/ml) were significantly different. Both differences were found to be statistically significant (p < 0.05). In contrast, the variances of the trough level and the plasma levels at the times 3 h, 6 h and 9 h after dosing of both groups, SGC and TBL, demonstrated no statistically significant differences (Fig. 1, Table 1). In a comparison between gender groups at times 3 h and 12 h after dosing, a statistically significant difference in LPV plasma levels was demonstrated between the male and the female TBL-groups at time 12 h after dosing. The female TBL-group was found to have significantly higher plasma levels (Mdn(female) = 6378 ng/ml, n = 15; Mdn(male) = 4383 ng/ml, n = 39) (p < 0.05). However, no statistically significant differences were found between LPV plasma levels in female and male patients in the SGC group at times 3 h and 12 h after dosing or in the TBL-group at the time 3 h after dosing. Despite this, an overall trend toward higher LPV plasma levels in female patients compared to male patients was noted in all groups (Table 2).
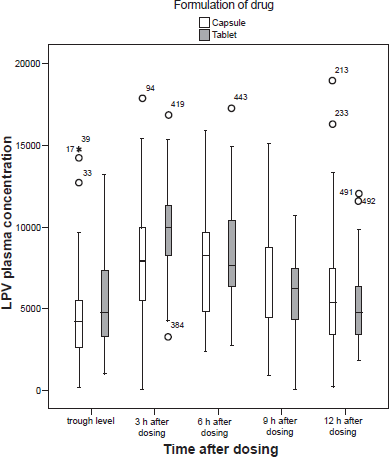
Retrospective study. LPV-plasma levels of the retrospective study graphed in a box blot for the time immediately before dosing (Ctrough) as well as times 3 h, 6 h, 9 h, and 12 h after dosing for each formulation (SGC, soft gelatine capsule; TBL = Meltrex tablet formulation), n(Ctrough, cps) = 39, n(3 h, cps) = 93, n(6 h, cps) = 28, n(9 h, cps) = 48, n(12 h, cps) = 129, n(Ctrough, TBL) = 38, n(3 h, TBL) = 48, n(6 h, TBL) = 21, n(9 h, TBL) = 25, n(12 h, TBL) = 54.
SGC and TBL LPV plasma concentrations were compared at 3, 6, 9 and 12 h after dosing as well as immediately before dosing (Ctrough). if t-test assumptions were not met, Mann-Whitney test was performed to compare median.
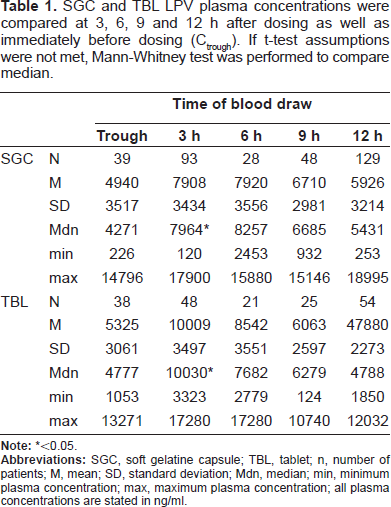
<0.05.
SGC and TBL LPV plasma concentrations were compared at 3 and 12 h after dosing. since t-test assumptions were not met, Mann-Whitney test was performed to compare median.
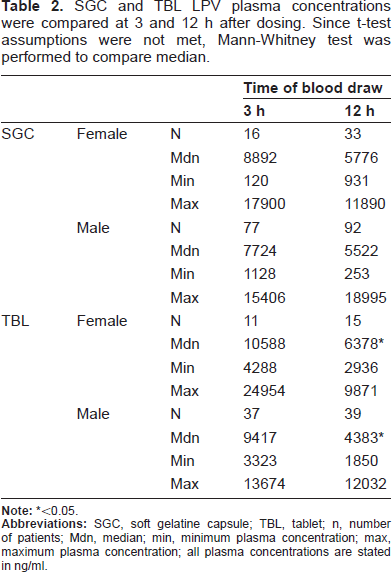
<0.05.
Figure 2 presents data from the small above-described prospective study and shows the consecutive LPV-plasma levels for each of the six patients who were first treated with the SGC-LPV/r regimen and then later treated with the TBL-LPV/r formulation. No statistically significant differences were detected between LPV plasma levels of the two drug formulations at the times of trough level as well as 3, 6 and 9 h after dosing. However, the power of this study was very limited due to sample size.
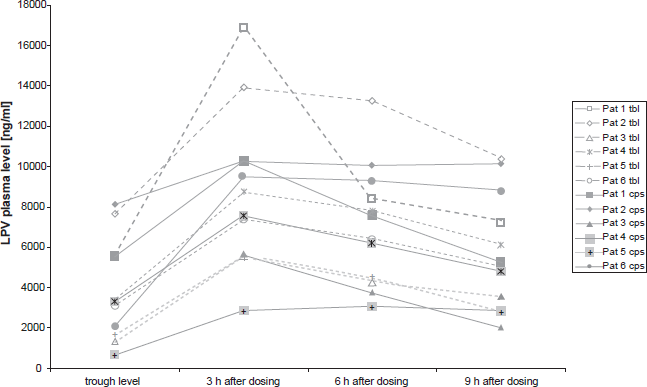
Prospective study. Consecutive Lopinavir plasma levels (Ctrough and 3 h, 6 h, 9 h after dosing) for each formulation (soft gelatine capsule vs. Meltrex tablet).
Discussion
In general, this study shows that changing formulations can have an impact on pharmacokinetics, making therapeutic drug monitoring a useful tool for clinicians, especially as an increasing number of drugs become available as melt extrusion manufactured tablets.
A LPV pharmacokinetic study conducted earlier by Klein et al 7 showed that LPV plasma levels seem to rise more rapidly after single administration of the tablet formulation compared to the SGC formulation in non-steady state healthy volunteers, whereas the overall concentration profiles stay the same. This corresponds to our findings in this first study of HIV positive patients in LPV TBL steady state: the LPV/r tablet formulation is able to produce equivalent or even higher plasma levels than the SGC formulation at the time 3 h after drug intake. The data indicates that the Lopinavir absorption within at least the first 3 hours after dosing is increased for the tablet compared to the capsule. The LPV-TBL formulation produced a median plasma level of 10030 ng/ml (compared to 7964 ng/ml for the capsule) at 3 hours after dosing (retrospective study). The lowest determined plasma level in this group was 3323 ng/ml, and the highest was 16868 ng/ml.
As seen in the retrospective study, the prospective study with cumulative plasma levels revealed no significant differences in the trough level or the plasma levels 6 and 9 h after dosing between the capsule and the tablet. And though likely due to the limited number of patients, no significant difference in LPV plasma levels between the two formulations at time 3 h after drug intake was detected. However, 4 of the 6 patients had higher LPV plasma levels at 3 h after drug intake when receiving the TBL formulation. Thus, the findings of this small prospective study were congruent with those of the larger retrospective study, with both studies indicating that the capsule and the tablet have similar pharmacokinetic profiles, though the TBL formulation may produce a slightly higher 3 h LPV plasma level.
Melt Extrusion is described as a new, innovative technique of pharmaceutical manufacturing operations converting raw material into a product of uniform shape and density with a potentially lower degree of variability in bioavailability. 8 The variances of the LPV plasma levels for the tablet formulated by Melt Extrusion were therefore compared to the variances of plasma levels for the capsule formulation in this study. At the time 12 h after dosing there is a significant difference between the variance of LPV-TBL plasma levels and the variance of LPV-SGC plasma levels (s(tablet) = 2273 ng/ml, s(capsule) = 3213 ng/ml) supporting the hypothesis that the TBL formulation is characterized by a lower degree of variability in bioavailabilty.
A review of sex differences in antiretroviral pharmacokinetic profiles by Ofotokun (2007) states that current evidence, though limited, suggests evidence of a sex disparity in antiretroviral pharmacokinetics. 9 For protease inhibitors boosted with Ritonavir there appears to be a trend towards higher drug exposure in women than in men. 10 In our study we observed LPV plasma levels 3 and 12 h after dosing for the tablet as well as the capsule. Although there were slight tendencies towards higher LPV plasma levels for females in all subgroups (all medians of the female groups were higher than in the corresponding male groups), only plasma levels at the time 12 h after dosing (TBL group) differed significantly between the female and male groups, with the female plasma levels being significantly higher. Physical differences between males and females may account for this difference in LPV plasma levels. However, Ofotokun also discusses molecular differences between sexes, e.g. differences in drug transporters, as a possible cause of gender discrepancies in pharmacokinetic profiles. 10
Conclusions
In summary this study demonstrates that the new tablet formulation of LPV/r offers a similar pharmacokinetic profile compared to the established soft gelatine formulation. Therefore, from the clinical pharmacological point of view, similar safe antiviral plasma levels are achieved.
Disclosure
The authors report no conflicts of interest.
Footnotes
Acknowledgment
The study was supported by grants from Abbott GmbH and Co. KG.