
Abstract
Background
Bipolar disorder is a lifelong problem with imperfect available treatments. Recent research has shown potential benefit of nutritional treatment for mood symptoms. The goal of the current study was to determine whether adults with bipolar disorder reported treatment benefit from consuming a micronutrient formula.
Methods
Self-report data were available from 682 adults who reported a diagnosis of bipolar disorder; 81% were taking psychiatric medications. Those reporting additional diagnoses were excluded, as well as those who provided data <60 times during 180 days of using the micronutrients, leaving 358 for analysis.
Results
Mean symptom severity was 41% lower than baseline after 3 months (effect size = 0.78), and 45% lower after 6 months (effect size = 0.76) (both paired t-tests significant, p < 0.001). In terms of responder status, 53% experienced ≥50% improvement at 6 months. Half the sample were taking medications approved for bipolar disorder (lithium, anticonvulsants, atypical antipsychotics), and half were either medication-free or taking other medications: the magnitude of treatment benefit did not differ between these two groups. Regression analyses indicated that decreased symptom severity over the 6 months was associated with increasing micronutrient dosage and with reducing medication. Symptom improvements were significant and sustained at 6 months, suggesting that benefits were not attributable to placebo/expectancy effects.
Conclusions
Further research on this micronutrient formula is warranted.
Prospective longitudinal studies have demonstrated the chronicity of bipolar symptoms across the lifespan, with a tendency for increasing prevalence of depressive symptomatology.1,2 In this context, the recent conclusions drawn from both published and unpublished data that indicated little benefit from anti-depressant medication have been disappointing, especially because clinical trials rarely examine benefits beyond 6–8 weeks.3,4
For at least a century, there have been reports of psychiatric benefits from nutritional supplementation, usually single-nutrient interventions: e.g. folate, calcium, selenium, magnesium, or omega-3 fatty acids. 5 Single-nutrient research was grounded in previous successes in other disorders as far back as the use of vitamin C for scurvy, and including some mental disorders such as using niacin to treat the dementia associated with pellagra, and B12 for the psychosis of pernicious anemia. Some studies using single nutrients for the treatment of mood symptoms have yielded promising results, 6 but not usually as dramatic as drug treatment. For example, pilot data for omega-3 fatty acids in mood disorders suggested a medium effect size. 7
Since about 2000, there has been increasing evidence that multi-ingredient formulas of micronutrients (primarily vitamins and minerals, but also including fatty acids, amino acids, and botanicals) may be significantly more beneficial than single-ingredient nutritional interventions.8–17 In each of these case studies, case series and clinical trials, the intervention has consisted of 20 or more micronutrients, and large effect sizes have been reported. In two case studies, on–off control of mood and temper problems were demonstrated using ABAB reversal designs, with benefits sustained for 4 years. 11 Recently, on-off control of symptoms has been reported in a case study of a young man with obsessive compulsive disorder (OCD). 17 Gesch's study of young inmates employed a formula with similarities to the one investigated for the current database analysis, in that it contained 25 vitamins and minerals, but it also contained some essential fatty acids; consumption was associated with significantly decreased antisocial acts. 13
As reviewed elsewhere, 5 there are several possible models that can explain how broad-based micronutrient treatment might alter mental function. For instance, micronutrients function as cofactors in enzymatic reactions responsible for synthesizing and metabolizing neurotransmitters. In many genetic diseases that affect human health, symptoms respond to micronutrient treatment, the goal of which is to provide sufficient co-factors that even enzymes with drastically reduced binding affinity become so saturated that near-normal function is restored. 18 In many genetic variants, micronutrients provided to a patient have completely compensated for the mutation which led to suboptimal enzyme cofactors. 18 An alternative model for explaining underlying mechanisms involves energy metabolism: for instance, it has been proposed that some mood symptoms represent a mitochondrial disease associated with decreased mitochondrial energy metabolism.19,20 Perhaps micronutrients compensate for inadequate levels of mitochondrial activity.
Aims of the Study
Because of the incomplete benefit from pharmaceuticals and from single nutrient interventions in treating mood symptoms, and the more promising results from multinutrient formulas, we investigated the long-term benefits of broad-based micronutrient treatment.
Material and Methods
Data Source
A database of people who purchased a micronutrient formula and provided self-report symptom data to the product's developers became available for analysis. The product is primarily a vitamin-mineral formulation, a and most clients find the company while searching the internet to learn about the natural treatment of mental disorders. An unusual feature of the way in which the company sells this formula, and the characteristic which enabled the authors to perform the analyses described below, is that they maintain a telephone support line, keeping in touch with clients to educate them about the use of the product, and to track problems and successes. Individuals wanting to take the product only for general health can just purchase it and the product is mailed to them. However, people wanting to take it for amelioration of psychiatric or neurologic symptoms are encouraged to use a checklist to monitor their progress, usually using symptoms specified in the DSM-IV. 21 The Self-Monitoring Form which forms the basis of the current analyses consists of 16 DSM-specified mood symptoms (e.g. loss of interest in hobbies or activities; an excessively high or elated mood). Clients were asked to rate each symptom from 0 (not at all) to 3 (very much), for a maximum score of 48. Use of the Self-Monitoring Form is voluntary, and not all of the company's clients choose to use it.
The 36 ingredients of this formula (called EMPowerplus) are listed on the developer's website (Truehope.com): they consist of 14 vitamins, 16 minerals, 3 amino acids, and 3 antioxidants. Neither author is financially affiliated with the company.
Subjects and Materials
Data were available from 682 adults who provided information to the company's database from January 2001 (when the database was incorporated into standard use by the company) through August 2007. These 682 were all the adults in the database who reported that they had been diagnosed with bipolar disorder. The database used in these analyses was anonymous, using assigned identifier numbers.
The same 36 ingredients have always been present in this formula, but one change in the preparation occurred during the time period evaluated here. To reduce the number of capsules, the processing method changed in November 2002, resulting in a decrease from 32 to 15 capsules per day for the full adult dose. Prior publications of this formula used the old version;9–12,14 several recent studies have used the current one.15–17
The following considerations guided the selection of the final sample:
Diagnoses
There were 682 participants who reported having been diagnosed with bipolar disorder: 378 with no other disorders, 17 with both depression and bipolar disorder, and 287 with bipolar disorder as well as additional diagnoses such as Attention Deficit Hyperactivity Disorder (ADHD), Obsessive Compulsive Disorder (OCD), anxiety-panic, or schizophrenia. The conservative selection of just the 395 reporting bipolar disorder but no additional disorder except for the 17 also reporting depression was an attempt to reduce the heterogeneity of the sample.
Although physician confirmation of diagnosis was not available, 81% of the sample were taking psychiatric medications at the time they commenced taking the micronutrients, indicating that a physician considered their mood symptoms to be sufficiently severe to warrant medication. The 20 most-frequently-used medications are listed in Table 1; the distribution of medication use over the course of the study period is in Table 2.
20 most commonly prescribed medications taken by clients.
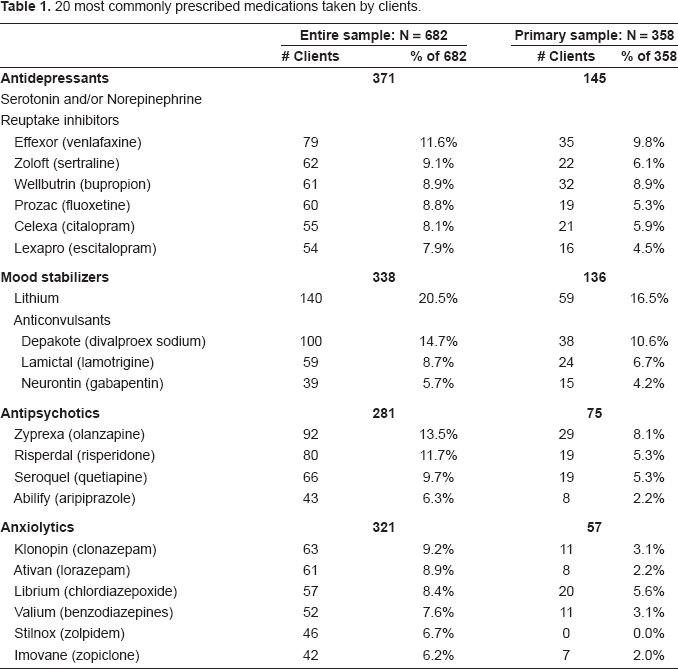
Psychiatric medication index. a
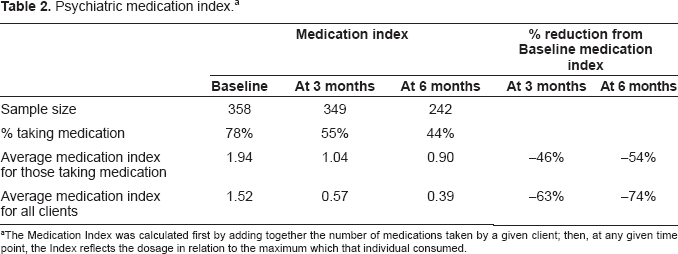
The Medication Index was calculated first by adding together the number of medications taken by a given client; then, at any given time point, the Index reflects the dosage in relation to the maximum which that individual consumed.
Symptom Monitoring
Filling in a symptom checklist by internet or FAX is a burden for many clients with mental health problems, and even the most well-organized, compliant clients might not provide daily reports for very long. To increase confidence in the reliability of clients' data employed for these analyses, we required symptom reports for at least 60 of the first 180 days after starting the micronutrients; this minimum excluded 9% of the sample, leaving 358 clients in the Primary Sample analyzed below. The number of reporting days were distributed as follows: 15% of the 358 clients reported between 60 and 90 days of the 180 days, 22% between 91 and 120 days, 21% between 121 and 150 days, and 42% of clients reported >150 of the 180 days.
Baseline Symptom Data
A minimum of three days of symptom data was used to calculate a baseline index of symptom severity. In some cases, this requirement meant that a day or two of data assigned to baseline coincided with the beginning of treatment. However, since most people begin at a very low dose of the micronutrient formula and titrate upward over the course of a week, symptom changes in the first three days would probably not be attributable to the nutrients in a sample of adults. To the extent that this judgment is in error, inclusion of days after treatment onset would contribute to underestimating the formula's effectiveness by lowering baseline symptom scores and making it more difficult to show symptom reduction associated with micronutrient use. For those with more than three days of symptom data preceding the start of treatment, the baseline index was averaged over all such days.
Calculation of Medication Index
There were 64 people who took no psychiatric medication in the baseline period or the following 6 months, and 294 who did report medication use for at least part of that time. Where appropriate, these two groups are compared. The Medication Index was calculated first by adding together the number of medications; then, at any given time point, the Index reflects the dosage in relation to the maximum which that individual consumed. For instance, a client taking two medications at maximum dosage in the baseline period would have a baseline Medication Index of 2, but if the dose of one medication was decreased by 25% in month 3, then the Index would be 1.75 (cf. Tables 1 and 2).
Results
Database and statistical software used included Access, Excel, Tableau, and EViews. The final Primary Sample of 358 consisted of 120 males and 238 females, aged 18–81 years (M = 42.0, SD = 11.9). Mean daily dose of the micronutrient formula in month 3 was 15.2 capsules (SD = 7.2); in month 6 mean daily dose was 15.7 capsules (SD = 6.7).
General Findings on Effectiveness
For the Primary Sample, use of the micronutrients was associated with a 41% drop in mean symptom severity scores at 3 months, and 45% at 6 months (Table 3). As indicated in that table, these changes were based on 349 who were still reporting symptom scores at 3 months and 242 at 6 months. Using a paired t-test, both decreases were statistically significant when compared to baseline levels: results at 3 months compared to baseline for the 349 reporting symptom data at 3 months (t(df = 349) = 14.5, p < 0.001), and results at 6 months compared to baseline for the 242 still reporting symptoms at 6 months (t(df = 242) = 12.7, p < 0.001), and the symptom severity at 6 months was lower than at 3 months (t(df = 234) = 2.9, p = 0.002). Effect Size (based on Cohen's d, calculated as the difference in mean symptom severity at Baseline and at 3 mos. (6 mos.), divided by the standard deviation of the differences across clients) was 0.78 at 3 months and 0.76 at 6 months.
Symptom severity at baseline, at 3 months and 6 months.
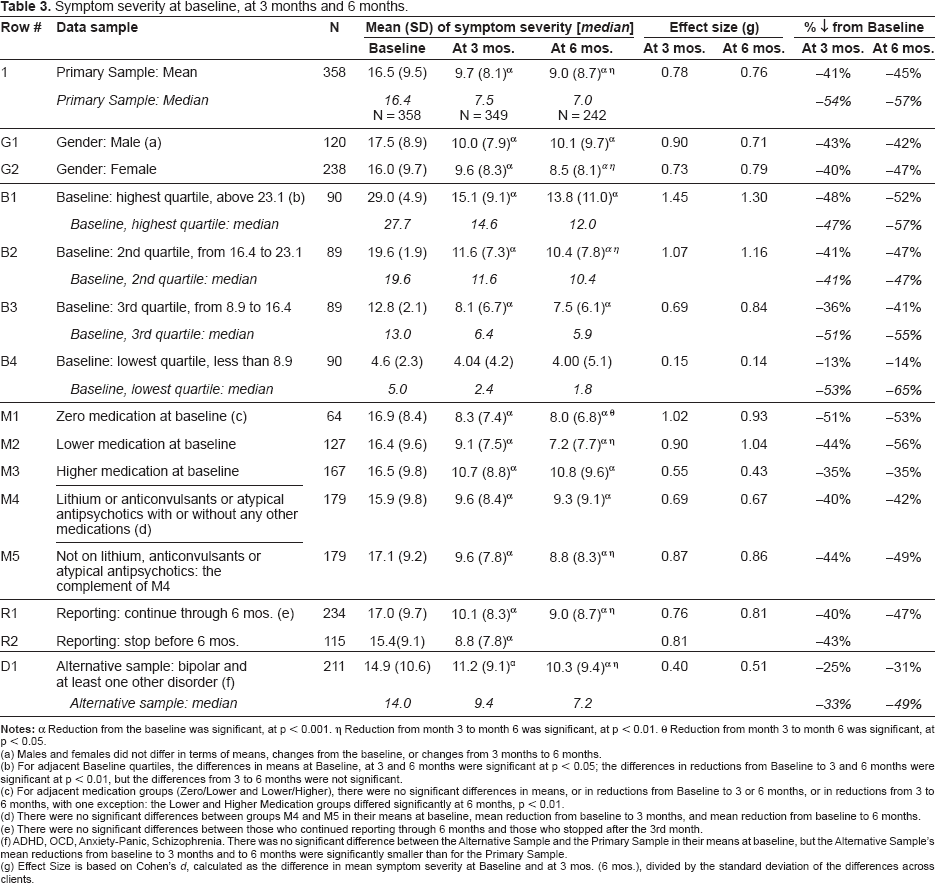
Reduction from the baseline was significant, at p < 0.001.
Reduction from month 3 to month 6 was significant, at p < 0.01. θ Reduction from month 3 to month 6 was significant, at p < 0.05.
(a) Males and females did not differ in terms of means, changes from the baseline, or changes from 3 months to 6 months.
(b) For adjacent Baseline quartiles, the differences in means at Baseline, at 3 and 6 months were significant at p < 0.05; the differences in reductions from Baseline to 3 and 6 months were significant at p < 0.01, but the differences from 3 to 6 months were not significant.
(c) For adjacent medication groups (Zero/Lower and Lower/Higher), there were no significant differences in means, or in reductions from Baseline to 3 or 6 months, or in reductions from 3 to 6 months, with one exception: the Lower and Higher Medication groups differed significantly at 6 months, p < 0.01.
(d) There were no significant differences between groups M4 and M5 in their means at baseline, mean reduction from baseline to 3 months, and mean reduction from baseline to 6 months.
(e) There were no significant differences between those who continued reporting through 6 months and those who stopped after the 3rd month.
(f) ADHD, OCD, Anxiety-Panic, Schizophrenia. There was no significant difference between the Alternative Sample and the Primary Sample in their means at baseline, but the Alternative Sample's mean reductions from baseline to 3 months and to 6 months were significantly smaller than for the Primary Sample.
(g) Effect Size is based on Cohen's d, calculated as the difference in mean symptom severity at Baseline and at 3 mos. (6 mos.), divided by the standard deviation of the differences across clients.
In the absence of physician confirmation of diagnosis, it was thought that the 13% of the Primary Sample taking only an antidepressant might in fact be suffering from depression rather than bipolar disorder. These analyses were recalculated excluding those individuals, with no change in the statistical results. A similar analysis was conducted for the 19% of the sample taking no medication: again, the symptom change did not differ. All symptom decreases were in the 40%-50% range.
There were several outliers with high symptom severity at both 3 months and 6 months, making examination of the median scores more informative than mean scores (cf. Table 3). The median symptom severity was 54% lower than the baseline after 3 months, and 57% lower after 6 months.
Figure 1 showing symptom changes across 6 months does not imply that all clients experienced uniform reductions in symptom severity, nor that the reductions were proportional to baseline symptom severity. There is substantial heterogeneity across clients in their symptom severity at baseline and in their response to the micronutrient treatment over time, with most experiencing considerable improvement, while some experienced little or no improvement. In Figure 2 each client's symptom severity is plotted with two points: at baseline in red, and at 6 months in grey; clients are ordered from left to right by baseline symptom severity. Most grey points lie below their corresponding red points, illustrating the finding that most clients experienced a reduction of symptom severity; 8% of clients were symptom-free at 6 months, indicated by the grey points plotted along the horizontal axis. The 18% of clients whose symptoms worsened at 6 months are those grey points plotted above their corresponding red points.
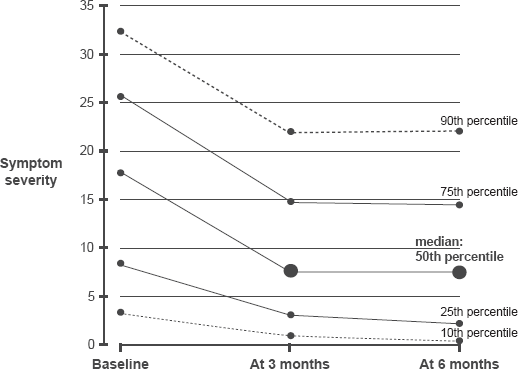
Symptom severity for entire sample at baseline, at 3 months and 6 months.
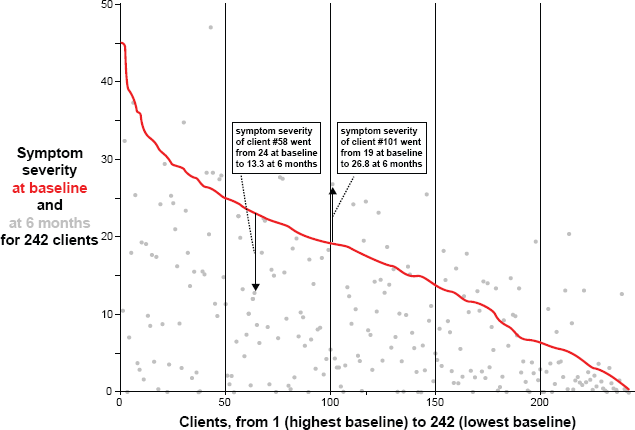
Symptom severity at baseline (in red) and at 6 months (in grey), for 242 clients.
An alternative view of this heterogeneity is shown in Figure 3, which plots the distribution of clients' percent changes in symptom severity from baseline to 6 months; clients are ordered from left to right according to their percent reduction from baseline. After 6 months of taking the micronutrients, 8% of the sample was symptom-free, 24% experienced reductions between 75%-99%, 21% between 50%-74%, 18% between 25%-49%, and 11% experienced reductions <25%. As mentioned above, 18% reported increases in symptom severity.
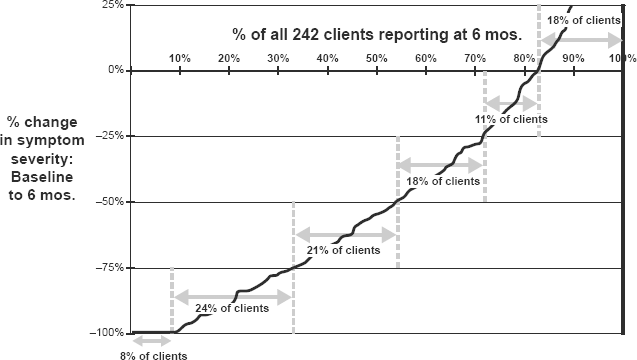
Percent change in symptom severity from baseline to 6 months: distribution across clients.
The results for males and females were similar (Table 3): statistically significant declines from the baseline at 3 months (male: t(118) = 9.6, p < 0.0001; female: t(231) = 11.1, p < 0.0001), with additional declines at 6 months that were significant for females (t(155) = 3.3, p < 0.001) but not for males. Using two-sample t-tests for means, there were no significant differences (at p < 0.05) between males and females at the baseline, at 3 months, or at 6 months.
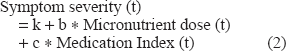
Symptom Severity as a Function of Micronutrient Dose
A linear regression analysis was carried out to determine whether symptom severity over time, from the baseline through months one to six (time index t), was explained by the micronutrient dose, expressed as follows:
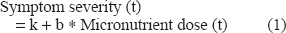
Regression results (Table 4) indicate that the micronutrient coefficient b = −0.09 had the expected sign and was statistically significant, with a low standard error, high t-statistic, and p < 0.001. As indicated by the Adjusted R 2 , 72% of the variance in symptom severity is accounted for by the micronutrient dose. The fact that the coefficient for the micronutrients was negative indicates that decreasing symptom scores were associated with increasing dosage of the micronutrient formula; for each one-unit increase in micronutrient dosage, the level of symptoms declined by 0.09 units.
Regression coefficients in linear equations for symptom severity.
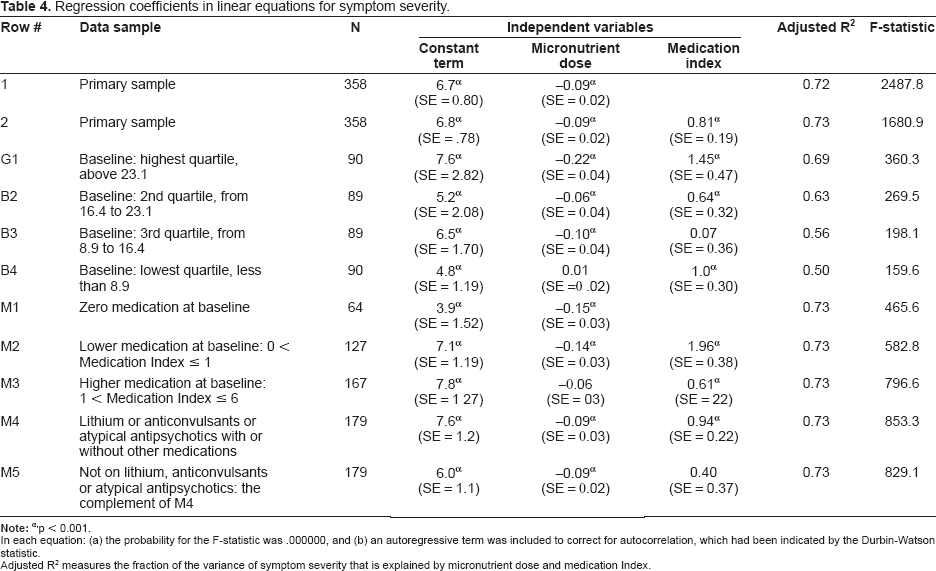
p < 0.001.
In each equation: (a) the probability for the F-statistic was .000000, and (b) an autoregressive term was included to correct for autocorrelation, which had been indicated by the Durbin-Watson statistic.
Adjusted R 2 measures the fraction of the variance of symptom severity that is explained by micronutrient dose and medication Index.
Similarly, dividing the entire Primary Sample into quartiles determined by baseline symptom severity as shown in Table 3, each of the four groups' mean symptom severity levels at 3 and 6 months was lower than the baseline by significant amounts, except for the lowest quartile where the differences were not significant. Symptom levels at 6 months were lower than at 3 months, but the difference was significant only for the 2nd quartile. Due to outliers with high symptom severity, median levels of symptom severity were lower than mean levels for most baseline quartiles, and the percentage declines in the medians were larger than those of the means for the two lower quartiles. There was a slight tendency for those with higher scores at baseline to be more likely to continue submitting their data (70 and 71% for the top two quartiles) at 6 months than those with lower baseline severity scores (63 and 67% for the bottom two quartiles).
Relationship between Symptom Improvement and Presence of Psychiatric Medication
One important question is whether the effectiveness of the micronutrient treatment was influenced by psychiatric medication. Clients were divided into three groups: those who were not on medication over the 6-month period (N = 64), those who did take medication at some point but had a relatively low Medication Index (≤ 1.0) in the baseline period (N = 127), and those whose Medication Index during baseline was greater than 1.0 (N = 167). As shown in Table 3 and Figure 4, all three groups experienced significantly decreased symptoms from baseline to 6 months (all p's < 0.001). However, the group with the higher Medication Index seemed to be somewhat disadvantaged: the magnitude of their improvement was more moderate (about 35% compared to 44%-56% for the others). In addition, they sustained their symptom improvement at 6 months, but did not continue to improve as the other two groups did. There was no appreciable difference in the dropout rate (from 358 at baseline to 242 at 6 months) across the three medication levels, from not on meds (28%) to lower medication index (34%) to higher index (30%).
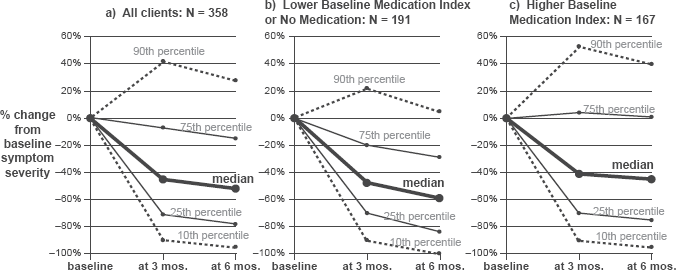
Percent change in baseline symptom severity: effect of baseline medication level.
Figure 4 illustrates the relationship between Medication Index and treatment benefit: note the 75th percentile which showed no benefit if the client entered treatment with a relatively high Medication Index (Fig. 4c), but a 20%-30% improvement in symptoms if they began the micronutrients on little or no psychiatric medication (Fig. 4b).
Additional analysis was based upon the type of medication being taken. Half of the 358 clients were taking medications from the three categories approved for bipolar disorder (lithium, anticonvulsants or antipsychotics), with or without other medications: row M4 in Table 3. There was no significant difference between this group and the remaining clients (row M5).
A second regression was examined, in which the Medication Index was used as an additional predictor variable:
For the entire Primary Sample (N = 358), regression results are shown in row 2 of Table 4. The coefficient for Medication Index is positive (0.81) and significant (p < 0.001), indicating that lessening of medication over the 6 months was associated with lower symptoms: one unit decrease in Medication Index was associated with 0.81 units less of symptom severity. The constant term and the micronutrient coefficient are similar to those in equation (1) and are again significant (p < 0.001): symptoms are lowered by 0.09 units for each unit increase in micronutrient dose.
Results for this regression are shown in Table 4 for each baseline quartile as well: rows B1-B4. Results are generally similar, but the regression statistics (Adjusted R 2 and F-statistic) are lower as the quartiles decrease. For the two upper quartiles' regressions, all coefficients are statistically significant; for the two lower quartiles, which may be influenced by a 'floor effect,' one coefficient is not significant (Medication Index for the 3rd quartile's regression and micronutrient dose for the lowest quartile's).
Table 4 also shows regression results separately for the three groups based upon medication at baseline: Zero (row M1), Lower Medication Index (row M2) and Higher Medication Index (row M3). In each of the three equations, all coefficients have the expected signs and are statistically significant (except for dose for higher medication group). Those with Lower Medication Index at baseline experienced greater symptom-reducing effects from the micronutrients (-0.14) and greater effects from lessening Medication Index (+1.96), in comparison with those who had a Higher Medication Index baseline, who experienced less reduction in symptoms from increasing the micronutrients (−0.06 vs. −0.14) and from lessening Medication Index (+0.61 vs. +1.96).
Age was also entered into the regression analyses for the Primary Sample, for equations (1) and (2), but it was not a significant predictor of symptom change.
Consideration of Drop-Outs
About 30% of the sample reported data for 3 months but stopped reporting before 6 months, raising the question of whether they were treatment failures. To test for this possibility, symptom severity for these individuals was compared with those whose reporting continued through 6 months (Table 3). Those who stopped reporting after 3 months actually had lower symptom severity at 3 months and a greater reduction from the baseline than did those who continued to report, although the difference between these two groups was not statistically significant. The fact that those who stopped reporting before 6 months experienced significant (p < 0.001) decreases in symptom severity (averaging 43%) suggests that lack of benefit does not explain why they stopped reporting.
About 9% of the sample (N = 37) reported data for fewer than 60 days over the 6-month period. Only about 40% of them (N = 14) reported data at 3 months; they experienced a decline in symptom severity of 29%. This group was not analyzed any further because of their small number.
Co-Occurring Diagnoses
Finally, an Alternative Sample was drawn from the original group of 682 adults reporting a diagnosis of bipolar disorder. This sample consisted of all the individuals (N = 211) who reported a diagnosis of bipolar disorder, and in addition reported at least one of the following: ADHD, OCD, anxiety-panic, or schizophrenia, and who had reported data for at least 60 days. This Alternative Sample displayed the same pattern of statistically significant improvement visible in the Primary Sample (cf. line D1 in Table 3), although the magnitude of the changes was more modest.
Discussion
These database analyses of 358 adults with bipolar disorder revealed significant symptom amelioration at 3 months that was sustained at 6 months. All individuals purchased a broad-based 36-ingredient micronutrient product and chose to track their progress on a mood checklist. The data presented here were from people who submitted those checklists on at least 60 of the 180 days.
The symptom decrease for the entire Primary Sample was about 45% if based on mean values; however, the presence of some outliers with very high symptom scores makes the median scores more informative. Based on medians, symptom amelioration exceeded 50%. Another way to look at the results is in terms of individual responder status: 53% experienced ≥50% improvement at 6 months. The decrease in symptom severity was robust enough to be significant across gender and baseline medication use. Symptom decreases were significant for both sexes, although females continued to accrue benefit at 6 months whereas males only maintained their previous improvement. The decrease in symptoms was significant for individuals who were taking psychiatric medications as well as those who were not. It is noteworthy that all medication groups had comparable symptom severity at baseline (Table 3). However, those in the highest category of medication use (Medication Index > 1.0) benefited less from the micronutrient treatment by 3 months and 6 months.
The interplay between medication use and symptom severity is difficult to disentangle in a database analysis. There is some support from the regression analyses for the idea that medication use interfered with the formula's ability to benefit the patients, as decreasing medication use predicted greater symptom improvement. Relevant to this argument is the research demonstrating that nutrients amplify the effects of psychiatric medications. 22 Popper reported this phenomenon specifically with the micronutrient product reported here, 10 and possible mechanisms for such amplification have been discussed elsewhere.5,10 Very recently, in a review by the Harvard Mental Health Letter, 23 it was said that certain nutrients (folic acid, SAMe, and omega-3 fatty acids) have been proven to substantially “boost” response to antidepressant medications. This interaction between micronutrients and psychiatric medication, if supported in further studies, is generally received as good news by patients who would like to reduce their medication dosage.
Perhaps it is important to mention that this formula happens to contain no omega-3s. On the other hand, vitamins and minerals are essential co-factors in the conversion of essential fatty acid precursors into the forms most useful for brain function, EPA and DHA. In fact, Gesch's findings of approximately 35% reduction in violent outbursts, often attributed to the EPA and DHA administered, may also be due to the 25 vitamins and minerals contained in the intervention formula. 13 It is possible that there are both direct and indirect beneficial effects of micronutrients on essential fatty acid availability.
The magnitude of symptom improvement reported here is similar to the 55%-66% improvement reported in a small open label study. 9 The magnitude of medication reduction was also comparable: in that same report, psychiatrists were able to manage the patients on 50% less medication. Interestingly, in the Alternative Sample of 211 adults with bipolar disorder and at least one other diagnosis, the decrease in bipolar symptoms was also significant, though they were slightly more modest than those in the Primary Sample.
There are three types of self-selection bias inherent to this type of study: participation, reporting, and dropping out. With respect to participation bias, people searching for nutritional methods to manage their mood symptoms are likely to have been ineffectively treated by pharmaceuticals, and are not necessarily representative of everyone with bipolar disorder. In other words, many if not most of the participants in this database would probably be considered treatment resistant. One might speculate that they would be the most difficult to treat, rendering these positive findings even more important clinically.
Reporting bias relates to fact that most people who purchase the micronutrient product choose not to track their progress with the monitoring form; the possible extent of this bias cannot be analyzed with the available data. As mentioned, completing dozens of symptom checklists and sending them to the manufacturer would be a burden to those struggling with mental illness.
The third type of self-selection bias would occur if non-responders were more likely to drop out, and cease reporting symptoms. Only 9% of the sample reported fewer than 60 out of 180 days; as described above, they also reported treatment benefit, but their experience was not analyzed further because of their small number (N = 14). Another 30% reported for at least 3 months but stopped reporting before 6 months. It is noteworthy that the analyses demonstrated that these people were not treatment failures, and in fact had lower symptom severity at 3 months and a greater reduction from the baseline than did those who continued to report (Table 3). Hence, people who stopped self-monitoring probably did so because they found it tedious, not because they were treatment failures.
Confirmation of psychiatric diagnosis was unattainable, but the fact that 81% were taking prescribed medications commonly used for mood disorders is strong evidence that a physician was concerned about their unstable mood. Complete medication histories were not requested, so it is possible that many of the other 19% had previously been treated with medication. More importantly, both the 19% who were taking no medication and the 13% who were taking only antidepressants (suggesting the possibility of mis-diagnosis) improved to the same degree as those taking typical bipolar medications (mood stabilizers, and so on). Exactly half the sample of 358 clients were taking one of the three categories of medications approved for bipolar disorder; their patterns of improvement did not differ significantly from the other half.
One of the limitations of this study is the absence of information on some variables which could influence nutrient status and mental health: e.g. dietary intake or concurrent therapies. There are other, unanswerable questions about these 358 patients. For instance, how long had they been treated previously for bipolar disorder? This information was not reported systematically enough to permit analysis.
On the other hand, there were some significant strengths in these analyses. Placebo effects, which plague many studies, are not likely to last 6 months: the fact that the symptom improvements were sustained or even increased at 6 months compared to 3 months argues strongly that these benefits cannot be attributed to placebo or positive expectancy effects. In addition, the analyses showed that those who dropped out did not do so because of lack of benefit.
Since the checklists requested information about micronutrient dose and psychiatric medications consumed, exposure to each of these substances could be tracked reliably and quantitatively. The motivation of some clinical trial participants has been suspect in recent years, as the scientific community has become aware of the fact that some Americans earn a portion of their income and obtain their health care by engaging in 'guinea pigging'. 24 These participants may actually conflate their symptoms, or alter their reporting to maximize their financial gain, thereby distorting the scientific conclusions of the trials in which they participate. A significant strength of the data analyzed here is that the participants were truly volunteers, highly motivated (as evidenced by their consistent data reporting), and not experiencing any financial gain from being a part of the company's data collection. Quite the contrary: they were paying for their own capsules.
The exclusion from the Primary Sample of participants who reported co-occurring disorders is a strength for multiple reasons. First, selecting for a single disorder without common co-occurring diagnoses (e.g. ADHD) makes the participants comparable to those who are in typical pharmaceutical trials, which usually exclude patients with multiple diagnoses. Second, it enabled us to focus our analyses on people whose disorders were likely more clearly definable than people who, over time, may have received multiple diagnoses in various settings. On the other hand, the demonstration that the Alternative Sample showed similar symptom improvement was reassuring, as the individuals in both groups had been told they suffered from bipolar disorder.
It is also a strength that neither author was involved in any way with the data collection, and could not bias the data in any way. Although one author (BJK) is conducting other research on the same formula, neither author and neither of their universities is commercially affiliated with the developer/manufacturer.
Clinical and Scientific Implications
The current study cannot be generalized to population response rates: i.e. although this group of patients benefited approximately 50% in terms of symptom reduction, one cannot conclude that patients with bipolar disorder in general would experience this improvement. On the other hand, the analyses displayed in Table 3, in which dropouts at 3 months were compared to those who continued, strongly suggests that ending data submission was not due to treatment failure. In addition, two small case series reported more than 80% positive responders,10,12 suggesting there is the potential for generalization to a significant segment of patients with mood disorders. Also, we note there is significant evidence of positive response in other research that is in press or under review.15–17
Scientifically, the growing evidence of amelioration of psychiatric symptoms with multinutrient formulas, in addition to the growing evidence of only modest effects from pharmaceuticals,3,4 provides a powerful case for further research on micronutrient treatment. Such research can be difficult to get funded, and perhaps more difficult to publish, 25 yet it appears to be warranted, particularly because of the general absence of adverse 'side effects' from any form of micronutrient treatment thus far studied.8–17 These preliminary analyses, combined with the database results presented here, indicate that further research should be carried out with this multinutrient approach.
Declaration of Interest
None for either author.
Footnotes
Acknowledgments
The second author thanks the Alberta Children's Hospital Foundation for ongoing support.