
Abstract
Background
Published studies report inappropriately low hemoglobin A1C (HbA1c) values that underestimate glycemia in HIV patients.
Methods
We reviewed the charts of all HIV patients with diabetes mellitus (DM) at our clinic. Fifty-nine patients had HbA1c data, of whom 26 patients also had fructosamine data. We compared the most recent HbA1c to finger-stick (FS) glucose averaged over three months, and fructosamine to FS averaged over six weeks. Predicted average glucose (pAG) was calculated as reported by Nathan et al: pAG (mg/dL) = 28.7 × A1C% – 46.7. Data were analyzed using the Statistical Analysis System (SAS) and Kruskal–Wallis test.
Results
HbA1c values underestimated (UE) actual average glucose (aAG) in 19% of these patients and overestimated (OE) aAG in 27%. HbA1c estimated aAG within the established range in only 54% of the patients. There were no statistical differences in the types of HIV medication used in patients with UE, OE, or accurately estimated (AE) glycemia. A Spearman correlation coefficient between HbA1c and aAG was r = 0.53 (P < 0.0001). Correlation between fructosamine and aAG was r = 0.47 (P = 0.016).
Conclusions
The correlations between HbA1c and aAG and between fructosamine and aAG were weaker than expected, and fructosamine was not more accurate than HbA1c.
Introduction
Abnormal glucose metabolism in HIV-infected patients has increased with antiretroviral therapy (ART) and improved longevity. More than 35% of HIV patients have impaired glucose tolerance, compared to 5% in the general population, 1 with 4.6 times the prevalence of diabetes mellitus (DM) in HIV patients. 2 Diabetes diagnosis and management in HIV patients follow general guidelines, which rely on hemoglobin Alc (HbA1c). 3 However, published studies report inappropriately low HbA1c values that underestimate glycemia in HIV patients.4,5
Current guidelines stipulate HbA1c ≥6.5% to diagnose DM based on analysis showing increased prevalence of retinal abnormalities around this value, 6 without a requirement to measure plasma glucose.
Once diabetes is diagnosed, HbA1c, the percentage of glycated hemoglobin (Hgb), is considered the best marker of glycemic control, 4 with treatment often adjusted solely on HbA1c values. However, HbA1c can be affected by many factors, 7 including age, increasing 0.4% from age 40 to age 70; 8 and ethnicity.9–12 Non-Hispanic blacks have a 2.4-fold likelihood of having HbA1c >6% among individuals with fasting glucose <100 mg/dL. 13
Abnormal Hgb or shortened RBC life span, 14 cirrhosis, and renal failure 15 may also alter HbA1c.4,5,16 HIV-positive individuals are hypothesized to be in a chronic low-level hemolytic state from viral infection 17 or ART, 4 affecting the accuracy and consistency of HbA1c, with falsely low values resulting in over optimistic estimates of glucose control. This has led to the suggestion that fructosamine (glycated serum protein) may be a better marker of glycemic control in HIV patients with diabetes than HbA1c.5,18
In our study, we aim to determine the association between HbA1c and actual glucose levels in HIV-positive patients with diabetes. We also compare the accuracy of HbA1c to fructosamine in assessing glycemic control in HIV patients with diabetes.
Methods
We conducted a retrospective chart review of 65 consecutive patients with HIV and DM followed in our clinic during a single calendar year. Our study was granted exemption from review by the IRB of Beth Israel Medical Center, as subjects could not be identified directly or through identifiers linked to the subjects. A total of 59 patients had available HbA1c data, of whom 26 patients had fructosamine data (see flow chart). In all, 57 patients had type 2 diabetes and 2 had type 1 diabetes. Given a lack of evidence to suggest that accuracy of HbA1c or fructosamine is different between type 1 and 2 diabetic patients, all 59 patients were included in the study. We extracted the HbA1c and finger-stick (FS) glucose averaged over three months; and the proximate fructosamine and FS glucose averaged over four to six weeks. We chose the three-month time frame and six-week time frame within the 12-month review period that captured the greatest number of FS values for each patient.
All blood samples were sent to Beth Israel Central Laboratory. HbA1c was measured using high-performance liquid chromatography (HPLC). Fructosamine was analyzed using a colorimetric assay by Quest Diagnostics Laboratory.
Predicted average glucose (pAG) was calculated as reported by Nathan et al 19 : pAG (mg/dL) = 28.7 ×A1C%- 46.7, which estimates a change of 29 mg/dL in plasma glucose for each 1% change in HbA1c, 15 a clinically relevant magnitude. Data were analyzed using the Statistical Analysis System (SAS) v9.2 for the correlation between fructosamine and actual average glucose (aAG), and between HbA1c and aAG. We also examined the proportion of patients whose pAG and aAG values differed by more than 29 mg/dL. Data were further analyzed using non-parametric Kruskal-Wallis test to evaluate differences in age, red cell distribution width (RDW), and Hgb between patients with underestimated (UE), overestimated (OE), and accurately estimated (AE) average glucose.

Results
pAG based on HbA1c estimated aAG within the established range for only 54% of the 59 patients examined. For the remaining patients, 19% had HbA1c values that UE aAG by more than 29 mg/dL, while the HbA1c value in 27% of the patients OE aAG by more than 29 mg/dL (Fig. 1). For the subgroup of patients with at least seven FS values (n = 23), HbA1c UE aAG in 29% of the cases and OE it in 18% of the cases. In this group, HbA1c-based pAG estimated aAG within the measured range for 53% of these patients (Fig. 2), a percentage similar to that for the whole group.

Accuracy of HbA1c in predicting average glucose. Of the 59 patients examined, 19% had A1C values underestimating AG by more than 29 mg/dL, 27% had values that OE AG by more than 29 mg/dL, and 54% had A1C estimating AG within the established range.

Accuracy of HbA1c in predicting average glucose with >7 FSG. Notes: Of 23 patients who had ≥7 FSG values, 29% had A1C values underestimating AG by more than 29 mg/dL, 18% had values that OE AG by more than 29 mg/dL, and 53% had A1C estimating AG within the established range.
All patients analyzed in the study were taking highly active antiretroviral therapy (HAART) for their HIV infection (one patient did not have available HIV medication status). HAART was categorized into three different classes: nucleoside reverse transcriptase inhibitors (NRTIs), non-nucleoside reverse transcriptase inhibitors (NNRTIs), and protease inhibitors (PIs). In all, 100% of patients with UE glycemia, 93% of patients with OE glycemia, and 93% of patients with AE glycemia were on NRTIs. A total of 18% of UE group, 20% of OE group, and 29% of AE group were on NNRTs. Overall, 82% of UE group, 80% of OE group, and 61% of AE group were on PIs (Table l). The percentage of patients taking NRTIs, NNRTIs, and PIs were similar in UE, OE, and AE glycemia groups. Further analysis was not performed because of limited statistical power, given small sample size in each group.
HIV medications.

HIV-positive individuals have been thought to be in a chronic low-level hemolytic state from viral infection 17 or ART, 4 affecting the accuracy of HbA1c. Given the retrospective design of the current study, peripheral blood smear, haptoglobin, and lactate dehydrogenase levels were unavailable to evaluate hemolysis. The RDW and Hgb levels were extracted as surrogate markers, because hemolytic anemia frequently presents with elevated RDW and low Hgb levels. The mean RDW (nl 11–15%) was 14.1% in UE group, 14.6% in OE group, and 14.1% in AE group (Table 2). The mean Hgb (nl 13.2-17.1 g/dL) was 13.6 g/dL in UE group, 13.4 g/dL in OE group, and 13.8 g/dL in AE group (Table 2). A non-parametric Kruskal–Wallis test was performed. There were no statistically significant differences in mean RDW or Hgb in groups with UE, OE, or AE glycemic levels.
Anemia data.

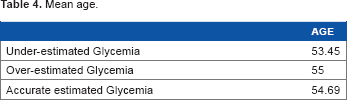
Further data were analyzed to evaluate differences in gender or age in patients with UE, OE, or AE glycemia by HbA1c. In all, 61% of UE group, 38% of OE group, and 63% of AE group were male patients (Table 3). Mean age of patients was 53.45 years in UE group, 55 years in OE group, and 54.69 years in AE group (Table 4). A non-parametric Kruskal–Wallis test was performed. There were no statistically significant differences in mean age in groups with UE, OE, or AE glycemic levels.
Gender differences.

Mean age.
Diabetes medication usage was evaluated in the study patients. Seventy-three percent of UE group, 38% of OE group, and 47% of AE group were on insulin. Twenty-seven percent of UE group, 50% of OE group, and 38% of AE group were on biguanides. Nine percent of UE group, 19% of OE group, and 19% of AE group were on sulfonylurea. Nine percent of UE group, 19% of OE group, and 13% of AE group were on dipeptidyl peptidase-4 inhibitor (DPP-4 inhibitor). Zero percent of UE group, 19% of OE group, and 22% of AE group were on thiazolidinediones (TZDs). Zero percent of UE group, 6% of OE group, and 3% of AE group were on glucagon-like peptide-1 agonists (Table 5). Further analysis was not performed because of limited statistical power, given small sample size in each group.
DM medications.

A Spearman correlation coefficient was computed between HbA1c and aAG (r = 0.53, P < 0.0001) and between fructosamine and aAG (r = 0.47, P = 0.016) (Figs. 3 and 4). Our findings suggest a moderate correlation between HbA1c and aAG as well as between fructosamine and aAG. Our analysis also revealed that HbA1c UE or OE average FS values in almost half of the patients studied (46% of our HIV-infected patients with diabetes).

HbA1c and average FSG.

Fructosamine and average FSG.
Discussion
Given the frequent comorbidities in individuals with diabetes, it is likely that factors that may alter HbA1c are under-recognized and widely overlooked,7,14,20,21 which makes our current reliance on HbA1c questionable.
The accuracy of HbA1c in predicting glycemia in patients with HIV and diabetes has been challenged. Published studies report inappropriately low HbA1c, underestimating glycemia in HIV patients with diabetes.4,5,18 We found only a moderate correlation between HbA1c and aAG and between fructosamine and aAG. Both correlations were weaker than expected and neither was superior to the other. Contrary to previously published findings, we found variability in the direction of the discrepancy between HbA1c and aAG, with both overestimation and underestimation of degree of glycemia.
All analyzed patients in the study were on HAART for HIV infection. There were no differences between the types of HIV medication used and the accuracy of HbA1c prediction of average glucose. It is possible that HIV medications contribute to inaccuracy of HbA1c in predicting glycemia, but pathogenesis is yet to be explained. Although the mean RDW and Hgb levels were within normal range and were similar between the patients who had UE, OE, or AE glycemia based on HbA1c, we cannot conclude that the patients were not in chronic hemolytic state as previously hypothesized. More definitive data, such as peripheral smears, haptoglobin, or LDH, would be needed.
Medications or conditions that affect RBC lifespan, glycation of RBC, and erythropoiesis can all contribute to inaccuracy of HbA1c. Although we know conditions, such as cirrhosis, renal failure, and sickle cell anemia; and medications, such as HAART and dapsone, can affect red cell survival, leading to inaccuracy of HbA1c, there are likely many other conditions and medications that may potentially affect RBC or interfere with HbA1c assays. The similar age, RDW, Hgb, and use of HAART in our study group underscore the importance of additional factors that may affect the accuracy of HbA1c.
Study limitations include retrospective data collection, the limited number of FS values, and lack of data on red cell survival. The sample size did not permit adjustment for gender, race, age, or renal function. While further study is needed, our patients are from a large urban center and reflect the comorbidity of any inner city population. Our findings clearly suggest that fructosamine does not have greater utility than HbA1c in predicting aAG in HIV-infected patients who have DM, and emphasize the importance of complementing HbA1c and fructosamine values with accurate FS reporting in this patient population.
Abbreviations
aAG, actual average glucose; DM, diabetes mellitus; FS, finger-stick; HAART, highly active antiretroviral therapy; HIV, human immunodeficiency virus; pAG, predicted average glucose; OE, overestimated; UE, underestimated; AE, accurately estimated.
Author Contributions
Researched data: SYK, AS. Performed statistical analyses: PF. Contributed to the writing of the manuscript: SYK, PF. Contributed to the discussion and reviewed/edited the manuscript: AMF. Took responsibility for the contents of the article: AMF. Agree with manuscript results and conclusions: SYK, AS, PF, AMF. Made critical revisions and approved final version: SYK, AS, PF, AMF. All authors reviewed and approved of the final manuscript.
Footnotes
Acknowledgments
Jill Gregory, CMI, FAMI, contributed to the figure images.