
Abstract
Exercise intolerance is a common feature of patients with coronary artery disease (CAD). Arterial stiffness is increased in CAD patients; however, the association between arterial stiffness and exercise capacity of CAD patients has not been fully clarified. In this study, we investigated the association between arterial stiffness and the exercise capacity of 62 CAD patients (67 ± 7 yo, 49 men). The patients underwent symptom-limited cardiopulmonary exercise testing and measurement of pulse wave velocity (PWV). The patients were divided into the high-PWV group (n = 31) and the low-PWV group (n = 31), according to the median PWV (1622 cm/sec). In exercise testing, the peak VO2 was lower in the high-PWV group than in the low-PWV group. VE/VCO2 slope was higher and the time to ST depression was shorter in the high-PWV group than in the low-PWV group. Multivariate analysis results showed that PWV significantly correlated with peak VO2 as well as sex. PWV also significantly correlated with time to ST depression and VE/VCO2 slope. In conclusion, patients with high PWV had lower exercise capacity than patients with low PWV. A low myocardial ischemia threshold, as well as an enhancement of the ventilatory response to exercise, was also found in patients with high PWV.
Background
Exercise intolerance is a common feature of patients with coronary artery disease (CAD). The maximum oxygen uptake at peak exercise (peak VO2) is widely used to assess exercise capacity and provides prognostic information [Corra et al. 2004]. Moreover, other studies have demonstrated the clinical significance of hyperventilatory response to exercise, which is indexed by the relationship between minute ventilation and carbon dioxide production (VE/VCO2 slope), as a determinant of exercise capacity [Metra et al. 1992] and a marker of a poor prognosis in not only patients with LV systolic dysfunction [Kleber et al. 2000] but also those with preserved LV systolic function [Guazzi et al. 2005]. Exercise capacity is limited in some patients with coronary artery disease (CAD) even though the left ventricular (LV) systolic function is preserved [Lele et al. 1996]. Previously, several mechanisms such as abnormalities in LV diastolic function [Lele et al. 1996] or peripheral muscle response [Mancini et al. 1992] rather than LV ejection fraction (LVEF) [Franciosa et al. 1981; Szlachcic et al. 1985] were reported to be involved in impaired exercise capacity; however, the precise mechanism underlying exercise intolerance in CAD patients has not been fully elucidated.
Arterial stiffness, which is associated with various cardiovascular risks such as aging [Benetos et al. 1993], hypertension [Benetos et al. 1993], and diabetes mellitus [Wilkinson et al. 2000], is increased in patients with CAD [Gatzka et al. 1998]. Pulse wave velocity (PWV), which is one of the reliable indicators of arterial stiffness [Blacher et al. 1999], is significantly associated with cardiovascular morbidity and mortality [Shokawa et al. 2005] [Willum-Hansen et al. 2006] [Laurent et al. 2001] [Boutouyrie et al. 2002]. Previously, we reported that an increased PWV is involved in the increase in BNP level in patients with CAD [Sakuragi et al. 2007]; however, the association between increased PWV and exercise capacity has not been fully determined in CAD patients. It has been reported that increase in arterial stiffness lowers the ischemic threshold in CAD patients independent of CAD severity [Kingwell et al. 2002], indicating the possibility that arterial stiffening is associated with exercise intolerance of CAD patients.
Accordingly, in this study, we evaluated the relationship between PWV and peak VO2 in CAD patients. In addition, we evaluated the relationship between PWV and hyperventilatory response to exercise, because exercise is often limited by exertional dyspnea or physical fatigue rather than angina in CAD patients [Pantely et al. 1984].
Methods
The study population consisted of 62 CAD patients with significant ST depression during exercise testing. CAD was defined as having significant stenosis (>50% luminal diameter narrowing), as confirmed by coronary angiography. All the patients underwent PWV and respiratory gas analyses. Both examinations were performed within one month before or after coronary angiography. Written informed consent was obtained from all the patients prior to their participation in this study.
Exercise Testing
Symptom-limited exercise testing with respiratory gas analysis was performed on an upright bicycle ergometer in a ramp fashion. After a 2-min rest, exercise was begun with a 1 min warm up at 0 W at 60 rpm, followed by 15 W incremental loading every 1 min. ECGs and heart rate (HR) were monitored throughout the testing, while recording hardcopies of 12-lead ECG every 1 min. HR and blood pressure (BP) measured using a conventional cuff sphygmomanometer were recorded at rest, at 1 min intervals during exercise and the recovery period for 4 min. Expired gas was measured on a breath-by-breath basis at rest, during the exercise, and the recovery period (at least up to 4 min) using a respiromonitor (AE300S, Minato Medical Electronics, Osaka, Japan). The system was carefully calibrated before each study. The gas exchange variables analyzed were oxygen uptake (VO2), carbon dioxide production (VCO2), minute ventilation (VE), and VE/VCO2 slope. The VE/VCO2 slope was determined from the regression coefficient of the relationship between VE and VCO2 during exercise. We identified a significant ST depression induced by exercise according to the following criteria: (1) a horizontal or downsloping ST-segment displacement at J-point >0.1 mV and (2) up sloping ST-segment displacement 80 ms after the J-point >0.15 mV in at least three consecutive beats at peak exercise. The time to ST depression was used as an index of inducible myocardial ischemia threshold.
Hemodynamic Assessment
BP and PWV were measured in CAD patients in the supine position after a 5 min bed rest. PWV was measured using an automatic waveform analyzer (form PWV/ABI, Nihon Colin, Japan). Pulse waveforms of the right brachium and both ankles were recorded by the oscillometric method using sensors in cuffs attached to both arms and legs. The time interval between the wave front of the right brachial waveform and that of both ankle waveforms was automatically measured. The distance between the right brachium and both ankles was calculated according to the height of each subject. Then, PWV was calculated by dividing the distance by the time interval. [Yamashina et al. 2002]
Echocardiography
Two-dimensional and M-mode resting echocardiographic recordings were obtained using commercially available instruments. LV dimensions at end diastole (LVED) and end systole (LVES) were measured at the papillary muscle level from the parasternal short-axis view, and LVED and LVES were used to calculate LVEF. The left atrium dimension was measured at the end systole on the basis of an M-mode recording at the level of the aortic root. Mitral inflow was assessed by pulsed-wave Doppler echocardiography from the apical four-chamber view. On the basis of the mitral inflow profile, E and A wave velocities, the deceleration time of E wave (DcT), and E/A ratio were measured.
Statistical Analysis
All data are presented as mean ± SD. To determine the characteristics of patients with increased PWV, the patients were divided into two groups: those with PWV < 1622 cm/sec, which was the median in this study, were categorized into the low-PWV group and those with PWV ≥ 1622 cm/sec into the high-PWV group, and differences in the variables shown in Table 3 between the groups were compared. Between the groups, differences in unpaired values were analyzed by Student's t-test and the Mann-Whitney U test when appropriate. Differences in categorical variables were analyzed by the chi-square test. Univariate and multivariate analyses were performed to assess determinants of peak VO2 using various clinical variables. For all the tests, a p value < 0.05 was considered significant.
Results
Table 1 and 2 show a comparison of clinical characteristics (Table 1) and hemodynamic, echocardiographic, and exercise testing parameters (Table 2) between the high-PWV group and the low-PWV group. There was no significant difference in age, proportion of men, or distribution of drug treatment. The high-PWV group had a higher proportion of hypertension than the low-PWV group. The number of diseased coronary vessels was greater in the high-PWV group than in the low-PWV group (Table 1).
Patient's characteristics.

Values are expressed as percentage or mean ± SD.
Hemodynamic, echocardiographic and exercise testing parameters.
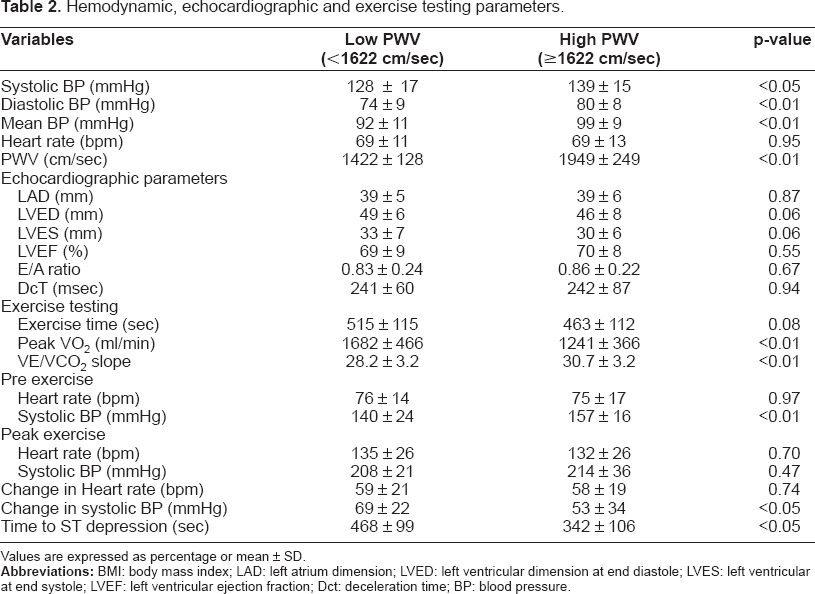
Values are expressed as percentage or mean ± SD.
Systolic, diastolic, and mean BP upon measurement of PWV were higher in the high-PWV group than in the low-PWV group (Table 2). Echocardiography results showed that there was no difference in LVEF, E/A ratio, or DcT between the two groups (Table 2). In the exercise testing, the peak VO2 was lower and the VE/VCO2 slope was higher in the high-PWV group than in the low-PWV group. These differences were still significant after adjustment for age and sex (p < 0.01 both). The change in systolic BP during exercise was smaller and the time to ST depression was significantly shorter in the high-PWV group than in the low-PWV group (Table 2).
To assess the factors determining peak VO2 in patients with CAD, univariate and multivariate analyses were performed using the variables shown in Table 3. Univariate analysis results showed that peak VO2 correlated with age, body mass index, E/A ratio, systolic BP, VE/VCO2 slope, and PWV. The number of diseased vessels was not related to peak VO2. Multivariate analysis results showed that PWV as well as sex significantly correlated with peak VO2.
Determinants of peak VO2.

Figure 1 shows the relationship between PWV and the indexes of exercise testing. Peak VO2 (r = −0.46), time to ST depression (r = −0.33), and VE/VCO2 slope (r = 0.47) were all significantly associated with PWV (all p < 0.01).

The relationship between PWV and peak VO2 (
Discussion
Arterial stiffness plays an important role in CAD patients, contributing to the high CAD severity [Weber et al. 2004] and high mortality [Chirinos et al. 2005]; however, the association between arterial stiffness and exercise intolerance, which is a common feature of patients with CAD, has not been fully clarified. In this study, we demonstrated that the high-PWV group has a lower peak VO2 than the low-PWV group, and PWV is associated with the exercise capacity of patients with CAD independent of cardiac factors, such as LVEF or the number of diseased vessels. PWV was also found to be associated with VE/VCO2 slope, which is an index of hyperventilatory response to exercise.
Peak VO2 is affected by cardiac and peripheral factors [Cohen-Solal et al. 1999]. In this study, exercise testing revealed that patients in the high-PWV group showed a small increase in SBP during exercise, which reflects the increase in cardiac output in response to exercise [Cotter et al. 2003]. Cardiac response to exercise may be reduced not only by exercise-induced myocardial ischemia but also by the arterial stiffening itself in patients with CAD. We demonstrated that the ischemic threshold, which is defined as the time to ST depression, was lower in the high-PWV group than in the low-PWV group. Theoretically, an increase in arterial stiffness causes an increase in aortic systolic BP and a decrease in aortic diastolic BP because of shifting pressure wave reflections generated at the peripheral artery from diastole to systole, which results in the increase in LV load and decrease in coronary flow, because coronary circulation is regulated by diastolic BP rather than mean BP [Kelly et al. 1992] [Watanabe et al. 1993]. Additionally, arterial stiffening itself may also contribute to the impairment of the increase in cardiac output in response to exercise. A previous report revealed that patients with increased arterial stiffness have a lower systolic reserve response to exercise irrespective of the incidence of coronary stenosis [Chen et al. 1998].
Peripheral vascular abnormality may also be responsible for the lower peak VO2 in the high-PWV group than in the low-PWV group. During exercise, flow-dependent, endothelium-mediated vasodilatation plays an important role in increasing skeletal muscle blood flow, which defines exercise capacity [Lele et al. 1996]. There is a significant relationship between peak VO2 and endothelial function [Patel et al. 2005]. Although we did not assess the endothelial function, the incidence of hypertension was higher, and the HbA1c level tended to be higher in the high-PWV group than in the low-PWV group, both of which are also associated with endothelial dysfunction [Wallace et al. 2007] [Williams et al. 1996]. In addition, endothelial dysfunction has been reported to be associated with arterial stiffening [McEniery et al. 2006]; thus, we speculate that patients in the high-PWV group had endothelial dysfunction, which was also associated with the exercise intolerance of the high-PWV group.
This study also showed that the VE/VCO2 slope was higher in the high-PWV group than in the low-PWV group, and there was a significant relationship between PWV and VE/VCO2 slope as determined by univariate analysis. An elevated VE/VCO2 slope represents a hyperventilatory response to exercise, which is a limitation of exercise capacity as well as general fatigue. Increase in pulmonary ventilation perfusion mismatch induced by increased pulmonary wedge pressure [Franciosa et al. 1984] or pulmonary vasoconstriction [Cooper et al. 1996] is involved in the hyper-ventilatory response to exercise [Wasserman et al. 1997]. A significant relationship between VE/VCO2 slope and peak VO2 has been reported [Metra et al. 1992]; however, there has been no report showing the significant relationship between arterial stiffness and hyperventilatory response to exercise. The precise mechanism underlying arterial stiffening being associated with the hyperventilatory response to exercise was not determined in this study; however, increase in LV diastolic filling pressure with LV diastolic dysfunction induced by arterial stiffening [Yambe et al. 2004] or by myocardial ischemia [Nonogi et al. 1989] is a possible mechanism of hyperventilatory response in patients with high PWV.
Recently, central and peripheral chemoreceptor sensitivities have been found to play important roles in the enhancement of ventilatory response to exercise of patients with heart failure [Chua et al. 1997] [Ponikowski et al. 2001]. Activated chemo-receptor sensitivity is also enhanced in patients with hypertension [Fukuda et al. 1987]. Some experimental studies have demonstrated that up-regulation of angiotensin-2 [Allen et al. 1998] and down-regulation of NO in chemoreceptor [Sun et al. 1999] [Li et al. 2005] are the mechanisms underlying the hypersensitivity of chemoreceptor. The renin-angiotensin-aldosterone (RAA) system also plays a crucial role in the development of arterial stiffness [Weber et al. 2004]; thus, it is possible that the activation of the RAA system is involved in the hyperventilatory response to exercise through the activation of chemoreceptor sensitivity in patients with arterial stiffening.
Limitation
It is important to note the several limitations of this study. There are several confounding factors relevant to the impairment of exercise capacity in the high-PWV group.
The high-PWV group had a greater number of diseased coronary vessels than the low-PWV group, leading to a concern that the greater CAD severity may have an adverse effect on the exercise tolerance of patients with high PWV. However, in our study, the relationship between PWV and peak VO2 is independent of CAD severity, as determined by multivariate analysis. In addition, a previous report indicated that arterial stiffening determines the ischemic threshold independent of CAD severity [Kingwell et al. 2002]. Thus, we consider that hemodynamic changes associated with arterial stiffening, such as increase in LV load, may be involved in decrease in the myocardial ischemia threshold in patients with CAD rather than CAD severity.
The incidence of hypertension was higher in the high-PWV group than in the low-PWV group. Previously, it was reported that hypertensive patients show impaired exercise capacity [Lim et al. 1996]. LV diastolic dysfunction is one of the mechanisms underlying the impairment of exercise capacity in hypertensive patients [Lim et al. 1996]. In this study, there was no difference in the measurement of mitral inflow, such as E/A ratio or DcT between the two groups. Doppler examination of mitral inflow has been widely used to evaluate the left ventricular diastolic function [Lubien et al. 2002]; however, mitral inflow is dependent on several factors including volume status [Yamamoto et al. 1997]. Therefore, we were not able to assess the LV diastolic dysfunction accurately in this study. Previously, there have been some reports describing the significant relationship between arterial stiffening and LV diastolic dysfunction [Eren et al. 2004] [Yambe et al. 2004]; thus, there is a possibility that LV diastolic function was more impaired in the high-PWV group than in low-PWV group, which could be associated with the impaired exercise capacity of the high-PWV group.
Conclusions
In conclusion, patients with high PWV had lower exercise capacity than patients with low PWV. A low myocardial ischemia threshold, as well as an enhancement of the ventilatory response to exercise, was also found in patients with high PWV. Our results further indicate that arterial stiffening associated with impairment of exercise capacity may be involved in the poor prognosis of CAD patients, and a therapeutic approach that specifically targets arterial stiffness, such as the use of inhibitor of the RAA system, may have a beneficial effect on the exercise capacity and prognosis of CAD patients. Further studies are required to confirm our results in larger populations.
Abbreviations
coronary artery disease;
left ventricular;
left ventricular ejection fraction;
pulse wave velocity;
heart rate;
blood pressure;
oxygen uptake;
carbon dioxide production;
minute ventilation;
LV dimensions at end diastole;
LV dimensions at end systole;
deceleration time of E wave.