
Abstract
Cardiac Purkinje cells (PCs) are morphologically and electrophysiologically different from ventricular myocytes and, importantly, exhibit distinct calcium (Ca2+) homeostasis. Recent studies suggest that PCs are more susceptible to action potential (AP) abnormalities than ventricular myocytes; however, the exact mechanisms are poorly understood. In this study, we utilized a detailed biophysical mathematical model of a murine PC to systematically examine the role of cytosolic Ca2+ diffusion in shaping the AP in PCs. A biphasic spatiotemporal Ca2+ diffusion process, as recorded experimentally, was implemented in the model. In this study, we investigated the role of cytosolic Ca2+ dynamics on AP and ionic current properties by varying the effective Ca2+ diffusion rate. It was observed that AP morphology, specifically the plateau, was affected due to changes in the intracellular Ca2+ dynamics. Elevated Ca2+ concentration in the sarcolemmal region activated inward sodium-Ca2+ exchanger (NCX) current, resulting in a prolongation of the AP plateau at faster diffusion rates. Artificially clamping the NCX current to control values completely reversed the alterations in the AP plateau, thus confirming the role of NCX in modifying the AP morphology. Our results demonstrate that cytosolic Ca2+ diffusion waves play a significant role in shaping APs of PCs and could provide mechanistic insights in the increased arrhythmogeneity of PCs.
Introduction
The cardiac Purkinje system forms a specialized electrical conduction system in the ventricles and is crucial for synchronized contraction of ventricles to maintain proper heart rhythm. The Purkinje system has been suggested to play a pivotal role in initiation and maintenance of life-threatening ventricular arrhythmias.1–3 Recent experimental studies in transgenic mice carrying ryanodine receptor (RyR2) mutations, typically observed in the catecholaminergic polymorphic ventricular tachycardia patients, 4 have shown that the His-Purkinje system is a major source of focal activations that initiated arrhythmia.5,6 Experimental studies firmly suggest that action potential (AP) abnormalities in the form of early and delayed afterdepolarizations (EADs and DADs, respectively) are a more common occurrence in Purkinje cells (PCs) than in ventricular myocytes (VMs). 7 However, the exact mechanisms underlying the increased propensity to AP abnormalities in PCs are not well understood.
PCs are morphologically and electrophysiologically distinct from VMs. Specifically, T-tubules are absent in most PCs,8,9 which results in a unique calcium (Ca2+) homeostasis in PCs.10,11 Ca2+ ions entering PCs via sarcolemmal (SL) channels diffuse through the cytosol to reach the sarcoplasmic reticulum (SR), before triggering Ca2+-induced -Ca2+-release (CICR). 12 PCs also express T-type Ca2+ current (ICaT), absent in VMs and activating at more negative potentials than the L-type Ca2+ current (ICaL).13,14 As such, Ca2+ dynamics in PCs differs significantly from that in VMs, which may explain their increased arrhythmogeneity. Electrical excitation induces a biphasic Ca2+ transient in Purkinje fiber strands 15 and in isolated PCs, 12 which consists of (i) Ca2+ diffusion wavelets from the subsarcolemmal (subSL) region toward the central core of the cell and (ii) a focally arising Ca2+ wave that propagates throughout the cell.12,16 Altered Ca2+ handling contributes to triggered activity, 17 and moreover, the spontaneous Ca2+ waves have been thought to play a role in initiating membrane depolarizations, but the mechanisms by which cytosolic Ca2+ diffusion alters AP morphology and potentially promotes afterdepolarizations are not well studied.
In this study, we utilized a detailed biophysical mathematical model of a murine PC to study the significant role of cytosolic Ca2+ diffusion waves in shaping the APs of PCs that might elucidate the mechanisms for initiating arrhythmia. The unique behavior of cytosolic Ca2+ diffusion in PC, as recorded in recent experiments, 16 was implemented in our model and its implications on the increased propensity of arrhythmia in PCs were investigated.
Methods
Biophysical Model of a PC
In this study, the murine PC model described in the study by Vaidyanathan et al. 18 was modified to include geometrical details of a PC, described below, and extended by adding the late Na+ current (INaL) as described in the study by Li and Rudy. 19 It has been demonstrated that INaL inactivation is a critical contributing factor in AP duration shortening in PCs during short-paced cycle lengths and alterations in INaL may contribute to EAD generation in PCs. 20
A schematic of our PC model, including all ionic current components, buffers, and fluxes, is shown in Figure 1. The cell is assumed to be cylindrical in shape with 129 μm length and 8 μm width, based on experimentally measured dimensions of 129 ± 7 μm and 8 ± 0.3 μm, respectively. 18 Figure 1B shows the intracellular compartmentalization of the model, which is assumed to be symmetric along the length. SL currents are uniformly distributed along the length, and the SR is assumed to be in the core of the cell. RyR2 receptors are also uniformly distributed throughout the cell. 16 The membrane currents are collected in a subSL region of 0.1 μm depth, immediately below the SL. The SR consists of two compartments: (1) a release compartment called the junctional SR (JSR), which is responsible for the release of Ca2+ from the SR into the cytosol (blue arrow in Fig. 1B), and (2) an uptake compartment called network SR (NSR), which is responsible for the uptake of Ca2+ from the cytosol into the SR (red arrow in Fig. 1B). Similar to SL, the fluxes to and from the SR are collected in a subsarcoplasmic reticulum (subSR) region of 0.1 μm depth, surrounding the SR. The radius of the SR is 2 μm and the total width of the cytosolic region is 2 μm, surrounding the SR.

(
Cytosolic Ca2+ Diffusion Process
A two-component cytosolic Ca2+ diffusion process, as observed experimentally,12,16 was implemented in our model as follows: (1) radial diffusion of Ca2+ entering the cell via SL Ca2+ channels (ICaL and ICaT) propagating toward the central core (SR), referred to as wavelets, and (2) cell-wide longitudinal Ca2+ diffusion wave (CWW) initiated as a result of local CICRs propagating along the length of the cell. The length of the cell was divided into 10 discrete disks, with each disk possessing L- and T-type SL Ca2+ channels and an SR compartment, and the width of the cell was divided into 81 concentric layers, as shown in Figure 2. Cellular volume discretization enabled the simulation of longitudinal and radial Ca2+ diffusion processes, with a reasonable computational cost, without the necessity of representing individual Ca2+ release sites. The number of SR disks was constrained to 10 to minimize the computational load, while maintaining an adequate spatiotemporal Ca2+ resolution.

Implementation of spatiotemporal diffusion in the PC model. The cell is divided into 10 disks, each consisting of 81 concentric layers.
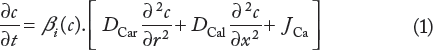
A three-dimensional diffusion equation in cylindrical coordinates was used to model the cytosolic Ca2+ diffusion process as follows.21,22

Ca2+ releases from the JSR compartment in the form of a RyR flux (JRyR) is described as

A two-state Markov model of RyR gating was used in our model, consisting of an open and a closed state, with opening and closing of rates kopen and kclose, respectively, formulated as in the study by Korhonen et al.
22
The half-saturation concentration for the RyR channel, Km,RyR, has sigmoidal dependence with [Ca2+]JSR as given in Equation (5),


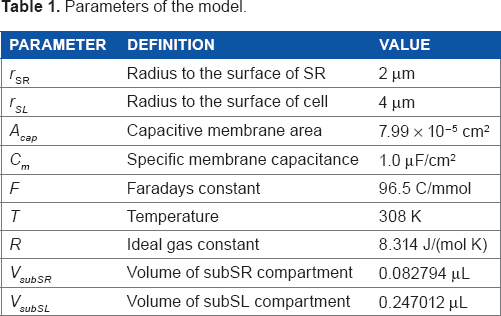
To initiate a CWW at one cell end, a [Ca2+]subSR threshold for SR Ca2+ release was defined for each SR compartment, such that the SR1 threshold ([Ca2+]subSR > 0.5 μM) is less than the threshold for other compartments SR2-SR10 (0.6 μM). In a given subSR compartment, when [Ca2+]subSR exceeded threshold, Popen was increased to 0.6 for a single time step (dt = 1 μs), triggering SR Ca2+ release and a rapid rise in the subSR Ca2+ concentration. For all other numerical integration steps, Popen was governed by Equation (6). The PC ionic model was paced at 1 Hz throughout the cell with stimulus current of amplitude −80 μA/μF with duration of 0.5 ms for five minutes to attain a steady state. Model parameters and values are provided in Table 1.
Parameters of the model.
Results
Action Potential Morphology
Figure 3 shows the AP morphology obtained in our model (Fig. 3B) compared to the experimentally recorded AP (Fig. 3A) in murine PCs. 18 Our model successfully reproduced the AP durations at 70% and 90% of repolarization (APD70 and APD90, respectively), as well as the maximum dV/dt values obtained in the experiments (summarized in Table 2). 18 The peculiar low-voltage plateau in the mouse PC AP is apparent in the figure and was observed to be sensitive to T-type Ca2+ current (ICaT), which is active at membrane potentials between −40 and −60 mV.13,14 Increasing ICaT magnitude resulted in more pronounced plateau (not shown), demonstrating that the ICaT was responsible for the characteristic AP plateau in murine PC, in agreement with the recent findings. 18
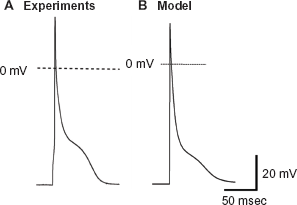
AP morphology (
Comparison of the AP parameters recorded in experiments with those obtained in the PC model.

Intracellular Ca2+ Diffusion
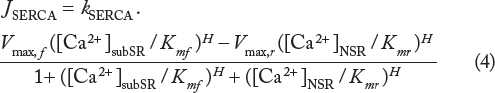
Figure 4 shows the radial and longitudinal Ca2+ transients observed in the PC model, clearly illustrating the biphasic nature of the Ca2+ transients, resulting from the two diffusion processes components. Ca2+ enters the cell through the SL channels (ICaL and ICaT) and diffuse radially toward the core of the cell where the SR is located (Fig. 4A). These radial wavelets, upon reaching the SR, trigger a CWW traveling along the length of the cell, as shown in Figure 4B. The CWWs are much higher in amplitude than the wavelets. The parameters of the average Ca2+ transient obtained in the model were adjusted to match the experimentally observed values reported in the study by Vaidyanathan et al. 18 Table 3 lists the characteristics of the average Ca2+ transients of the PC model, compared to the experimental values. The time required to attain the peak magnitude was 25 ms, and the Ca2+ transient decay time was 210 ms, both within the experimental ranges.

Cytosolic Ca2+ transients observed in the model representing (
The parameters of average calcium transients recorded in the experiments and obtained in the model.

Experimental studies have suggested that a small increase in subSL Ca2+ can initiate the wavelets, but relatively higher Ca2+ threshold is needed to trigger the CWWs. 16 Figure 5 shows that Ca2+ diffusion waves elicited during 1 Hz pacing stimulus. During Phase 2 of the AP, Ca2+ enters the cell via SL channels initiating radial wavelets (arrows in Fig. 5A). When the concentration of the Ca2+ wavelets arriving at SR1 exceeded threshold, Ca2+ was released from the junctional SR1 via CICR, leading to a larger Ca2+ wave propagating largely in longitudinal direction from SR1 toward SR2 (Fig. 5B). The Ca2+ concentration at SR2 was thus elevated from both radial wavelets and the longitudinal Ca2+ wave initiated at SR1. Ca2+ release from junctional SR2 was triggered when the subSR Ca2+ concentration exceeded threshold, slightly larger than the SR1 threshold, which in turn supplements the CWW. This process was continued in subsequent SR compartments, as shown in Figure 5C-F. The magnitude of the CWW increased monotonically as it propagated from one end of the cell to the other due to contributions from the successive local CICRs.

Propagation of Ca2+ transients in the PC model. (
Effects of Ca2+ Diffusion on AP
In order to assess the effects of Ca2+ diffusion on the AP morphology, we studied the individual effects of Ca2+ wavelets and CWWs in our model. Ca2+ wavelets were produced by the SL Ca2+ currents (ICaL and ICaT), without which (when both blocked) the Ca2+ transients were not observed. Moreover, when the CWWs were inhibited, wavelets alone were not able to produce the AP plateau (Fig. 6A). Thus, both components of Ca2+ diffusion process were necessary to establish the biphasic Ca2+ transients and reproduce the AP morphology observed in the PCs.

Ca2+ diffusion effect on AP. (
We next examined the influence of the effective diffusion coefficient, DCa, on AP morphology. By varying DCa we could alter the speed of the propagating Ca2+ transients. The baseline value of DCa in our model was chosen to be 7 μm2/ms to reproduce experimentally observed Ca2+ transients. This value was referenced from the study by Korhonen et al. 22 , where DCa was fitted to get single effective diffusion coefficient parameter based on cytosolic Ca2+ propagation velocity. This value represents an effective Ca2+ diffusion coefficient that accounts for the influence of intracellular Ca2+ binding proteins or buffers, which can greatly reduce effective diffusion relative to free Ca2+. 24 We found that increasing DCa produced a more pronounced plateau and significantly increased APD90, and while reducing DCa to 5 μm2/ms reduced the AP plateau duration (Fig. 6B). Thus, faster Ca2+ transients were counterintuitively associated with more pronounced AP plateau, prompting a further investigation in the mechanisms of AP prolongation.
The average cytosolic Ca2+ concentration for different values of DCa is shown in Figure 7A. We found that faster Ca2+ transients produced larger Ca2+ transient amplitudes. More notable average Ca2+ variations were observed in the subSL compartment, which exhibited biphasic transients (Fig. 7B). The subSL Ca2+ concentration is mainly contributed by L-type Ca2+ channels, such that slower diffusion results in slower wavelet propagation, and thus large Ca2+ accumulation and a larger initial peak in the subSL Ca2+ concentration. Faster diffusion resulted in faster CICRs from each SR, ie, a smaller temporal delay between CICR events at each SR, which subsequently led to larger subSL Ca2+ accumulation and higher magnitude transients, observed in the second peak in the subSL Ca2+ concentration. These variations in cytosolic Ca2+ resulted in alterations in the membrane potential and various SL current magnitudes. Among the SL currents, INCX, ICaT, and IK1 were significantly affected (Fig. 8).

(
We next investigated if the changes in the SL ionic currents were indeed due to variations in the subSL Ca2+ for different values of DCa. The subSL Ca2+ concentration was artificially maintained at normal levels (control case) while varying the DCa values as before. We found that the alterations in the current magnitudes as observed previously for varying DCa (Fig. 8) disappeared completely. More importantly, the variations in AP plateau were also reversed, suggesting that the variations in subSL Ca2+ concentration due to faster diffusion were responsible for the pronounced AP plateau.
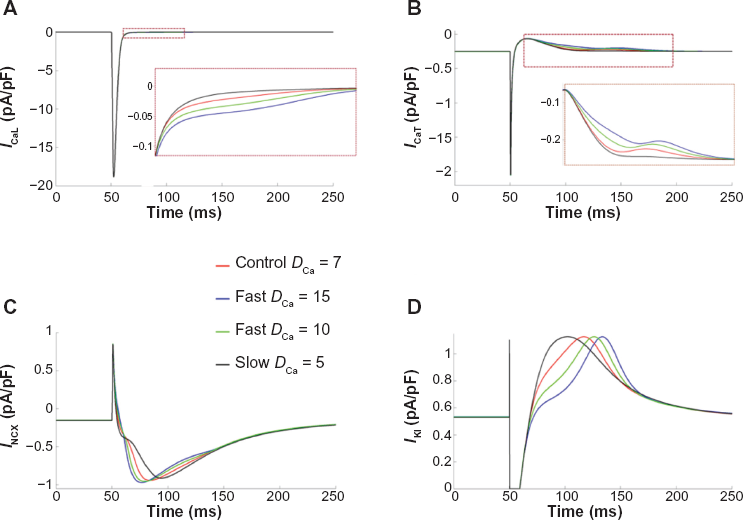
Ionic currents with notable variations for different DCa: (
Individual Contributions of ICaT, ICaL, and INCX in Prolongation of AP Plateau
We further analyzed the individual contributions of ICaT, ICaL, and INCX in prolongation of the AP plateau at higher values of DCa. In each case, the ionic current under consideration was artificially clamped to its normal time-dependent values as in control case (DCa = 7 μm2/ms), while varying DCa (Fig. 9). It was observed that when ICaT and ICaL were individually clamped to the control values, the prolongation of the AP plateau at higher DCa persisted (Fig. 9A and B), indicating insignificant contribution of these two currents in the AP prolongation. In contrast, when NCX was clamped to its control magnitude, the alterations in the AP plateau were almost reversed completely (Fig. 9C), confirming that the alterations in NCX were responsible for the prolongation of AP plateau at faster Ca2+ diffusion.

APs when (
Discussion
In this study, we employed a detailed mouse PC model to gain understanding of Ca2+ propagation inside the cell and the consequences of fast and slow cytosolic Ca2+ transients. The spatiotemporal implementation of realistic cytosolic Ca2+ diffusion waves in our PC model, the first of its kind to our knowledge, provided us a unique capability to investigate the individual and combined contributions of various ionic components of a PC AP. Our main findings were: (1) during an AP, Ca2+ diffusion produced biphasic cytosolic Ca2+ transients, namely, radial wavelets and longitudinal CWWs, (2) AP plateau was specifically affected by the changes in subSL Ca2+ levels, (3) faster Ca2+ transients produced dramatic changes in subSL Ca2+, which resulted in significant prolongation of the AP plateau, and (4) the prolongation of the AP plateau during faster diffusion was mediated through the inward NCx current. The low-voltage plateau phase observed in murine PCs is similarly observed in many species, including canine, 25 rabbit, 26 and human, 27 suggesting that the influence of subcellular Ca2+ dynamics on the plateau phase, and repolarization more generally, may be significant in other species as well.
Extensive experimental studies have demonstrated the presence of the distinct types of Ca2+ waves in PCs.11,12 Stuyvers et al. 16 reported two types of Ca2+ transients in canine PCs: (1) Ca2+ transients originating directly under the sarcolemma, mostly due to influx through Ca2+ channels, initiating small Ca2+ wavelets in a region between a depth of ~6 μm under the sarcolemma and the SR, and (2) when the amplitude of these wavelets is greater than a threshold, they trigger cell-wide large Ca2+ waves that travel across the cell length and have much lower velocity. These Ca2+ waves travel at a constant velocity and with constant amplitude throughout the cell, which suggests a mechanism of Ca2+ diffusion boosted by local CICRs.11,16 Our implementation of Ca2+ diffusion through subcellular compartmentalization satisfies these experimental observations. Because the magnitude of wavelets is lower than CWW, the possibility of wavelets alone triggering CWW is small. 12 Our mouse PC model satisfies this condition by incorporating distinct threshold values for the SR at one cell end and the remaining SR compartments. Since the SR threshold at one cell end is slightly lower, CICR is triggered by the wavelets, and the cumulative accumulation of Ca2+ from wavelets and the Ca2+ released are sufficient to subsequently trigger CICR in adjacent SR compartments. Thus, CICRs in successive compartments are triggered as the CWW propagates through the cell. The wavelets, on the other hand, propagate via diffusion between the cell periphery and the core of the cell. Spontaneous Ca2+ release from the SR can propagate in the reverse direction toward the membrane and may increase the local Ca2+ concentration in the subSL region, thereby causing membrane depolarizations through transient inward currents.28,29
Our results show that faster Ca2+ diffusion resulted in prolongation of AP plateau. When Ca2+ concentration in subSL region was elevated, it activated NCX to extrude Ca2+ ions, thus causing a net inward current. This inward INCX resulted in prolongation of the plateau. We confirmed the contribution of NCX by artificially clamping the current magnitude to its> control case and observing its effect on AP plateau for various Ca2+ diffusion velocities. Recent experiments in isoproterenol-stimulated murine VMs with RyR2 mutations showed that random bursts of prolonged Ca2+ release activated NCX, which triggered low-plateau voltage EADs, with plateau voltages comparable to murine PCs. 30 Furthermore, experiments conducted using selective NCX inhibitors ORM-10103 and SEA0400 have reported successful suppression of EADs and DADs, in canine VMs and PCs.31,32 Our results are in agreement with these experimental studies and provide further insights in the role of NCX in EAD- or DAD-induced arrhythmias originated in PCs.
Limitations
Our model assumes that the SR is situated symmetrically at the center of the cell and is uniformly divided into 10 subcompartments. The exact location and distribution of the SR in PCs is largely unknown and warrants further experimental evidence to faithfully implement it. Further, our model does not differentiate between the Ca2+ release mechanisms of IP3 receptors and ryanodine (RyR2 and RyR3) receptors as suggested in the study by Stuyvers et al. 16 Instead, a basic two-dimensional spatiotemporal diffusion was implemented in our model to study the effects of collective cytosolic Ca2+ diffusion. Finally, our model does not account for the influence of stochasticity in RyR gating and fluctuations driven by stochastic Ca2+ release.33–37 As highlighted in the studies by Stuyvers et al. 16 and Boyden et al. 12 , the biphasic nature of Ca2+ transients involves both spatial aspects of Ca2+ diffusion and spontaneous SR Ca2+ release. In order to avoid the complexity and variability of a stochastic model, we artificially triggered SR Ca2+ release from one cell end, such that we could focus on the regulatory role of Ca2+ diffusion in Ca2+ dynamics and subsequent influence on electrophysiology. Future work will investigate these issues by incorporating a stochastic RyR gating model for SR Ca2+ release. Notwithstanding these limitations, the model was able to reproduce the experimental observations and provided significant insights in the role of Ca2+ diffusion in shaping the AP of PCs.
Conclusions
The study used a morphologically detailed numerical model of murine PC integrated with a spatiotemporal cytosolic Ca2+ diffusion process to study a possible mechanism of AP abnormalities, which could lead to arrhythmia. The PC model successfully reproduced the distinct Ca2+ dynamics and the AP morphology reported in experiments. It was observed that cytosolic Ca2+ diffusion waves in PCs characterized their peculiar AP morphology. The faster Ca2+ diffusion produced biphasic transients in the subSL region, which led to the prolongation of the AP plateau. Detailed analysis revealed that the AP prolongation at faster diffusion was mediated via inward NCX current. Our simulation results provide valuable insights in the mechanisms of increased propensity to AP abnormalities in cardiac PCs when compared to VMs.
Author Contributions
Performed the modeling and simulations, and wrote the first draft of the manuscript: BL. Developed the initial model formulations and design: KS. Reviewed the work and made critical revisions to the manuscript: SHW. Conceived the design of the study, made critical revisions to the manuscript, and approved the final version: MD. All the authors reviewed and approved the final manuscript.