
Abstract
Ejection fraction (EF) has been viewed as an important index in assessing the contractile state of the left ventricle (LV). However, it is frequently inadequate for the diagnosis and management of heart failure (HF), as a significant subset of HF patients have been found to have reduced EF (HFrEF) whereas others have preserved EF (HFpEF). It should be noted that the function of the LV is dependent on both preload and afterload, as well as its intrinsic contractile state. Furthermore, stroke volume (SV) is dependent on the properties of the arterial system (AS). Thus, the LV-arterial system interaction plays an important role in those patients with HF. This aspect is investigated through the analysis of the specific parameters involved in the coupling of the LV and AS. This includes contractility and the systolic/diastolic indices of the LV. Furthermore, AS afterload parameters such as vascular stiffness and arterial compliance, and their derived coupling coefficient, are also investigated. We conclude that those parameters, which relate to LV structural changes, are most appropriate in quantifying the LV–AS interaction.
Keywords
Introduction
Beat-to-beat function of the normal heart is characterized by its dynamic adjustment to preload, afterload, contractility, and heart rate. The synchronization process is orchestrated to generate the ejected stroke volume (SV) that is necessary to perfuse vital organs and their vascular beds. In all, this amazing feat must be completed within each cardiac cycle. This occurs, in about one second in humans, whereas it is much shorter in duration for smaller mammals. 1 Thus, with varying physiological and external demands, SV adjustments need to be accomplished on a beat-to-beat basis.2,3
The left ventricle (LV) is naturally coupled to the systemic arterial system (AS), and as such, the LV ejection must be dependent on the properties of the aorta and its distributing arteries. The interaction of the heart and the AS is thus of utmost importance in governing proper function of the cardiovascular system. 4 The Frank–Starling mechanism demonstrates that force generation, associated with a better-filled heart with a larger end-diastolic volume (EDV), results in a larger SV. Thus, ejection fraction (EF), which is the ratio of SV to EDV, represents the LV input-output relationship and subsequently places EF as a critical factor in governing overall cardiac function:

This “Starling's law of the heart”, as it is known, although useful in viewing the heart from a systems perspective, largely ignores the intrinsic contractile properties of the underlying cardiac muscle. Cardiac muscle contraction, occurring after arrival of the excitation action potential, has its contributing role in overall force generation. Hence, LV pressure develops prior to the opening of the aortic valve. The associated changes in LV size and shape, throughout the cardiac cycle, are clearly visible through imaging modalities within clinical settings.
The ejected volume by the LV, or SV, seemingly a good index of cardiac contractility, is dependent on the vascular load. As a consequence, the LV and AS are effectively coupled; this is particularly true when the aortic valve is open. Pressure and flow generated by the LV must then propagate subject to the ensuing compliance of the large vessels and variable stiffness of the small arteries, in addition to nonuniform geometry and taper they encounter, en route to organ vascular beds.4,5 In heart failure (HF), the weakened contractile apparatus is still faced with a varying afterload, such as decreased large vessel compliance and increased vascular stiffness. It can either compensate by increasing chamber size via the Frank–Starling mechanism in the short term or by developing cardiac hypertrophy capable to accommodate the SV demand in the long term. Some HF patients, although suffering from compromised cardiac function, have frequently been observed to have their EF somewhat preserved (HFpEF). Others, however, are seen to have persistent reduced EF (HFrEF). Since LV ejection is dependent on how it is coupled to the AS, we will analyze the parameters governing the LV and AS and how they manifest in the beat-to-beat interaction in HF.
Hemodynamic Parameters Governing Left Ventricular Function in HF
Starling's law is best known for describing the impact of preload on overall LV function. 6 That is, in HF, the preload described by EDV or end-diastolic pressure (EDP) is significantly increased. 7 This compensating mechanism is necessary to augment the reduced SV. The resulting dilation of the LV, particularly during systole when left ventricular pressure (LVP) becomes higher, is often detected in clinical imaging 8 with angiography, MRI, or ultrasound.
Starling's law, LV function curve, and alternative Starling's curve
A variation to represent the central dogma of the Starling's law of the heart is the LV function curve. 9 It deals with preload dependence of the right (or left) atrial filling pressure (RAP) as an important governing parameter. LV end-diastolic pressure (LVEDP) has since been widely used to substitute for RAP given the ease of simply recording LV pressure during catheterization; together with cardiac output (CO) or SV from thermodilution. The LV function curve is useful in separating a weak heart from a normal or inotropic drug-enhanced heart. From the active and passive cardiac muscle contraction point, LVEDP is normally below 12 mmHg, although some have used 16 mmHg as a border to separate normal subjects from HF patients. With greater elevated LVEDP in severe HF and with increased passive lengthening, this may approach the descending limb observed in the active/passive force–length relation from sarcomere studies. 10 The latter, therefore, provides a compass for diagnosis in the clinical setting; as HF patients have considerably higher LVEDP. 11 This is also visible from experimental studies at the onset and after a subsequent prolonged period of myocardial ischemia (Fig. 1).

Simultaneously measured hemodynamic parameters of the LV and the As during occlusion of the LAD coronary artery, and subsequent induced myocardial ischemia (left panel). Reperfusion is also shown (right panel). Cardiac muscle segment length (second tracing) is the most sensitive parameter at the onset of myocardial ischemia. diastolic parameters of LVEDP (fourth tracing from bottom) and negative LV dP/dt (third tracing from bottom) are also very sensitive. Thus, HF has its contributions from both systolic and diastolic dysfunction.
EF that has been hailed as a simple index of ventricular function and stems from the Starling's law of the heart. Experimental studies with volume loading have shown that utilization of Starling's law is effective in improving LV function in the short term.11,12 Some investigators have shown that the alternative Starling's law, based on the relation of SV to end-systolic volume (ESV),13,14 is a better indicator of LV function in HF. This may be more effective in identifying the differences between HFpEF and HFrEF patient groups.
Cardiac muscle shortening is dependent on its active and passive properties. Coronary artery disease (CAD) is the most commonly associated HF condition. Experimental observations based on cardiac muscle segment length measurements have shown rapid changes with occlusion of a coronary artery.15–17 Figure 2 illustrates this. With the onset of ligation of the left anterior descending (LAD) coronary artery, active shortening in the ischemic region is replaced by passive lengthening. These changes are visible within seconds and can be easily seen from pressure–segment loops. 15 This underlying change occurs within the following beat and progressively worsens, indicating that a dynamic interaction has taken place. Longer coronary artery occlusion, ie, greater than two hours, more likely produces irreversible damage to cardiac muscle function.15,18 Even with a brief period of coronary artery occlusion and subsequent release, as observed in myocardial stunning,19–22 permanent damage can occur.
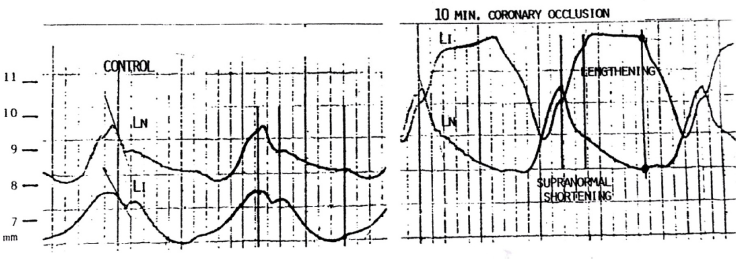
Cardiac muscle segmental lengths (in mm) measured with ultrasound transducers implanted in the normal (LN) and ischemic (LI) zones of the myocardium during control (left panel) and ten minutes after coronary artery occlusion (right panel). Active systolic shortening is substituted by passive lengthening in the ischemic zone during occlusion (right). Lengthening in the ischemic zone and supranormal shortening in the normal zone are labeled.
Indices of myocardial contractility
At the global level, pressure, volume, and geometry are the most commonly measured parameters. For the ease of assessing ventricular function during catheterization, the electrocardiogram (ECG), cineangiogram, LVP, and thermodilution CO are normally measured. Thus, together with LVEDP, the maximum rate of rise of left ventricular pressure (LVdP/dtmax) is recorded. The latter has been routinely referred to as an index of LV contractility in the clinical setting, although it has been found to be dependent on AS load, signifying the close coupling of the LV to the AS. To justify its use, it has been linked to the impulse response of the LV in terms of its outflow. Thus, this initial impulse 23 of the ejection flow has also been used as an index of contractility. Since LVP is normally measured, LVdP/dtmax has been correlated with the maximal aortic flow (Q) acceleration or dQ/dtmax 24 (Fig. 3). More recent work utilizes the minimally invasive esophageal ultrasound Doppler monitor for flow and acceleration measurements. 25

Simultaneously measured aortic pressure and aortic flow and their first derivatives. The peak rate of pressure change (dP/dtmax) has been correlated with the peak rate of flow change or peak flow acceleration (dQ/dtmax).
Alternatively, cardiac muscle shortening velocity has been used to describe contractility from the force–velocity–length relations. 10 This stems from Hill's original analysis of muscle contraction. For all practical purposes, circumferential velocity of shortening, assuming an elliptical geometry of the heart, has been used. Since LVP is normally measured, an index of contractility in terms of LVP is the maximum velocity of shortening of the contractile element (vce), or

where α is the spring constant, approximately 32 cm−1. 26 In this formulation, cardiac muscle is modeled as a spring–dashpot combination.
Alternatively, from the pressure–volume (P-V) relation 5 (Fig. 4), the end-systolic pressure–volume relation (ESPVR) provides the maximum elastance of the LV, or Emax:

where ESP and ESV are end-systolic pressure and volume, respectively, and Vo is the residual volume. Since Vo can only be determined when LVP = 0, which imposes an impractical measurement in clinical situations, it is assumed to be 0 in many instances. Vo has been shown to vary greatly in HF as an increase in contractility is related to a reduced Vo. 27 Like LVdP/dtmax, Emax has been used extensively to reflect the state of the heart, and has been shown to be arterial load dependent, ie, ESPVR becomes curvilinear at higher arterial pressures, 5 thus making it afterload dependent. This has its consequential effect on the interaction of the LV and the AS. Emax is derived from the time-varying compliance concept, 28 in which the heart is characterized as a muscular pump. Thus, the pressure-volume relationship dictates the extent of systolic ejection. Indeed, the ejection process is dependent not only on the contractility of the heart but also on the AS load it faces.
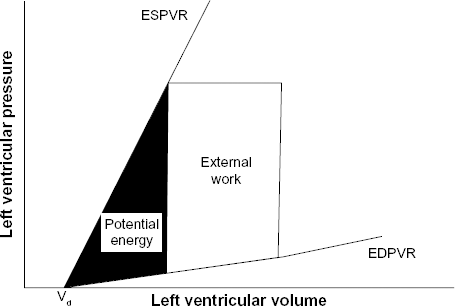
Pressure–volume relation of the LV defined by the ESPVR and the end-diastolic pressure–volume relation (EDPVR). A decline in the ESPVR slope implies a decreased Emax, maximum elastance of the ventricle. An increased EDPVR indicates an increased diastolic stiffness.
Diastole indices for assessing HF
Diastolic relaxation has been shown to be important. Delayed and reduced shortening is characteristic of HF. 29 This in turn gives rise to an incomplete relaxation; before the next cardiac cycle. The diastolic relaxation time constant has been found to be lengthened,21,30 and increased diastolic stiffness, or decreased diastolic compliance, further hinders LV ejection in the following cardiac cycle. Indeed, diastolic compliance has been found to be reduced in HF. 31 The temporal relation of negative dP/dt is particularly acute in showing the changes during the onset of ischemia as seen in Figure 1. This signals the importance of the diastolic relaxation phase, in which delayed shortening, associated with myocardial ischemia, may impact overall diastolic behavior.
Hemodynamic Parameters Governing the AS in Normal and HF Conditions
The heart, whether in normal or HF conditions, is coupled to the AS. The AS thus presents both steady flow and pulsatile load to the heart, even under normal conditions. In HF, such loading conditions can be variably large. To quantify such load in terms of pulsatile arterial pressure–flow relations, the Windkessel model4–6 is most commonly employed. This lumped model of the AS is represented by the combination of the characteristic impedance of the proximal aorta (Zo), the total arterial compliance (C), and the peripheral vascular resistance (Rs).4,5 Aortic compliance is of primary importance during systole, and thus, its alteration in HF can significantly modify LV ejection. Compliance is a physical property directly dependent on the elastic behavior of the aorta. Its inverse, or vascular stiffness, is linked to the mechanical properties of the arterial wall structure. Thus, reduced compliance or increased vascular stiffness has been observed in HF patients with hypertension, LV hypertrophy, aortic stenosis, and coronary arterial disease. 32 Compliance can be estimated using the aortic diastolic pressure decay time constant that occurs from end-systolic pressure, (Pes) to diastolic pressure (Pd):

where τ (Rs X C) is the time constant and td is the diastolic period. This assumes a mono-exponential decay of aortic pressure beginning at the closure of the aortic valve. The time constant describes the manner of the diastolic pressure decay. Thus, a shorter time constant reflects faster pressure decay. An increased stiffness in large arteries (hence lower compliance) shortens the time constant and vice versa. Since systemic vascular resistance (Rs) can be calculated from mean pressure and mean flow (from thermodilution), total arterial compliance (C) is readily obtained. Note that compliance is defined as the change in volume due to a change in distending pressure:

Thus, to estimate arterial compliance from SV and aortic pulse pressure: 33

This has the tendency to overestimate C, as Cv also contains contributions from the LV during ejection. 4 They are, however, closely correlated. 4
Alternatively, pulse wave velocity (PWV) has been a popular index of vascular stiffness, as is augmentation index (AIx). The latter parameter has been used as an index of, but is not equivalent to, the amount of reflected waves. 5
Interaction of the Coupled LV–AS in HF
The central theme governing the closely coupled LV and AS is that one entity must be dependent on the other in normal and HF conditions. To investigate the individual parameter variations, modeling serves as a powerful tool for interpretation of clinical observations and predicting treatment efficacy and outcome. For instance, increased peripheral resistance and decreased arterial compliance are associated with hypertension.4,5 Decreased arterial compliance is reflective of an increased vascular stiffness. In addition, significantly reduced arterial compliance has been found in patients with coronary arterial disease and HF. 34
To assess the coupling and the interaction of the heart and the AS, several methods have been proposed. Studies of heart–AS interaction have shown time-varying elastance properties for both the LV and the AS.35,36 In order to simplify analysis, models with lumped parameters are utilized. Time-domain analysis affords ease of implementation and clinical tractability over frequency domain analysis. One such method is the description of the AS by an effective arterial elastance (Ea). 37 Ea has been used to characterize the AS properties as a whole and thus describes a system property. It is not equal to the elastic properties of arteries. It is based on the three-element Windkessel model, Figure 5, with the assumption that the AS behaves linearly or that beat-to-beat variation is small. At steady state, one obtains

LV–AS coupling. The LV is represented by a time-varying compliance (Cv(t)) and the AS is represented by the characteristic impedance of the proximal aorta (Zo), the total arterial compliance (C), and the peripheral vascular resistance (Rs). Flow (Q) directions are also indicated.
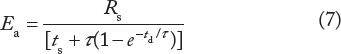
where ts is the systolic period and td is the diastolic period, as given before. With the help of Taylor's series expansion for the exponential,4,5 Ea can be approximated as

Since Rs is the ratio of mean aortic pressure to mean aortic flow (Rs = Pm/Qm) and SV is the mean flow over the cardiac period (SV = Qm X T), we have:

Approximation of Pm to Pes is acceptable under normal physiological conditions, but poor during strong vasoactive conditions.
Since CO is defined as the product of SV and heart rate (HR, beats/minute)

and

while T is the cardiac period in seconds (ie, T = ts + td), the effective Ea can be rewritten, as in (8),

Thus it is solely dependent on peripheral resistance.
LV–AS coupling has often been described in terms of the maximal elastance (Emax) of the LV and effective Ea of the AS. The ratio Emax/Ea describes how the LV and afterload interact. Coupling between the LV and the AS is thus given by the coupling index (k):

which is the ratio of both LV and AS elastances. This approach is founded on the belief that Emax can be used as an index of cardiac contractility (ie, a measure of inotropic state) and that Ea can sufficiently account for the hemodynamic properties of the AS. Based on the above analysis, mismatch regarding the hemodynamic coupling between the LV and the AS has been reported. 38
About half of all the patients with HF are diagnosed as having an almost normal EF (EF ≥50%) while with EDV <97 mL/m2. This subgroup is denoted as the syndrome of HFpEF. The other half of HF patients exhibit a reduced EF (<50%) in accordance with the classical notion that HF is reflected by a significantly decreased value of EF. Thus, a normal EF may be associated with a poor cardiac condition. Implicit in this is that EF alone cannot be a unique index for describing the performance of the heart. To resolve this dilemma, it is necessary to look into the significant differences of the AS behavior, or the vascular loading properties, for these two patient groups.
To this end, recent studies have shown that systolic pressures, for both the LV and the aorta, are significantly higher for the HFpEF as compared to the HFrEF group. This observation is in line with previous findings that HFpEFs are more likely to have hypertension.39,40 In contrast, diastolic pressures for both the LV and aorta are not significantly different. These onesided differences contribute to the finding that Emax tends to be higher in HFpEF and therefore can be regarded as a cofactor leading to the uncoupling of EF and k. 14 A larger pulse pressure (PP) is found in the HFpEF group, which is the consequence of a lower arterial compliance; as C is inversely proportional to PP.4,5
It has been shown that Ea alone is not useful in assessing the severity of HF patients with either preserved or reduced EF and certainly cannot differentiate the two groups. 41 The surprising evaluation outcome is that arterial compliance is significantly different and appears to be a clear differentiable factor between the HFpEF and HFrEF groups. But EF does not seem to be dependent on arterial compliance for either of the two groups. It is obvious that HFpEFs display an EF that is practically independent of changes in arterial compliance. In the HFrEFs, EF tends to rise with an increase in arterial compliance. Thus, in this HFrEF group of patients, therapeutic drugs that improve arterial compliance can significantly improve overall LV–AS coupling, and hence, overall cardiac performance.
While we have primarily focused on hemodynamic events associated with the LV–AS interaction in HF, we recognize that neurohumoral mechanisms can significantly impact the vascular system and the heart. For instance, increased activity of the renin–angiotensin–aldosterone system in HF and underlying maladaptive mechanisms can play a dominant role in adverse vascular remodeling. 42 In addition, overstimulation by the sympathetic system has been a major concern in HF patients. This has led to selective beta-adrenergic receptor blockade in treating HF patients. 43 While beta-blockers have long been shown to be effective in treating hypertensive patients, the use of the newer class of angiotensin-converting enzyme inhibitors has also been shown to be effective. Thus, the interplay of neurohumoral mechanisms and hemodynamics may eventually determine an optimal strategy for successful treatment of HF patients.
Conclusions
Recent clinical studies have shown that there is a subset of HF patients with normal EF. This seemingly suggests that their AS properties may also be preserved. Clearly, these patients’ hemodynamic function differs from those with HFrEF.
When differentiating HFpEF from HFrEF patients, the combined use of peripheral vascular resistance and arterial compliance may be superior to using effective Ea alone. The subgroup of HF patients, with the newly defined syndrome manifesting as preserved EF, seem to have an LV which is decoupled from their AS. Thus, their EFs are relatively independent to changes in peripheral resistance or compliance.
Author Contributions
Conceived and designed the experiments: JKL. Analyzed the data: JKL. Wrote the first draft of the manuscript: JKL. Contributed to the writing of the manuscript: JKL, GA. Agree with manuscript results and conclusions: JKL, GA. Jointly developed the structure and arguments for the paper: JKL, GA. Made critical revisions and approved final version: JKL, GA. Both authors reviewed and approved of the final manuscript.
Footnotes
Acknowledgment
This work is supported in part by a grant from Rutgers Cardiovascular Engineering Group and Rutgers New Jersey Medical School.