
Abstract
We have previously shown the hepatic gene expression profiles of carcinogens in 28-day toxicity tests were clustered into three major groups (Group-1 to 3). Here, we developed a new prediction method for Group-1 carcinogens which consist mainly of genotoxic rat hepatocarcinogens. The prediction formula was generated by a support vector machine using 5 selected genes as the predictive genes and predictive score was introduced to judge carcinogenicity. It correctly predicted the carcinogenicity of all 17 Group-1 chemicals and 22 of 24 non-carcinogens regardless of genotoxicity. In the dose-response study, the prediction score was altered from negative to positive as the dose increased, indicating that the characteristic gene expression profile emerged over a range of carcinogen-specific doses. We conclude that the prediction formula can quantitatively predict the carcinogenicity of Group-1 carcinogens. The same method may be applied to other groups of carcinogens to build a total system for prediction of carcinogenicity.
Introduction
Carcinogenicity is one of the most important endpoints of chemical safety evaluations, not only for pharmaceutical compounds but also for industrial chemicals. The two-year rodent carcinogenicity studies are generally used to judge the carcinogenicity of chemicals, but they are very expensive and need long test periods. Hence the carcinogenic potential of many chemicals remains unknown.
A number of alternative methods have been developed to screen carcinogens more easily. McCann et al reported in 1975 that carcinogenicity could be predicted from strength and a pattern of mutation of Salmonella. 1 Then, Zeiger et al identified rodent carcinogens and non-carcinogens by multiple genetic tests, including a mutagenicity test, and concluded that the Salmonella mutagenicity test is effective for the identification of mutagens and potential carcinogens, but not chemicals classed as non-mutagenic in the Salmonella mutagenicity test. 2 Elcombe et al studied acute and subacute biochemical and tissue changes as biomarkers to predict non-genotoxic carcinogenicity in rodents. 3 However, a further verification study was required because only nine chemicals were tested. Ito et al developed the 8 week medium-term liver bioassay system by quantifying glutathione S-transferase placental-form (GST-P) positive foci as markers in F344 rat livers, which was employed in the International Conference on Harmonization 4 ; 59 out of 64 (92%) hepatocarcinogens gave positive results, irrespective of their mutagenicity. 5 The cancerogenic peroxisomal proliferators that suppress GST-P expression showed false negative in this method.
Microarray technologies enable the comprehensive analysis of gene expression, and their development has led to the emergence of the promising new scientific field of toxicogenomics. Toxicogenomics has been applied to the elucidation of toxicity mechanisms, exploration of biomarkers, and prediction of toxicity.6,7 Mathijs et al reported discrimination of genotoxic carcinogens from non-genotoxic carcinogens by using GeneChip array data derived from primary mouse hepatocytes; the two classes of carcinogens were separated from each other by hierarchical clustering, and the genes responsive to genotoxic carcinogens were extracted. 8 However, the prediction of carcinogenicity using the “characteristic” genes was not reported. Ziegelbauer et al classified 29 chemicals into genotoxic carcinogens, non-genotoxic carcinogens and non-hepatocarcinogens by using GeneChip data obtained from short-term animal experiments, and they tried to build a formula to predict the type of carcinogen by support vector machine method, resulting in a concordance of 88% for the validation data. 9
In a previous study, 10 we performed a hierarchical cluster analysis of the gene expression data obtained from rat liver in a 28-day repeated-dose toxicity study of 73 chemicals, comprising 47 carcinogens and 26 non-carcinogens, which were selected on the basis of their chemical and toxicological diversity. These carcinogens were separated into three major groups without relying on the selected gene and the administration period in the cluster analysis. We identified three “characteristic” gene sets, each of which showed gene expression changes specific for one of the three groups of carcinogens, suggesting that prediction formulae should be built by using “characteristic” gene sets from each group.
Here, as the first step towards development of a prediction method for carcinogenicity, a small “characteristic” gene set for Group-1 carcinogens was selected, and a prediction formula was built by using the support vector machine method. The performance of the prediction formula was examined by using validation chemicals in addition to the carcinogens in the other two groups demonstrated in the previous study. The effective dose range of the prediction formula was identified by a dose-response study.
Materials and Methods
Test chemicals
Eighty-six chemicals with known carcinogenicity were selected on the basis of their chemical and toxicological diversity from the US National Toxicology Program (NTP) database (http://ntp.mehs.nih.gov/) and the Chemical Carcinogenesis Research Information System (CCRIS) database (http://toxnet.nlm.nih.gov/cgi-bin/sis/htmlgen?CCRIS). They include 17 Group-1 carcinogens (Table 3a), 23 Group-2 carcinogens (Table 3b), and 6 Group-3 carcinogens (Table 3c), as well as 24 non-carcinogens and 16 validation chemicals consisting of 11 carcinogens and 5 non-carcinogens, and these were based on our previous study. 10 The Group-1 carcinogens consisted of hepatocarcinogens mainly, especially mutagenic hepatocarcinogens. The Group-2 carcinogens consisted of mutagenic carcinogens and non-mutagenic carcinogens. Furthermore, carcinogens with estrogenic activity were included in Group-3 mainly. Two non-carcinogens, 4′-(chloroacetyl)acetanilide and 3-chloro-p-toluidine, were used in the grouping of carcinogens included in the validation data, because they showed gene expression patterns very similar to those of Group-1 carcinogens in the previous study. 10
Summary of the toxicity tests with 86 test chemicals, their carcinogenic properties, and carcinogen groups clustered in this study.

Group-1 carcinogen used for training set; C, other group carcinogen; N, non-carcinogen; V, validation set including carcinogen and non-carcinogen
A, Sigma-Aldrich Co. (St. Louis, MO); B, Tokyo Chemical Co., Ltd. (Tokyo, Japan); C, Wako Pure Chemical Industries, Ltd. (Osaka, Japan); D, Junsei Chemical Co., Ltd (Tokyo, Japan); E, Kishida Chemical Co., Ltd. (Osaka, Japan); F, Fluka Chemical Co. (Buchs, Switzerland); G, Kanto Chemical Co., Inc. (Tokyo, Japan); H, Nard Institute, Ltd (Hyogo, Japan); I, AccuStandard Inc. (New Haven, CT); J, Lancaster Synthesis, Inc. (Windham, NH)
mg/kg/day
5% AGS; 5.0 w/v% gum Arabic solution, CO; Corn oil, DW; Distilled water, 1%CMC; 1% carboxymethylcellulose sodium solution; 0.5%MC; 0.5% methylcellulose solution.
Histopathology: AH, Apoptosis of hepatocytes; ATH, Atrophy of hepatocytes; DHH, Diffuse hypertrophy of hepatocytes; ECH, Eosinophilic change of hepatocytes; FICI, Focal inflammatory cell infiltrates in liver; GI, glycogen increment; IMF, Increment of mitotic figure in hepatocytes; HHN, Hypertrophy of hepatocyte nuclei; NO, No histological abnormalities; PHH, Periportal hypertrophy of hepatocytes; SCN, Single cell necrosis of hepatocytes; VH, Vacuolization of hepatocytes
Carcinogenicity
Hepato-carcinogenicity: E, Equivocal; NA, Data not available; LP, Limited positive
Mutagenicity
Results based on those of a previous study (Matsumoto et al., 2009).
Number of chemicals in each subgroup.

Chemicals of each carcinogen group.
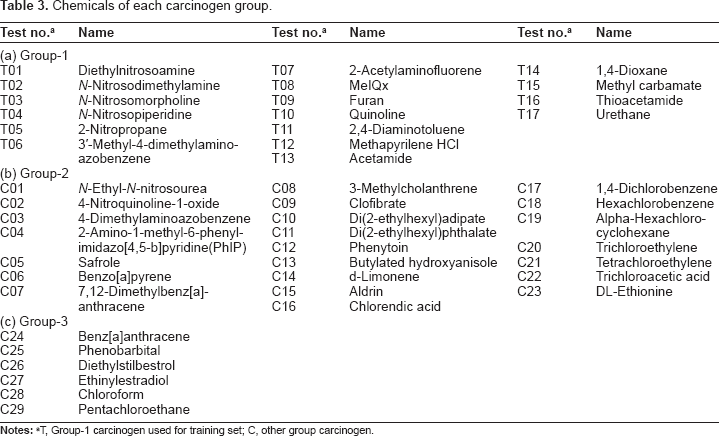
T, group-1 carcinogen used for training set; C, other group carcinogen.
A summary of toxicity test conditions, carcinogenic properties, and carcinogen group number, as determined in the previous study of the test chemicals, 10 is presented in Table 1. In this study, 17 Group-1 carcinogens and 24 non-carcinogens were used as training chemicals for prediction formula building; 23 Group-2 and 6 Group-3 carcinogens, and 16 validation chemicals, were used to validate the prediction formula (Table 2).
Animals and treatment
The 28-day repeat-dose toxicity study was performed as previously described. 10 Fischer 344 (F344) rats were randomly assigned to two groups (treatment and control) consisting of 4 rats per group, and each rat was given a test chemical dissolved in a suitable vehicle (gum Arabic, corn oil, distilled water, carboxymethylcellulose or methylcellulose) or vehicle alone, by oral gavage once a day for 28 days. The dosage of each chemical was set at approximately its minimum carcinogenic doses (for carcinogens) or its maximum tolerated doses (for non-carcinogens) on the basis of the information in NTP (http://ntp.niehs.nih.gov/), CCRIS (http://toxnet.nlm.nih.gov/cgi-bin/sis/htmlgen?CCRIS) database, and published literature.
Four carcinogens (diethylnitrosoamine [T01], N-nitrosomorpholine [T03], 1,4-dioxane [T14], and thioacetamide [T16]) and 2 non-carcinogens (lithocholic acid [N15] and alpha-tocopherol [N19]) were selected at random from 17 Group-1 carcinogens and 24 non-carcinogens for dose-response studies. Dose-response studies with four dosages were then conducted to examine the dose dependency of the expression of the genes selected as the predictive genes, and the dose dependency of the power of the prediction method. The maximum dose was set as the maximum tolerated dose, and the remaining three doses were set up with a common ratio of 5.
In this study, we obtained ethics approval for the use of animals in all our animal testing.
Microarray experiments
Gene expression in the liver was measured by using a custom microarray, NEDO-ToxArrayIII (NGK Insulators, Ltd. Nagoya, Japan), consisting of 6709 unique genes, and data processing was performed as described previously. 10 The raw data are available for download from the Gene Expression Omnibus repository (http://www.ncbi.nlm.nih.gov/geo/) at the National Center for Biotechnology Information (Accession ID, GSE16394). In a previous paper, 1359 genes were selected based on cut-off criteria, and it was used to build a prediction formula for carcinogenicity. 10
Selection of predictive genes
The Group-1 “characteristic” genes were defined as genes induced or repressed specifically by administration of Group-1 carcinogens (ie, not by administration of non-carcinogens). They were selected by two criteria, as follows: 1) an absolute t-value >5 obtained from the Welch's t-test comparing log2ratio values between the training sets of Group-1 carcinogens and non-carcinogens, where the log2ratio is the logarithm to the base 2 of the mean signal intensity ratio between the treated sample and the corresponding vehicle control; and 2) an absolute value of the log2ratio >0.8 in more than 70% of the test Group-1 carcinogens and less than 30% of the test non-carcinogens. Five genes were selected by applying these criteria to the training data of 17 Group-1 carcinogens and 24 non-carcinogens (Table 2).
Prediction formula building
The prediction formula for carcinogenicity of Group-1 carcinogens was built from the gene expression data of the 5 predictive genes (Table 4) with 17 Group-1 carcinogens and 24 non-carcinogens (Table 1) as training chemicals. Support Vector Machine (SVM), which is widely employed in toxicogenomics for prognostic prediction and marker searches,11,12 was used for the prediction formula building.
Gene symbol, Gene name, Refseq ID and expression direction of the predictive genes.
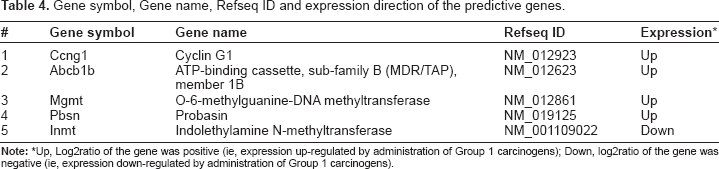
Up, Log2ratio of the gene was positive (ie, expression up-regulated by administration of Group 1 carcinogens); Down, log2ratio of the gene was negative (ie, expression down-regulated by administration of Group 1 carcinogens).
Because the formula is best suited to the training data, a number of validation datasets are required to assess its general applicability. To overcome this problem, we built the prediction formula as follows (Fig. 1); non-redundant random sampling was used to select 11 carcinogens and 11 non-carcinogens from the training dataset (17 training Group-1 carcinogens and 24 training non-carcinogens), and a working linear formula was built by using the classification mode of SVMlight (http://svmlight.joachims.org/). SVMlight generated the distance of each test sample data from the hyperplane in 5 dimensional space as a linear function of the gene expression changes (log2ratio values) of the 5 predictive genes. The linear function was used as the working formula, where the distance from hyperplane was defined as the prediction score, with positive values for carcinogens and negative values for non-carcinogens. The random sampling and calculations were performed 3000 times to generate 3000 working linear formulas. The medians of the coefficients for each gene and the median intercept value were then calculated and used as the coefficients in the final prediction formula.

Flow diagram showing the generation of the prediction formula. From 17 carcinogens and 24 non-carcinogens, 3000 non-redundant sets of 11 carcinogens and non-carcinogens each were randomly selected, and the gene expression data of the predictive genes for those chemical was used as the training data sets to generate 3000 linear prediction formulas by SVM. The median value of the coefficients of 3000 linear formulae was set as the coefficient of the final prediction formula.
Validation of the performance of the prediction formula
To validate the prediction performance, the formula was applied to the data from the Group-1 training chemicals, the Group-2 and Group-3 carcinogens in the previous study, 10 and the validation chemicals. Also, the prediction formula was applied to dose-response data to elucidate the dose response of the prediction performance.
Results
Toxicity studies
For 28 days, male F344 rats were treated daily with either minimum carcinogenic doses of carcinogens or maximum tolerated doses of non-carcinogens, and then subjected to histopathological examination. For 15 of the 23 hepatocarcinogens, histological abnormalities such as modest hypertrophy of hepatocytes and enlargement of hepatocyte nuclei were observed 28 days post-treatment. Generally, the histological abnormalities observed were those expected after treatment with genotoxic carcinogens (Table 1). These findings support the assumption that the animals would have developed hepatic tumours if administration of carcinogens had continued. 10
Predictive gene selection
Ideally, a single marker gene that undergoes expression change after administration of each carcinogen, but not any of the non-carcinogens, would be identified and used to predict the carcinogenicity of the chemicals. We considered it unlikely that such a gene would be found in this study, because factors other than carcinogenesis might affect the expression of the gene, and multiple carcinogenic mechanisms might be promoted by the various Group-1 carcinogens. Therefore in this study, we used multiple genes as predictive genes in building the prediction formula for carcinogenicity.
The difference of carcinogen group and the non-carcinogen group which may have an unequal change is assessed in Welch's t-value that is the statistics of the Welch's t-test. We employed the t-value obtained as the first criterion to identify “characteristic” Group-1 carcinogen-responsive genes. However, if the variances of the gene expression changes were very small for both administration of carcinogen and administration of non-carcinogen, a gene could meet the first criterion without the expression change being of sufficient magnitude to be biologically significant. Consequently a second criterion was introduced, whereby a substantial gene expression change was observed after administration of more than a certain proportion of the carcinogens and less than a certain proportion of the non-carcinogens.
To determine the appropriate threshold values for the two criteria above, prediction formulae were built by using various “characteristic” gene sets obtained by varying the absolute value of the t-value threshold from 2 to 5 (criterion 1) and varying the proportions of carcinogens (>50% to >80%) and non-carcinogens (<30%) inducing substantial gene expression changes (criterion 2), where a substantial gene expression change was defined as an absolute log2ratio >0.8. Using absolute t-values of >2, >3, >4 and >5 for the first criterion, 608, 250, 69, and 14 genes, respectively, were selected. These were reduced to 17, 14, 10 and 5 genes, respectively, when a second criterion of substantial gene expression change in >50% carcinogens and <30% non-carcinogens was added. These results indicate that the majority of the genes that showed substantial expression-change differences between the training carcinogens and non-carcinogens did not show substantial gene expression changes in response to a large proportion of the carcinogens, suggesting that both criteria are needed to select an efficient gene set for building the prediction formula for carcinogenicity. When the absolute t-value was set at >2 and the proportion of carcinogens was varied from >50% to >80%, the number of selected genes was from 17 to 2, and the performance of the prediction formula reached a maximum at >70% of the proportion. Similar results were obtained with other absolute t-values, although the predictive score increased slightly with increasing absolute t-value. To maximize the prediction performance, we selected 5 Group-1 “characteristic” genes with absolute t-value >5, and substantially altered expression in response to >70% carcinogens as the final predictive genes (Table 4). Of these 5 genes, 4 were up-regulated and 1 was down-regulated by exposure to Group-1 carcinogens.
Development and validation of the prediction formula
Three thousand working linear prediction formulae were built by using the 5 predictive genes selected above and 3000 working training data sets of 11 carcinogens and 11 non-carcinogens, extracted at random from the total training data (17 carcinogens and 24 non-carcinogens). Within the working formulae, the coefficients for each gene, the intercept values and the concordance rates of 3000 training data sets tended towards a normal distribution as the number of formulae increased. In 3000 prediction formulae, the variance of the gene coefficients ranged from 8.3 × 10⁻⁴ to 4.2 × 10⁻², the variance of the intercept values was 5.6 × 10⁻³, and the average concordance rate was 98.8% (standard deviation = ± 2.0%).
The final prediction formula was built by using the medians of the gene coefficients and intercept values of the 3000 working linear prediction formulae; the formula was then applied separately to the training and the validation data to assess its prediction performance (Fig. 2). The prediction scores of the 17 Group-1 carcinogens and 24 non-carcinogens used as training data were positive and negative, respectively; although in the case of two training carcinogens, quinoline (T10) and urethane (T17), the error bar (Standard deviation) extended to negative values. Thus, the concordance of the prediction outcome of the training data was 100%.

Comparison of scores of training and validating chemicals predicted by the prediction formula for group-1 carcinogens. (
All Group-2 carcinogens were predicted as negative carcinogenicity, with the exception of safrole (C05), which had a positive score. All Group-3 carcinogens were predicted as negative carcinogenicity.
Three out of 5 non-carcinogens in validation chemicals were correctly predicted as negative carcinogenicity, but remaining two were judged as positive carcinogenicity, those being 4′-(chloroacetyl) acetanilide (V15), and 3-chloro-p-toluidine (V16). Three (carbon tetrachloride [V02], methyleugenol [V09] and o-nitrotoluene [V10]) of the 11 carcinogens in carcinogens had positive scores, indicating that these chemicals are possible Group-1 carcinogens.
Dose response of the prediction score
Dose-response studies were conducted with four Group-1 carcinogens (diethylnitrosoamine [T01], N-nitrosomorpholine [T03], 1,4-dioxane [T14], and thioacetamide [T16]) and two non-carcinogens (lithocholic acid [N15] and alpha-tocopherol [N19]) selected from the Group-1 carcinogens and non-carcinogens at random. The prediction formula was applied to the resultant data, and prediction scores were estimated (Fig. 3). The prediction score for the highest dose of diethylnitrosoamine (T01; 20 mg/kg/day) and N-nitrosomorpholine (T03; 10 mg/kg/day) could not be estimated because the animals died earlier. For all compounds tested, the prediction score was nearly coincident with the score obtained from the training data at the same dose, supporting the high reproducibility of the prediction scores. In the predictive gene set, the change in gene expression (log2 ratio) increased for the 4 up-regulated genes and decreased for the 1 down-regulated genes with increasing doses of carcinogens, with the exception of Pbsn at the highest dose of thioacetamide. Consequently, the prediction score was negative at the lowest dose and increased to a positive value with increasing doses in the case of all four carcinogens. In contrast, no gene expression change depending on the administration was observed, and the prediction score remained a relatively constant negative value with increasing doses in the case of the two non-carcinogens. The intersection doses (DS0; doses at which the predictive score curves crossed score = 0), were 0.44, 1.38, 192, and 1.28 mg/kg/day for diethylnitrosamine (T01), N-nitrosomorpholine (T03), 1,4-dioxane (T14), and thioacetamide (T16), respectively. We compared the DS0 values with the tumorigenic doses (TD50) values reported for the same chemicals (ie, 0.0265, 0.109, 267, and 11.5 mg/kg/day respectively) in the Carcinogenic Potency Database of Berkeley University (CPDB; http://potency.berkeley.edu/). The double logarithmic plot of TD50 vs. DS0 was approximated by the linear equation TD50 = 1.3285 × DS0 – 0.485 (r = 0.85).
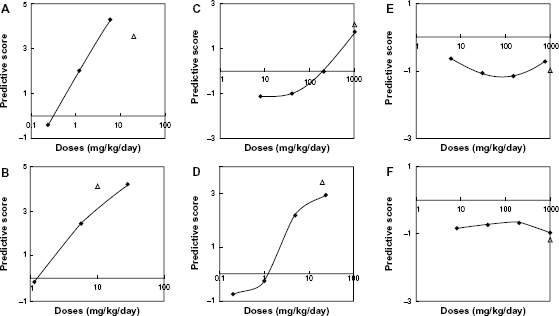
Dose-response relationship of prediction scores of four Group-1 carcinogens and two non-carcinogens. (
Discussion
Prediction formula performance
Usually, a prediction formula is built by maximizing the prediction performance of a training data set, and therefore the prediction performance is strongly dependent on the training data set. If atypical data are mixed in the training data, this can lower the prediction performance of the resultant formula when it is applied to more typical data. Therefore, to minimize the influence of atypical data in the training data set, and to build a prediction formula that is widely applicable, we built 3000 prediction formulas from 3000 working training data sets extracted from the training data set at random. The medians of the coefficients and intercept values of the 3000 working linear prediction formulas were used to the final formula. This final formula is not over-fitting to the training data set. Rather, it was the most frequently emerging formula in the training set and was therefore expected to give the most plausible prediction result.
The final prediction formula was able to correctly predict the carcinogenicity of all training carcinogens and non-carcinogens, though the predictive scores of two carcinogens, quinoline (T10) and urethane (T17), were smaller than the standard deviation. The dosage of quinoline used here (25 mg/kg/day) was similar to the dosage (22.3 mg/kg/day) that promoted tumors in rats in a previous study, 13 and it is possible to take into account dose-response of the predictive score that the gene expression change specific to Group-1 carcinogen become faint. In contrast, the dosage of urethane used here (80 mg/kg/day), was much higher than the lowest dosage (1.1 mg/kg/day) that promoted tumors in a previous study, 14 so the small predictive score cannot be explained by the dosage amount.
Importantly, six non-mutagenic carcinogens (methapyrilene HCl [T12], acetamide [T13], 1,4-dioxane [T14], methyl carbamate [T15], thioacetamide [T16] and urethane [T17]) were correctly predicted by the prediction formula, indicating that this method has advantages over other assessment such as Ames test in the prediction of carcinogenicity.
The prediction scores of Group-2 and Group-3 carcinogens had negative values, with the exception of safrole (C05) from Group-2. These results indicate that the prediction formula is specific to Group-1 carcinogens. The safrole predicted as Group-1 carcinogens were in the same cluster as Group-1 carcinogens under some conditions in hierarchical clustering analysis (data not shown), suggesting that these carcinogens share features of the gene expression profile of both groups and that multiple processes occur concurrently in carcinogenesis.
In the 11 validation carcinogens, the three non-mutagenic carcinogens carbon tetrachloride (V02), methyleugenol (V09) and o-nitrotoluene (V10) were predicted as Group-1 carcinogens. This result was confirmed by hierarchical cluster analysis, in which these chemicals resided in the Group-1 cluster.
The two non-carcinogens 3-chloro-p-toluidine (V16) and 4′-(chloroacetyl)acetanilide (V15) which were not included in the training data because they previously showed gene expression changes similar to Group-1 carcinogens, 10 were predicted as carcinogens. The dosages of 3-chloro-p-toluidine and 4′-(chloroacetyl)acetanilide used here (300 and 250 mg/kg/day, respectively), were at least 3 times the maximum dosages (100 and 67.6 mg/kg/day, respectively) used in previous carcinogenicity tests.15,16
Dose-response relationship of the prediction score
For all Group-1 carcinogens examined, the prediction score decreased from positive to negative values with decreasing doses, and the DS0 values were highly correlated with TD50 values previously published (CPDB; http://potency.berkeley.edu/line). These results indicate that the gene expression changes specific to Group-1 carcinogens emerge above the specific dosage amount dependent on carcinogens and the specific dosage can be used as indicator of TD50 value of the test carcinogen.
Function of the predictive genes
For the predictive genes, we selected 5 genes with expression changes specific to Group-1 carcinogens.
Abcb1b
The gene encoding Abcb1b (ATP-binding cassette, sub-family B (MDRTAP), member 1) showed the largest t-value in the Group-1 carcinogen vs. non-carcinogen comparison, and it showed substantially altered expression following administration of each of the Group-1 carcinogens; hence, it contributed the most to the prediction score. The Abcb1b gene and its product, P-glycoprotein, which functions as a drug efflux transporter, show increased expression in rat liver after administration of carcinogens such as 2-acetylaminofluorene (T07; a Group-1 carcinogen), its metabolite N-hydroxy-acetylaminofluorene, and aflatoxine B1 17 and it is also demonstrated that P-glycoprotein was associated with a more progressed phenotype of the liver malignancy. 18 Although Abcb1b mRNA and P-glycoprotein are up-regulated by N-hydroxy-acetylaminofluorene and aflatoxine B1, they do not confer resistance to these chemicals in NIH 3T3-mdr1b cells, this is unlike the resistance to many cytotoxic drugs that is conferred by their transport by P-glycoprotein, and induction of the Abcb1b gene may result from an increase in transcription factors responsive to DNA damage induced by these carcinogens. 19
Mgmt
The Mgmt gene encodes an enzyme involved in the DNA repair of O(6)-alkylguanine, which is the major mutagenic and carcinogenic lesion in DNA. The Mgmt gene was substantially up-regulated by administration of most Group-1 carcinogens, including two non-mutagenic carcinogens, 1,4-dioxane and thioacetamide, both of which increased the expression of the Mgmt gene by 290%. The carcinogen 1,4-dioxane has been found to be non-mutagenic in 5 in vitro assays, including a Salmonella assay. 20 DNA damage has been observed in rat liver after a single oral administration of 1,4-dioxane (2550 mg/kg) 21 ; however, neither DNA damage nor DNA repair was observed in the livers of F344 rats after a single oral administration of 1,4-dioxane (1000 mg/kg). 22 Here, repeated doses test were performed over 28 days. No substantial change in Mgmt gene expression was observed for all non-carcinogens, nine of which were mutagenic. For example, two structural isomers (2,4-diaminotoluene [T11] and 2,6-diaminotoluene [N03]) were equally mutagenic in a Salmonella assay but differed in terms of carcinogenicity, and altered Mgmt gene expression was observed only after exposure to the carcinogenic isomer, 2,4-diaminotoluene. The difference in the Mgmt gene response to these structural isomers might be explained if only 2,4-diaminotoluene (T11) were mutagenic in the livers of rats, owing to differences in the metabolic pathways of 2,6-diaminotoluene (N03) being present in vivo compared with in vitro. 23
Ccng1
Ccng1 (cyclin G1) is one of the target genes of the transcription factor p53 and is induced in a p53-dependent manner in response to DNA damage. It plays roles in G2/M arrest, damage recovery, and growth promotion after cellular stress. 24
In summary, we developed a new gene-expression-based prediction method for carcinogenicity of Group-1 carcinogens, as a model case. Our final prediction formula used the data from 5 Group-1 carcinogen-responsive genes to correctly predict the carcinogenicity of Group-1 carcinogens regardless of mutagenicity. Advantages of this method are that the reliability of the prediction can be quantitatively evaluated by the prediction score value, and the TD50 value of chemicals might be estimated by the response of the prediction score. The prediction formula built here can be applied only to Group-1 carcinogens, which constitute only 37% of the carcinogens tested in our previous study, 10 but the same method can be applied to other groups of carcinogens. Therefore, we are currently developing similar prediction formulae for Group-2 and Group-3 carcinogens, so as to be able to predict all types of carcinogens.
Disclosures
Author(s) have provided signed confirmations to the publisher of their compliance with all applicable legal and ethical obligations in respect to declaration of conflicts of interest, funding, authorship and contributorship, and compliance with ethical requirements in respect to treatment of human and animal test subjects. If this article contains identifiable human subject(s) author(s) were required to supply signed patient consent prior to publication. Author(s) have confirmed that the published article is unique and not under consideration nor published by any other publication and that they have consent to reproduce any copyrighted material. The peer reviewers declared no conflicts of interest.