
Abstract
We performed gene expression microarray analysis coupled with spherical self-organizing map (sSOM) for artificially developed cancer stem cells (CSCs). The CSCs were developed from human induced pluripotent stem cells (hiPSCs) with the conditioned media of cancer cell lines, whereas the CSCs were induced from primary cell culture of human cancer tissues with defined factors (OCT3/4, SOX2, and KLF4). These cells commonly expressed human embryonic stem cell (hESC)/hiPSC-specific genes (POU5F1, SOX2, NANOG, LIN28, and SALL4) at a level equivalent to those of control hiPSC 201B7. The sSOM with unsupervised method demonstrated that the CSCs could be divided into three groups based on their culture conditions and original cancer tissues. Furthermore, with supervised method, sSOM nominated TMED9, RNASE1, NGFR, ST3GAL1, TNS4, BTG2, SLC16A3, CD177, CES1, GDF15, STMN2, FAM20A, NPPB, CD99, MYL7, PRSS23, AHNAK, and LOC152573 genes commonly upregulating among the CSCs compared to hiPSC, suggesting the gene signature of the CSCs.
Introduction
Cancer stem cells (CSCs) are thought to possess stemness, the capacity of self-renewal and multipotent differentiation. Such CSCs have been found in patients with acute myeloid leukemia 1 and other cancers.2–8 As these cells might cause relapse, metastasis, and drug resistance of cancer, cancer therapy targeting CSCs would be an attractive strategy to cure cancer patients. Although it is important to identify the characteristic markers of CSCs, they would constitute only a small population in cancer tissues to analyze. Recently, induced pluripotent stem cells (iPSCs) have been generated from somatic cells by reprograming to have the ability of self-renewal and pluri-potency. 9 With this technique, the development of artificial CSCs has been reported. We converted mouse iPSCs to have CSC properties, and another group reprogrammed human cancer cell lines to have CSC properties through the process of iPSC preparation. Both approaches were successful to demonstrate CSC properties to form spheres in vitro and malignant tumors in vivo. 10
In this study, we newly developed the CSCs that were derived from human iPSCs (hiPSCs) with the conditioned media of cancer cell lines or that were induced from primary cell culture of human cancer tissues with defined factors (OCT3/4, SOX2, and KLFA). The CSCs were analyzed using gene expression microarray coupled with the clustering procedure of spherical self-organizing map (sSOM).
Materials and Methods
Induction of CSCs from Primary Cell Culture of Human Cancer Tissues with Defined Factors
The anonymous remnant human cancer tissue samples were provided via the Health Science Research Resources Bank. Written informed consent from donors was obtained for the use of these samples in research. The study was done under the approval of the Institutional Review Boards of the National Cancer Center of Japan and the Japan Health Sciences Foundation/the Health Science Research Resources Bank. The Health Science Research Resources Bank has been currently transferred to Japanese Collection of Research Bioresources, National Institutes of Biomedical Innovation, Health and Nutrition (http://bioresource.nibiohn.go.jp/human/index.html). The cancer tissues were derived from pathologically defined cancerous parts of the colon (from a Japanese male, 55 years old) and the stomach (from a Japanese male, 67 years old) as surgical waste after an operation. The cancer tissue-derived cell suspensions were prepared as previously described. 11
The cancer tissue-derived cells were seeded on collagen-coated dishes with Dulbecco's Modified Eagle Medium (DMEM) supplemented with 10% fetal bovine serum. One day later, the cells at approximately 5%–10% confluency were incubated with the pantropic retrovirus vector solution (OCT3/4, KLF4, and SOX2) at 37 °C for one day. The pantropic retrovirus vector solution was prepared as previously described. 11 The study was approved by the Institutional Recombinant DNA Advisory Committee of the National Cancer Center. Mitomycin C-treated mouse embryonic fibroblasts (MEFs) were seeded following the infection. The culture was replaced with confluency. The confluent culture was further refreshed with mTeSR1 medium (STEM-CELL Technologies) every day from day 22 (for colon cancer tissue-derived cells) and day 15 (for gastric cancer tissue-derived cells). Clones iPS-CC1-4, iPS-CC1-10, iPS-CC1-11, iPS-CC1-17, iPS-CC1-18, and iPS-CC1-25 were isolated from primary cell culture of human colon cancer tissues. These clones were designated as iPS-CC1. Clones iPS-GC1-1, iPS-GC1-2, iPS-GC1-3, iPS-GC1-5, iPS-GC1-7, and iPS-GC1-8 were isolated from primary cell culture of human gastric cancer tissues. These clones were designated as iPS-GC1.
The isolated clones were subcultured in each well of gelatin-coated 24-well plates. After an expansion culture, each clone was further cultured in each well of gelatin-coated six-well plates and finally cultured in a gelatin-coated 100-mm dish. The expanded clones were treated with a dissociation solution (0.25% trypsin–EDTA; Gibco, and 1% collagenase; Invitrogen) or 0.25% trypsin–EDTA and passaged in mTeSR1 supplemented with 10–20 μM Y-27632 (Calbiochem and Wako) to avoid cell death as previously described. 12 The clones were cultured with the MEFs (5 x 10⁴ cells/cm2) mainly in TeSR1 medium and occasionally in primate ESC medium (ReproCell) in gelatin-coated dishes. Using the AllPrep DNA/RNA Mini Kit (Qiagen), total RNA was prepared from each clone that was cultured with the MEFs (5 x 10⁴ cells/cm2) in mTeSR1 medium in gelatin-coated 100-mm dishes before long-term serial passage.
Induction of CSCs from hiPSCs
The cancer cell lines listed in Table 1 were cultured in adherent 100-mm-diameter culture dishes (Techno Plastic Products AG) in DMEM medium or RPMI1640 medium containing 10% FBS supplemented with 1% penicillin/streptomycin at 37 °C under the atmosphere of 5% CO2. The conditioned medium from each of the cell lines was collected and mixed with Repro FF2, Repro stem (ReproCELL Inc.), or bFGF-free human iPS stem cell medium consisting of DMEM-F12 medium supplemented with nonessential amino acid, 2.5 mM
CSCs developed from hiPSCs and human cancer cell lines, of which conditioned medium prepared for the treatment.

Gene Expression Analysis
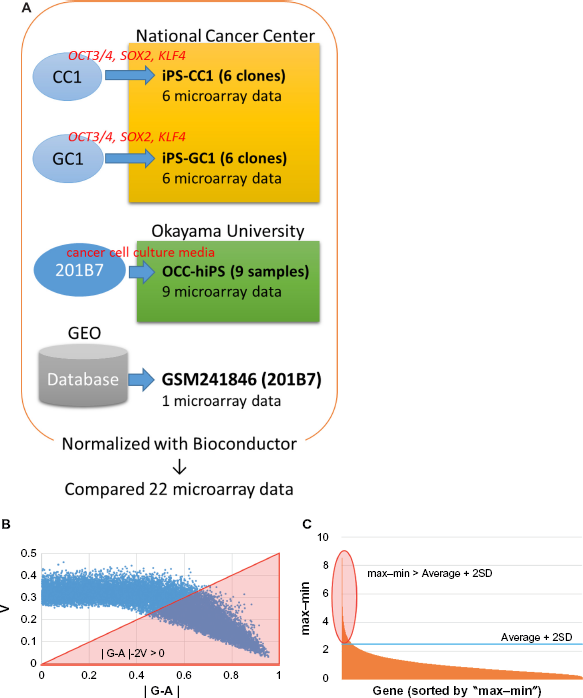
For iPS-CC1 and iPS-GC1, the microarray study was carried out using a Whole Human Genome Oligo Microarray 4x44 K (Agilent Technologies). The analysis was performed according to the Agilent technical protocols. RNA was quantified using a NanoDrop ND-1000 spectrophotometer, and quality was monitored using the Agilent 2100 Bioanalyzer (Agilent Technologies). Cyanine-3 (Cy3)-labeled cRNA was prepared from 0.5 μg RNA using the One-Color Low RNA Input Linear Amplification PLUS Kit (Agilent Technologies) according to the manufacturer's instructions, followed by RNeasy column purification (Qiagen). Dye incorporation and cRNA yield were checked using the NanoDrop ND-1000 Spectrophotometer. A total of 1.5 μg of Cy3-labeled cRNA (specific activity >10.0 pmol Cy3/μg cRNA) was fragmented at 60 °C for 30 minutes in a reaction volume of 250 mL containing 1 X Agilent fragmentation buffer and 2 X Agilent blocking agent following the manufacturer's instructions. On completion of the fragmentation reaction, 250 mL of 2 X Agilent hybridization buffer was added to the fragmentation mixture and hybridized to Agilent Whole Human Genome Oligo Microarrays (G4112 A) for 17 hours at 65 °C in a rotating Agilent hybridization oven. After hybridization, microarrays were washed for one minute at room temperature with GE Wash Buffer 1 (Agilent Technologies) and one minute with 37 °C GE Wash Buffer 2 (Agilent Technologies) and then dried immediately by brief centrifugation. Slides were scanned immediately after washing on the Agilent DNA Microarray Scanner (G2505B) using one color scan setting for 1x44k array slides (scan area 61 mm X 21.6 mm, scan resolution 10 μm, dye channel is set to Green, and Green PMT is set to 100%). The scanned images were analyzed with Feature Extraction Software 9.1 (Agilent Technologies) using default parameters (protocol GEl-v5_95_Feb07 and Grid: 014850_D_20070820) to obtain background subtracted and spatially detrended Processed Signal intensities. Features flagged in feature extraction as feature nonuniform outliers were excluded. Data (GSM241846) from the Gene Expression Omnibus was used as typical hiPSCs (201B7). 13
For Okayama CSC collection (OCC)-hiPS cells, a SurePrint G3 Human GE 8x60 K v2 Microarray (Agilent Technologies) was used for the microarray study. RNA was quantified using a NanoDrop, and quality was monitored with the Agilent 2100 Bioanalyzer (Agilent Technologies). Cy3-labeled cRNA was prepared from 10 to 200 ng RNA using Low Input Quick Amp Labeling Kit, one-color (Agilent Technologies) according to the manufacturer's instructions, followed by RNeasy column purification (Qiagen). A total of 600 ng of Cy3-labeled cRNA was fragmented at 60 °C for 30 minutes and hybridized for 17 hours at 65 °C with Gene Expression Hybridization Kit (Agilent Technologies). After hybridization, microarrays were washed with Gene Expression Wash Buffers Pack (Agilent Technologies) and scanned on the Agilent DNA Microarray Scanner (G2565CA). The scanned images were analyzed with Feature Extraction Software 10.10.1.1 (Agilent Technologies) using parameters (protocol GE1_1010_Sep10 and Grid: 039494_D_F_20120628) to obtain background subtracted and spatially detrended Processed Signal intensities. Features flagged in feature extraction as feature nonuniform outliers were excluded.
Numeric intensity data were normalized with Bioconductor14,15 package agilp (ver.3.2.0, https://bioconductor.org/packages/release/bioc/html/agilp.html) 16 as directed by maintainer's manual. Briefly, the raw intensity data were mapped to the same ID with IDswop. Mapped data were trimmed with Equaliser so as to include only the set of genes that are common to all data. Then, a baseline was generated by Baseline, and a set of gene expression data files were normalized by AALoess. Through these procedures, 18,561 genes were assessed for the expression from all the set of data. After this normalized procedure, housekeeping genes (ACTB, ATP5F1, GAPDH, GAPDHS, GUSB, GUSBL1, GUSBL2, HPRT1, PGK1, PPIA, PPIAL4, RPLP0, RPLP1, RPLP2, RPS18, TBP, TBPL1, TFRC, and YWHAZ) and hESC/hiPSC-enriched genes (POU5F1, SOX2, NANOG, LIN28, SALL4, TDGF1, DNMT3B, ZFP42, TERT, GDF3, CYP26A1, DPPA4, PODXL, and ZIC3) of the CSCs expressed at a level equivalent to those of hiPSCs (201B7) (Supplementary Fig. 1).
Flowchart of the experimental procedure.
Data filtering and sSOM analysis
A data filtering (with parameter (B) shown in Fig. 1) was performed to extract genes of which expression showed significant difference between the CSCs prepared in this study and normal iPSC 201B7. The feature scaled intensity (I) was defined as following:

where i’: normalized intensity of each probe, min: the minimum normalized intensity of a probe among all analyzed samples, and max: the maximum normalized intensity of a probe among all analyzed samples. Probes were extracted with the I value for each probe that was evaluated with the scores defined by a filtering formula ‘|G-A|-2V’, where ‘G’, ‘A’, and ‘V’ denote the average expression level of a gene among the CSCs, the expression level of a gene of normal iPSC, and the standard deviation (SD) of a gene expression level among the CSCs, respectively. As an additional filtering (with parameter (c) shown in Fig. 1), to find a significant difference between the CSCs and hiPSC, the max–min difference (max–min) of normalized intensity (i‘) for each probe was calculated and then a probe was chosen if ‘max-min’ of each probe was larger than ‘average+2SD’ of ‘max-min’ of all probes (max-min > average+2SD) (Fig. 1C). The resulting data set (using parameter (B) or (B) plus (C)) was used for mapping probes by the sSOM software Blossom (SOM Japan; http://www.somj.com). In clustering of probes, IP was included as an ideal probe of virtual probe with all I = 1 or 0 of the CSCs while I = 0 or 1 in normal hiPSC, respectively. Nonsignificant distance (NSD) was calculated as the distance between each probe and IP under the default sSOM parameters. To integrate the resolution, the top 50 probes mapping at the positions closest to IP were selected and the selected probes were subjected to sSOM analysis again to select the top 10 probes.
Results
Visualization of Expression Patterns by sSOM Clustering
DNA microarray analysis was performed to characterize the CSCs that were induced from the cancer tissue-derived cells with defined factors and that were converted from hiPSC 201B7 with the conditioned media of cancer cell lines. As a common control, hiPSC 201B7 (GSM241846) was employed, which had been scanned by an Agilent DNA microarray scanner G2505B. 13 Although the microarray scanning of the CSCs was independently performed, the data could be normalized with Bioconductor package called ‘agilp’, which was specialized in normalizing Agilent microarray data (Fig. 1A).
For sSOM analysis, normalized intensities were used, which were feature scaled (0–1) as I defining in Material and Methods. As a result of data filtering with ‘|G-A|-2V > 0’, which was modified from our previous reports,17,18 2678 probes were extracted with potentially significant differences (Fig. 1B). The resulting probes were then analyzed by sSOM software with unsupervised method. The results of sSOM were mapped as the gene expression patterns visualizing on the spherical surfaces (Fig. 2A and Supplementary Fig. 2). It is noteworthy that each pattern of the CSCs appeared similar one another in each of three clustered CSC group but different from that of iPSC 201B7. Otherwise, the grouping of the CSCs was indicated by spotting each of the CSCs on a sphere, which were characterized using the identical gene set of Figure 2A. As shown in Figure 2B, the grouping of the CSCs was indicated by spotting each of the CSCs on a sphere, which were characterized using the identical gene set of Figure 2A. The CSCs were also confirmed to be clustered into the three groups different from hiPSC 201B7 by sSOM. Thus, the gene expression profiles were considered to be visualized by the sSOM mapping (Fig. 2A) and clustering (Fig. 2B) even when judged at a glance. The differences of three CSC groups were easily distinguished from one another and different from normal hiPSC as the mapping patterns.

Mapping and clustering of normal hiPS and all the CSCs with sSOM. Microarray data of hiPSC 201B7 were obtained from NCBI GEO (GSM241846), and those of the CSCs were obtained as our original data.
To identify genes, which were commonly expressed in high or low level among all the CSCs in contrast to hiPSC, an ideal probe IP was inserted into the data set and analyzed with the 2,678 probes. ‘IP’ is defined as an ideal gene of which expression is limited only to either all the CSCs or hiPSC.19,20 Theoretically, a gene of which expression is similar among those of all the CSCs should be located around IP by sSOM mapping. Another factor was necessary to extract probes that show much difference because IP did not reflect the difference of i between normal hiPSC and CSCs. Since the CSCs were clustered into three groups, each CSC group could be compared with normal hiPSC to investigate their significant difference, respectively. In the case, a difference between the maximum and the minimum value (max-min) was calculated for each of 18,561 probes. Probes were extracted when the ‘max-min’ was larger than the ‘average+2SD’ of all probes (Fig. 1C). For sSOM analysis, datasets of 598, 439 and 402 probes were utilized for comparisons between normal hiPSC and iPS-CC1, iPS-GC1, or OCC-hiPS, respectively.
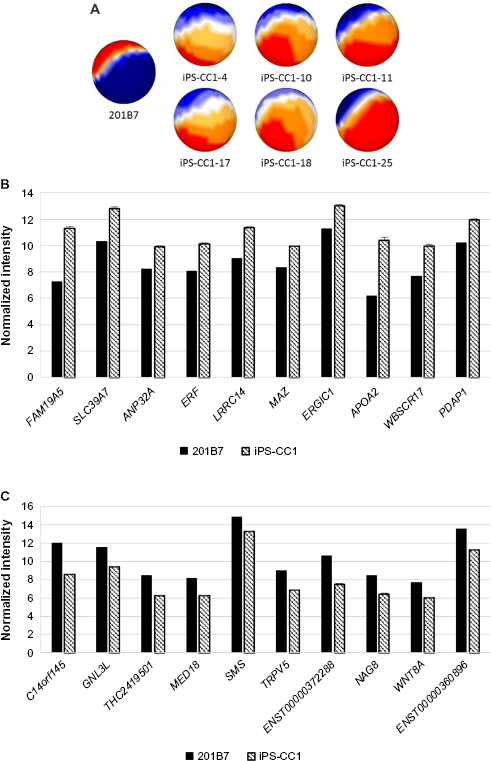
FAM19A5 is Significantly Upregulated in iPS-CC1
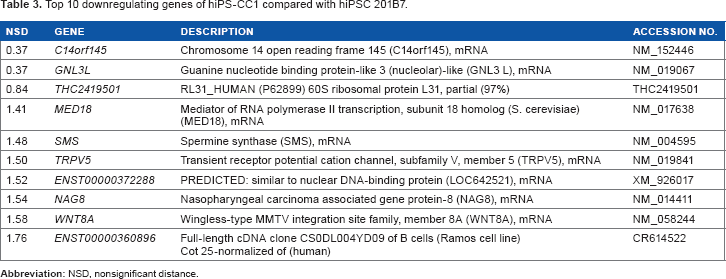
One method to prepare the CSC was to infect defined factors (OCT3/4, SOX2, and KLF4) to primary culture cells derived from cancer tissues. With this idea, iPS-CC1 was induced from cells derived from colon cancer tissues and analyzed with sSOM. The sSOM sphere of gene expression is shown in Figure 3A. Their gene expression patterns on sSOM sphere were remarkably different from that of hiPS 201B7 cells, suggesting that the sSOM analysis was effective to select genes characteristic to iPS-CC1. Among significantly upregulating genes, IP showed RPS4Y2/1 the most characteristic in iPS-CC1 (Supplementary Fig. 3 and Supplementary Table 1). However, this was probably a difference between the sex because 201B7 has 46 XX chromosome, whereas iPS-CC1 was induced from a male cancer patient (46XY). Except for Y chromosome-related genes, FAM19A5 was considered as the most characteristic gene of iPS-CC1 (Fig. 3B and Table 2). In contrast, C14orf145 and GNL3L were the most downregulating genes of iPS-CC1, although their difference of intensity was not so much large as those of upregulating genes (Fig. 3C and Table 3).
Mapping and comparison of normal hiPSC and iPS-CC1 cells with sSOM.
Top 10 upregulating genes of hiPS-CCI compared with hiPSC 201B7 except for Y-related genes.

Top 10 downregulating genes of hiPS-CC1 compared with hiPSC 201B7.
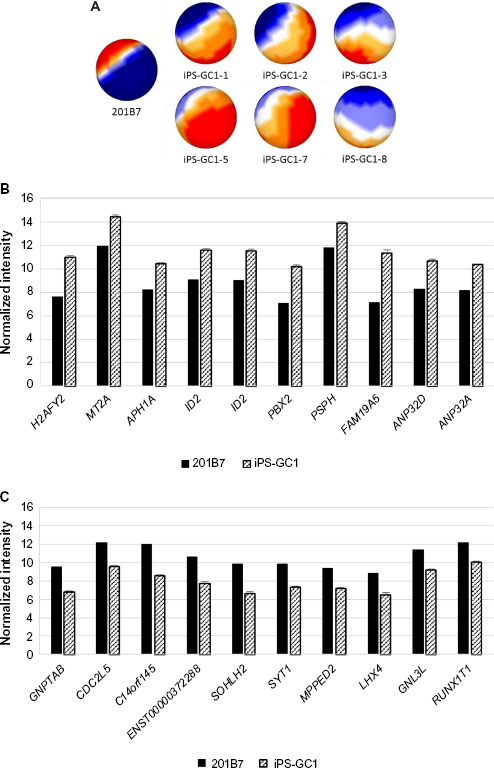
MT2A is Significantly Upregulated in iPS-GC1
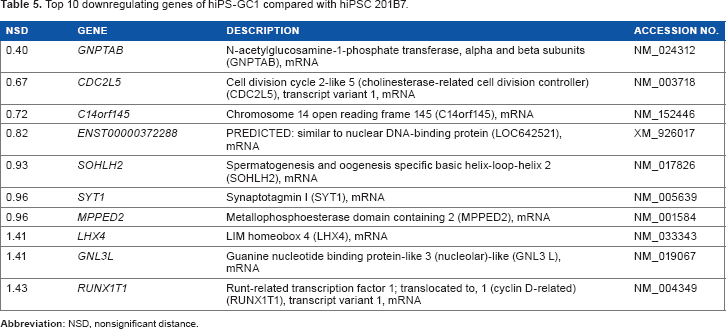
Six clones of iPS-GC1 series were induced from primary culture cells derived from gastric cancer tissues with defined factors. iPS-GC1 series were analyzed with sSOM. The sSOM sphere of gene expression was shown in Figure 4A. Their gene expression patterns on sSOM sphere of iPS-GC1 series were evidently distinct from that of hiPSC 201B7. A clustering analysis with IP extracted genes significantly upregulating among iPS-GC1. PRS4Y1/2 was ranked as the top with the shortest NSD in iPS-GC1 because of the inconsistency of sex between iPS-GC1 from male and hiPS 201B7 cells from female (Supplementary Fig. 4 and Supplementary Table 2). Except for Y chromosome-related genes, MT2A was a gene closest to IP as significantly upregulating gene (Fig. 4B and Table 4). In contrast, GNPTAB was ranked as the most significantly downregulating gene in iPS-GC1 (Fig. 4C and Table 5).
Mapping and comparison of normal hiPSC and iPS-GC1 with sSOM.
Top 10 upregulating genes of hiPS-GCI compared with hiPSC 201B7 except for Y-related genes.

Top 10 downregulating genes of hiPS-GC1 compared with hiPSC 201B7.
Histones, TMED9, and CASKIN1 are Indicated as the Characteristic Gene in the series of OCC-hiPS
The CSCs, which were converted from hiPSCs with the condition media of cancer cell lines, are now being registered in the OCC. 10 They were mapped by sSOM (Fig. 5A). Each sample of OCC-hiPS series was prepared from hiPSC 201B7 with each conditioned medium of each different cancer cell lines. As a result, each different gene expression pattern of the CSCs indicating different phenotypes could be induced under each different conditioned medium, as demonstrated in mouse iPSCs.10,21 From a NSD by sSOM analyses, histone genes were nominated as the most upregulating genes in the CSCs of OCC-hiPS (Fig. 5B and Table 6). Histones might regulate gene expression causing various cell dysfunction, although further investigation would be required to clarify the mechanism underlying the upregulation. Transmembrane emp24 protein transport domain containing 9 (TMED9) and CASKIN1 might be other candidates of the characteristic genes upregulating in the CSCs of OCC-hiPS. On the other hand, AL832540 was ranked as the most downregulating gene in the CSCs of OCC-hiPS with the shortest NSD (Fig. 5C and Table 7).

Mapping and comparison of normal hiPSC and OCC-hiPS with sSOM.
Top 10 upregulating genes of OCC-hiPS compared with hiPSC 201B7.

Top 10 downregulating genes of OCC-hiPS compared with hiPSC 201B7.

TMED9 is Upregulated in All CSCs
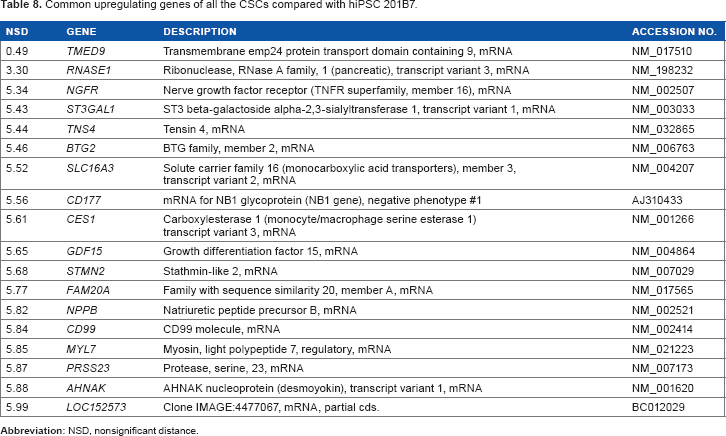
The aim of the sSOM analysis with microarray data was to identify a gene whose expression was commonly up/downregulated in all the CSCs. For this purpose, significantly up/downregulating genes, which were nominated in Figures 3–5, were summarized in the Venn diagrams (Fig. 6A and B). Using the diagrams, 18-upregulating genes and 15-downregulating genes were extracted from three of the CSC groups in common. Of these commonly upregulating genes, TMED9 was the most characteristic gene in all the CSCs (Fig. 6C and D and Tables 8 and 9). NPPB seems to also have significance, although its NSD was larger than that of TMED9. Down-regulating genes seem to be much less significant than upregulating genes (Figs. 3–5).
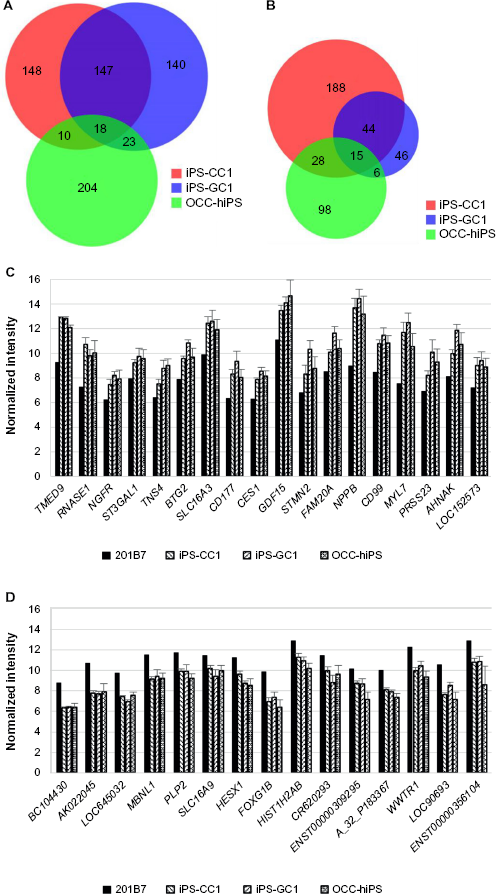
Venn diagrams of upregulating genes or downregulating genes extracted by each sSOM analysis of iPS-CC1, iPS-GC1, and OCC-hiPS.
Common upregulating genes of all the CSCs compared with hiPSC 201B7.
Common downregulating genes of all the CSCs compared with hiPSC 201B7.

Discussion
The CSCs were converted from normal hiPSCs with the conditioned media of cancer cell lines; otherwise, the CSCs were induced from primary cell culture of human cancer tissues with defined factors. Gene expression microarray experiments confirmed that the CSCs and typical hiPSC commonly expressed many hESC/hiPSC-specific or -enriched genes. The sSOM demonstrated that the CSCs could be clustered into three groups due to their origins with unsupervised method. Nevertheless, the supervised method of sSOM identified TMED9, RNASE1, NGFR, ST3GAL1, TNS4, BTG2, SLC16A3, CD177, CES1, GDF15, STMN2, FAM20A, NPPB, CD99, MYL7, PRSS23, AHNAK, and LOC152573 genes commonly upregulating among all the CSCs compared with normal hiPSC.
DNA microarray analyses allow us to perform large-scale and high-throughput screening of differentially expressed genes among many samples. To reveal the patterns of gene expression, a method to analyze and evaluate the large data generated by series of microarray experiments plays an important role. Hierarchical clustering and SOM clustering have widely been used to extract useful information from expression profiles. Compared with hierarchical clustering, SOM has a number of features well suited to cluster genes by their expression patterns. It also has good computational properties and is easy to run and fast.22,23 A conventional plane SOM (2D SOM) has not yet common in gene clustering procedure. The reason might be that the grid units at the boundary of the 2D SOM result have fewer neighbors than the units inside the map, which often cause the border effect – the weight vectors of these units collapse to the center of the input space. 24 To solve this, sSOM is suitable for data with underlying directional structures. sSOM has been shown effective to remove the border effect and is useful to convey the information of distance and direction with running speed comparable to the conventional 2D SOM.25,26 Since we have successfully applied sSOM for the analytical procedure of microarray data,17,19,20,27 we employed sSOM for the data analysis in this study. By comparing the sSOM patterns of CSCs with that of normal hiPSC, we successfully demonstrated a simple and easy way to screen for the candidate genes commonly and specifically expressed among all the CSCs. One reason for this success would be due to the feature scaling to 0 to 1 (I). Without this scaling, the result of sSOM sphere is shown in Supplementary Figure 5. It would be difficult to distinguish from each other in this figure. There are no enough data for the copy number changes or chromosomal abnormalities in original cells. It is needed to study the relationship between our CSCs and these problems.
Normalization of data is another important issue in data mining. Standard protocols for the normalization to make various dataset comparable should be available but not always available even it is often necessary to search relations between data. If the normalizing process was skipped or inadequate, analyses would result in nothing or false. Since all microarray data were obtained by Agilent microarray system in this study, Bioconductor package agilp, which was developed by Thomas et al to normalize the microarray data, was employed. 28 They clearly showed a relationship between T-cell population and T-cell signature score obtained from various microarray data provided by independent groups. 28
Through the data mining procedure described earlier, FAM19A5 was significantly upregulated in iPS-CC1, MT2A in GC1-iPS, and TMED9 in all the CSCs including OCC-hiPS. FAM19A5 has been reported as cholangiocarcinoma marker by protein analysis. 29 MT2A was expressed in a subgroup of patients with acute myelomonocytic leukemia 30 and also recently identified as a gastric cancer-related gene. 31 Although these independent studies support our results, little information related to cancer is known about TMED9. TMED9 is also called as p24α2 or p25 and a transporter protein expressed on endoplasmic reticulum membrane. It had found to maintain endoplasmic reticulum exit sites and vsesicular-tubular clusters 32 and has special domain to form membrane fidelity. 33
Although NSD of NPPB is much larger than that of TMED9, NPPB reasonably appears to be upregulated with much difference between CSCs and hiPSC 201B7 in the average value (Table 8 and Fig. 5A and C). Actually, NPPB is reported as a biomarker for a cancer-associated fibroblast in ovarian cancer, 34 and these cancer-associated fibroblasts are thought as feeder cells of tumor including CSCs.35,36 The feeder cells might be related with the progeny of CSCs and supporting the self-renewal of CSCs. 37 Similarly with NPPB, MYL7, which encodes Atrial Light Chain-2, is also listed as one of the 18 genes (Table 8). This gene is considered to be related to cell stemness rather than tumorigenesis.38,39 RNASE1 is a member of ribonuclease family and cleaves phosphodiester double-stranded RNA bonds. This protects its host against viruses. Moreover, it is also known that glycosylated Asn88 on this molecule is correlated with the pancreatic cancer. 40 NGFR is a one of the growth factor receptors that binds to neurotrophins. This receptor was referred as breast cancer marker before. 41 ST3GAL1 is a type II membrane protein that catalyzes sialylation. Chong et al reported that it has a critical role to sustain glioblastoma growth. 42 TNS4 is an adhesion protein mediating integrin. This protein is upregulated by ERK1/2 and enhance cancer cell migration. 43 SLC16A3 encodes MCT4 that mediates lactate transportation 44 and whose expression is upregulated in clear cell renal cell carcinoma. 45 CD177 is known as a neutrophil-specific antigen and could be a gastric cancer marker. 46 GDF15 is a member of TGF-β superfamily and contributes to host defense from injury or disease. 47 The expression of GDF15 is upregulated by various stimuli and, because of this, it could be a biomarker of many cancers. 48 STMN2 was first identified as a neuron-specific, developmentally regulated protein. 49 This gene is upregulated in hepatoma cells and might play a critical role in β-catenin/TCF-mediated carcinogenesis. 50 CD99 is expressed on leukocytes and helps T-cell adhesion. 51 Among patients with diffuse large B-cell lymphoma, two-year event-free survival gets worse when CD99 is positive in germinal center B-cells. 52 PRSS23 is a serine protease and coexpressed with estrogen receptor a, which is a biomarker for human breast cancer. 53 Chan et al found that PRSS23 might be critical for estrogen-induced cell proliferation of estrogen receptor α-positive breast cancer cells. 54 CES1 is a serine esterase and involved in the activation of prodrugs like angiotensin-converting enzyme inhibitors. 55 This gene is highly expressed in human colorectal cancers. 56 These molecules are thought to be positively correlated with cancer. On the other hand, AHNAK is expressed in various cell types and involved in many cellular processes such as calcium regulation and actin organization.57–59 Abnak-/- mouse showed progressed hyperplasia of mammary glands, and their expression was low in human breast cancer tissues than that in controls. 60 BTG2 regulates cell cycle in a p53-dependent way. 61 Some studies have shown that BTG2 expression is downregulated in cancer tissues.62–64 These molecules could be tumor suppression marker. There is little information about FAM20A that has a functional locus in hematopoiesis 65 and LOC152573.
Collectively, iPSC technology and gene ontology were embodied that the sSOM analysis could depict the gene signature of the CSCs and list up the marker genes, although further biological study would be needed for the relationships between the nominated genes and the CSCs.
Conclusion
We newly developed artificial CSCs commonly expressing hESC/hiPSC-enriched genes at a level equivalent to those of typical hiPSCs (201B7). The unsupervised method of the sSOM analysis demonstrated that the CSCs could be divided into distinct groups due to their culture conditions and original cancer tissues. Furthermore, the supervised method of the SOM analysis suggested the gene signature and the marker genes of the CSCs.
Author Contributions
Conceived and designed the experiments: AS, TI, MI, MS. Analyzed the data: AS, TI. Wrote the first draft of the article: AS. Contributed to the writing of the article: AS, TI, AV, TK, MS. Agreed with the article results and conclusions: AS, TI, TK, AV, MS. Jointly developed the structure and arguments for the article: AS, TI, TK, MI, AV, JM, AM, HM, MS. Made critical revisions and approved the final version: AS, TI, MS. All authors reviewed and approved the final article.
Supplementary Material
Footnotes
Acknowledgment
The authors thank Dr. Heizo Tokutaka for developing sSOM software Blossom, Dr. Toshio Kitamura for Plat-GP packaging cells, Japanese Collection of Research Bioresources for providing hiPSC 201B7, and National Institutes of Biomedical Innovation, Health and Nutrition for human cancer tissues. The data discussed in this publication have been deposited in NCBI's Gene Expression Omnibus
66
and are accessible through GEO Series accession number GSE83883 (![]() ).
).