
Abstract
Background
DNA copy number alteration is common in many cancers. Studies have shown that insertion or deletion of DNA sequences can directly alter gene expression, and significant correlation exists between DNA copy number and gene expression. Data normalization is a critical step in the analysis of gene expression generated by RNA-seq technology. Successful normalization reduces/removes unwanted nonbiological variations in the data, while keeping meaningful information intact. However, as far as we know, no attempt has been made to adjust for the variation due to DNA copy number changes in RNA-seq data normalization.
Results
In this article, we propose an integrated approach for RNA-seq data normalization. Comparisons show that the proposed normalization can improve power for downstream differentially expressed gene detection and generate more biologically meaningful results in gene profiling. In addition, our findings show that due to the effects of copy number changes, some housekeeping genes are not always suitable internal controls for studying gene expression.
Conclusions
Using information from DNA copy number, integrated approach is successful in reducing noises due to both biological and nonbiological causes in RNA-seq data, thus increasing the accuracy of gene profiling.
Background
Next-generation sequencing (NGS) technologies have been widely used in various areas of genetic studies, such as the use of RNA-seq technology in detecting differentially expressed genes and measuring genome-wide gene expression profiles 1 and the use of DNA-seq technology in detecting single-nucleotide polymorphisms (SNP) and copy number alterations (CNAs). 2
DNA stores genetic information that can be transcribed into RNA, and subsequently RNA may be translated into proteins that are directly involved in biological activity. Thus, DNA and gene expression data are often used for investigating whether normal biological processes are altered and how these alterations are associated with various disease conditions such as tumorigenesis. In order to obtain a holistic view of the interrelationship between DNA, RNA, and protein, many studies have incorporated DNA-, RNA-, and protein-level experiments to better understand the complex nature of genetic diseases such as cancers. The results thus far are promising. 3
DNA point/structural aberrations and RNA differential expression are very often found to be associated with diseases such as cancers. Specifically, DNA CNAs can alter the expression levels of genes that are associated with genetic disorders. For example, the deletion of tumor suppression genes or the amplification of oncogenes can lead to expression-level change in these genes and subsequent diseases.4–6 In a study of B-progenitor acute lymphoblastic leukemia, Mullighan et al. 7 found that about 40% of patients had DNA sequence deletions and/or amplifications, indicating a possible association between CNAs and acute lymphoblastic leukemia. Therefore, it is natural to assume that many of the genes associated with tumorigenesis are harbored within the CNA regions. On the other hand, studies have also revealed that, while epigenetic factors and other modifications of the genome attribute to a minor proportion of the changes in gene expression, 8 about 15% of the variations in gene expression can be explained by CNAs. 9
A common approach used in the analysis of gene expression data is to interrogate whether individual genes behave differently for subjects receiving treatment or control or between subtypes of a disease. Although both expression array and RNA-seq platforms are widely used for generating expression data, the latter is more powerful in that it can also pick up novel microRNAs that have not yet been incorporated into arrays in microRNA sequencing.10,11 However, analytically, it remains a challenge to accurately identify differentially expressed genes from RNA-seq data. For example, the lists of top differentially expressed genes identified using various software packages may not agree in many cases, and a lower type I error rate is usually accompanied with a decreased statistical power. While controlling the false-positive/discovery rate12–14 is one important component for proper expression data analyses, appropriate normalization is indispensable to ensure accurate and reliable results. 15
Many microarray-based gene expression studies have demonstrated that normalization is essential for proper analysis of expression data. Normalization ensures that signal intensities are properly centralized and that differences in signal intensities are due to biological differences between samples, rather than nonbiological noise.16,17
RNA-seq data, generated by the
Many normalization methods have been developed for RNA-seq data to mitigate the between/within-sample differences, such as those in library size (sequencing depth) and GC content.18,19 Some authors propose scaling the data so that the total read counts are the same across samples.20–22 Others directly adopt the microarray data normalization methods, such as quantile normalization (QN) on the log-transformed, length-standardized read counts. 23 Alternatively, Mortazavi et al. 18 proposed using the per kilobase per million mapped method to adjust for read count bias due to gene-coding region length. Robinson and Oshlack 15 employed an empirical strategy to equate the overall expression levels of genes among samples based on the commonly made assumption that the majority of genes are not differentially expressed. Specifically, a weighted trimmed mean of the log expression ratios is used to estimate the ratio of RNA productions so that a large number of genes that are highly expressed in one condition can be properly adjusted. In addition, Hansen et al. 24 proposed using conditional QN to remove technical variability. We comment that these methods do not take into account the effect of DNA copy number on the gene expression, and thus, almost every method has obvious limitations when dealing with samples with DNA copy number changes.
CNA is a hallmark of cancer. Studies have shown that gene expressions are correlated with DNA copy number.25,26 DNA copy number change alters the number of DNA templates from which genes can be transcribed and, thus, directly affects the corresponding expression level. To properly normalize expression data, ideally, the global average of the expression levels of genes with the same copy number should be the same across samples, given that differentially expressed genes account for only a small percentage of all genes interrogated. In fact, the majority of current RNA-seq normalization methods assume that the whole genome has a copy number of two (except for the sex chromosomes) by default. While this assumption is acceptable for samples with no structural genetic alterations, it would not work well for data generated from cancer samples, which usually have CNAs.
In fact, since gene expression is downstream of DNA alteration and if gene expression levels can be accurately measured, then the underlying mechanisms (for example, CNAs and point mutations) are not relevant. However, we cannot assume by default that the expression values of individual genes obtained by sequencing/microarray technology are accurate, before performing appropriate normalization, for example, adjusting for CNAs.
As far as we know, gene expression measurements are all relative. In general, some reference values are used to ensure that the actual expression level of a gene (per cell) is proportional to the measured value, for example, read count is used for gene expression in RNA-seq. However, if such reference values are not correctly chosen, then the proportion between the actual expression level and the measured value will not be consistent across samples, and thus, gene expression cannot be considered to be accurately measured. Consequently, all the downstream analyses will become problematic. Note that accurately controlling the number of cells used in the laboratory experiments might be an alternative for improving data normalization; however, this is not the focus of this study.
For the samples with CNAs, choosing such reference values is not straightforward in DNA data normalization.17,27 In fact, it is equally challenging in RNA data normalization – we will demonstrate this by showing the existence of CNA-oriented correlation between DNA copy number and gene expression in the “Methods” section.
With the rapid development of biotechnology, an increasingly larger number of contemporary genomic studies collect data generated by multiple platforms simultaneously. Today, many experiments interrogating DNA, RNA, and protein activities are being carried out on samples from the same group of subjects, which thus provide opportunities for statisticians to apply integrated data analysis strategies to improve the accuracy and reliability of the statistical tests. Specifically, in cancer genetic studies, statistical methods have been proposed to integrate analysis of copy number and gene expression data, with the belief that more genetic information could be revealed by incorporating complementary information from DNA and RNA data together into a statistical model.28,29
Using either a two-step approach or an integrated approach, many investigations have demonstrated improved power for detecting DNA and RNA variations that would not otherwise be detected using either DNA data or RNA data alone. Commonly used approaches very often include the following steps: (1) identifying the regions with CNAs, (2) calling the copy number status of each CNA region, and (3) comparing the expression levels of genes in the CNA regions to obtain a list of differentially expressed genes for further investigations.28,29 Many test statistics have been proposed, and generally speaking, they are often based on either correlation or externally centered correlation between CNA and gene expression.25,26,30,31 Although these approaches are mainly designed to partition regions with strong, equally directed abnormalities from other regions, none of them addresses the possibility of using the available laboratory obtained DNA data, that is, addition information, to improve RNA data normalization.
In this article, we propose an integrated RNA-seq normalization method, referred to as integrated normalization, which takes advantage of the availability of DNA-seq data to appropriately normalize RNA-seq data. In the next section, we describe the proposed method. Then, we utilize a publicly available dataset to demonstrate how the normalization method affects DE gene detection as well as RNA expression profiling results. At the end of this article, we discuss the advantages and limitations of the proposed method and possible improvements.
Methods
Distribution of the Ratios of Sample Read Counts
Suppose that we have both the DNA-seq and RNA-seq data generated from each patient who has one of two subtypes of a cancer. Specifically, for DNA, preferably, we have both the tumor and the matched normal tissue samples for each patient; otherwise, we can generate a generic control by averaging the data of several unrelated samples. Note that having paired tumor and germline samples would be ideal but is not a requirement. However, for RNA, we have the expression data for each tumor sample and a generic control, which is generated by averaging the expressions of a few matched normal tissues.
Denote 
where
Note that the above constructed variables are the ratios of modified read counts and take values between 0 and 1. Thus, when 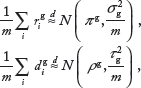
where g ∊ {C1,C2},
It is evident that a beta distribution is approximately symmetric if the two parameters are close. Also, if the two parameters of a beta distribution are both greater than 1, then the beta distribution is unimodal (see Supplementary File 1 for details). In this case, even for a small window size
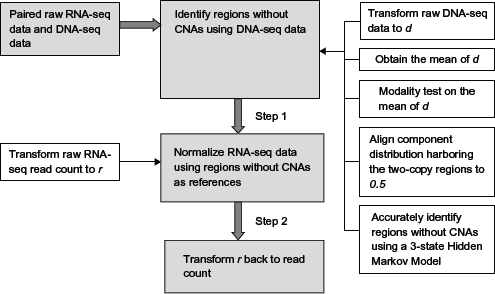
A flow chart of the proposed integrated normalization method.
Integrated RNA-seq Data Normalization
By assuming that differentially expressed genes only account for a small proportion of the genes interrogated, QN has been successful for microarray-based expression data normalization. However, QN might not be the best choice for normalizing DNA samples with substantial (whole chromosome/arm amplifications/deletions) CNAs. 17 In fact, it has been shown that for samples with CNAs, using QN for microarray DNA data can generate unwanted results, that is, the average log ratio of the regions without CNAs does not align to 0. Several methods have been proposed to address this problem such that alignment can be appropriately performed.17,27,33,34 Motivated by these methods, we propose an integrative approach for RNA-seq data normalization in this article.
Given the availability of both DNA-seq and RNA-seq data in many genomic studies, our proposed method includes two steps. First, identify genomic regions that do not have CNAs using DNA-seq data. Second, perform RNA-seq data normalization using the regions without CNAs as references. We comment that, compared to DNA-seq data, RNA-seq data exhibit far greater variability due to switching between the
An Operational Sequence of Integrated RNA-Seq Normalization
In Figure 1, we present a flow chart that outlines the operational sequence in the proposed procedure.
Identification of Regions without CNAs Using DNA-Seq Data
We propose using the following steps to identify genomic regions without CNAs.
Calculate the averages of 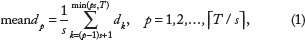
where ⌈ ⌉ is the ceiling of a number,
Apply a modality test
35
on mean
Initially assign the two-copy state to the component distribution harboring regions without CNAs. This step aims at roughly identifying the regions that do not have CNAs. Although a modality test would not provide the exact locations of these regions, it provides initial estimates of the mean of these regions, so that the subsequent analysis can use them as the references. In fact, there are two ways to obtain the initial two-copy state information: (1) If laboratory data such as cytogenetic data are available, regions that do not have CNAs can be identified straightforwardly, and the mean of the component distribution harboring these regions will be set to 0.5. This will ensure that in the following CNA detection, regions without CNAs can be identified and used as the references. (2) If laboratory data are not available, we can assume that the component distribution that contains the majority of genes reflects the regions without CNAs. Note that the second option is simple but less optimal because sometimes, CNAs occur in the majority of the genome, for example, triploid or tetraploid samples. However, should reference regions be incorrectly identified for some samples, they are very likely to be detected in the laboratory validation step, and appropriate correction can be made. In fact, there is a third option, in which an extra step of genotype calling using DNA-seq data is needed. A component distribution with heterozygous SNP proportion less than 15% is referred to as having loss of heterozygosity. The component distribution, which is next to it and has a higher mean, represents the regions that do not have CNAs. 17
Identify regions without CNAs using a hidden Markov model (HMM).

Comparison of the correlation between DNA-seq and RNA-seq data, using proposed variables

Identify two-copy regions using a three-state HMM. (A) Regions in red are those genes in two-copy state, regions in black are those in copy number gain state, and regions in green are those in copy number loss state. (B) Regions in two-copy state were highlighted in black. Note that we did not
We have previously developed a method, with accompanying software called PAIR33,37 for SNP array data normalization using a two-state HMM. 33 The key component of PAIR is to identify regions without CNAs. Note that in many HMM-based CNA detection algorithms, parameters for each hidden state need to be estimated iteratively. However, the accuracy of parameter estimation largely depends on whether every possible hidden state has been defined. Since CNAs are sample specific and cannot be predicted in advance, any method for CNA detection in a large number of samples will require a large number of hidden states, resulting in a heavy computation burden. As an alternative, in PAIR, we proposed an HMM with only the following two states: regions that harbor SNPs without CNAs (two-copy regions) and regions that do not. By setting up upper and lower bounds for the two-copy regions, we can accurately partition the regions with and without CNAs, while the parameters for the regions that harbor various forms of CNAs do not have to be estimated individually.
In this article, we adopt the same principle as that in PAIR in identifying regions without CNAs, while making the following modifications.
Use mean
Instead of partitioning mean
Use an iterative approach to estimate the mean of mean
RNA-Seq Data Normalization
Using the regions without CNAs detected by the procedure in the proceeding subsection as references, the normalization process for RNA-seq data can be carried out through the following steps.
Align the mean of the ratios, 
Histograms of 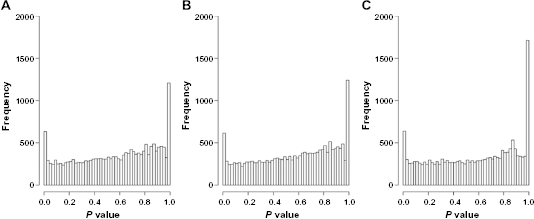
Adjust tumor read counts based on the updated 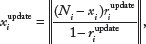
Compare the DE Gene Detection Power before and after Normalization
Bioconductor package DESeq was used to detect DE genes, as well as perform expression profiling. Default parameters were used for analyzing the raw data, the DESeq normalized data, and the integrated normalized data, except that we forced the size factor (the coverage of a specific library) 38 for all samples to be 1 when the raw and integrated normalized data were analyzed.
The Housekeeping Genes
In order to understand the effect of CNA on GE, as well as how copy number change affects the expression of housekeeping genes, we downloaded the human housekeeping genes from a public database 39 and utilized the online Clone/Gene ID converter 40 to obtain gene names. In the end, we obtained approximately 460 housekeeping genes from this database. Spline smoothing was performed on the housekeeping gene expression data, and the correlation between the expressed levels of these genes and the corresponding DNA read count ratios was calculated.
Results and Discussion
In this section, we demonstrate the performance of the proposed integrated normalization method by applying it to a public dataset. Both RNA-seq and DNA-seq data for eight breast cell lines, including seven from breast cancer and one from nontumor breast epithelial cells, are available for download from the public domain Gene Expression Omnibus with access ID, GSE27003.
Four of the seven cancer cell lines were established from estrogen receptor positive (ER+) and the other three from ER- breast tumors. Both DNA and RNA of these cell lines were extracted from mid-log phase populations of low passage number cultures, as described in Ref. 41.
RNA-Seq and DNA-Seq Data Preparation
RNA-Seq Data Preparation
Short reads were aligned and annotated using the pipeline described in Ref. 41 . Specifically, Illumina's alignment tool, Eland_RNA, was used to align the short reads to genome and exon junctions. The aligned sequence tags were summarized and annotated using Illumina's CASAVA tool. As a result, a total of 18,517 genes were annotated, and the total read counts for these genes were used for the downstream analysis.
DNA-Seq Data Preparation
The 50 base pair paired-end short reads from Illumina Genome Analyzer were aligned by Bowtie. 42 A maximum of two mismatches were allowed in each alignment, and reads mapped to multiple genomic locations were discarded. SAMtools was used to generate the BAM format output files, 43 and subsequently read count for each location was calculated using HTseq-count. 44 As a result, a total read count within the start and end locations of each of 18,517 annotated genes was calculated.
The Correlation between GE on DNA Copy Number
We calculated the correlation coefficients (CCs) between the RNA-seq and DNA-seq data using the variables introduced in the “Methods” section. The range of the CC is from 0.100 to 0.186, indicating a weak relationship. However, considering that the random variation in signal intensity (especially from RNA-seq data) might have disguised the true association, we performed circular binary segmentation (CBS)
45
on both DNA-seq and RNA-seq data using the average of four observations to reduce variation, as well as to meet the normal assumption. Then, we replaced the original mean
Figure 2 shows that the segmentation patterns are very similar between RNA-seq and DNA-seq data (Fig. 2a and b). For a comparison, we performed the same analysis on other variables constructed by a commonly used transformation, the log ratio between tumor and control read counts, and observed much lower correlation (Fig. 2c and d). The correlation between DNA copy number and gene expression has been evaluated in other studies. This correlation is comparatively weak, at round 10%–20%, in most of these studies. However, by applying the proposed variable transformation/construction, that is, constructing

Volcano plots: (A) integrated normalized data; (B) DESeq normalized data; and (C) raw data. A few genes expressed in only one condition and, thus, did not show in the volcano plots.
Identification of Two-Copy DNA Regions Using DNA-Seq Data
The high correlation described in the previous section demonstrates the necessity and advantage of incorporating the information on CNA in the RNA-seq data normalization.
More specifically, a three-state HMM was applied to identify regions without CNAs using the DNA-seq data. Here, we did not use CBS for segmentation. While CBS can accurately identify change points in a sequence, it is not designed for automatically assigning segments with the same copy number state to a specific copy number. In the HMM, we defined the three hidden states as copy number loss, no CNAs, and copy number gain. Based on the first-difference 46 estimated variance, we set upper and lower bounds for the two-copy regions by simulation (details in Ref. 33).
For the initial values of the means of the regions without CNAs in the HMM, we used the copy number status confirmed in Ref. 41 Note that this type of copy status information can be obtained if cytogenetic data are available. Specifically, we obtained the copy number status of two regions (regions with or without CNAs) in chromosomes 8 and 17 separately and identified the component distributions that harbor these two regions. We then set the initial mean of the component distribution harboring the regions without CNAs to 0.5. After applying the HMM, the copy number states of these regions were compared with those in Ref. 41 to ensure consistency. As an example, we presented the identified regions without CNAs in an ER- cell line sample in Figure 3. It was confirmed in Ref. 41 that this sample has a copy number loss in the region from 125,504,248 to 126,521,417 on chromosome 8, and no CNAs on chromosome 17 from 44,246,133 to 63,413,540. This is consistent with Figure 3 (see two yellow vertical bars in Fig. 3b), indicating that our segmentation results are consistent with the lab results.
Note that, if the lab results are not available initially, we will assume that the largest component distribution harbors the two-copy regions. If this assumption is found to be incorrect during the lab validation process, we can reset the initial value and repeat the process.
Normalization of RNA-Seq Signals
Based on the fact that RNA-seq and DNA-seq segment means are correlated, and the assumption that DE genes only account for a small proportion of all the genes interrogated,15,47 we normalized the RNA-seq data such that the
DE Gene Detection Comparison
To evaluate the effect of normalization method on the downstream analysis, DE gene detection was performed by using Bioconductor package DESeq.
38
The distributions of the
Total numbers of DE genes identified at different cutoff values.

We further generated and presented the volcano plots in Figure 5. We can see that a substantially larger number of smaller
Next, we compared the total numbers of DE genes at different Benjamini and Hochberg (BH)
12
cutoff values (Table 1). It is clear that for all the cutoff
The numbers of DE genes (with BH-adjusted
The numbers of DE genes (BH-adjusted

We also used the
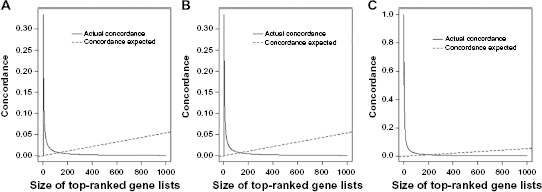
Concordance at the top plots. (A) Concordance between top genes obtained by analyzing the raw data and the integrated normalized data. (B) Concordance between top genes obtained by analyzing the DESeq and integrated normalized data. (C) Concordance between top genes obtained by analyzing the raw data and DESeq normalized data.
We preformed the same analysis by using the edgeR software, and similar results were observed. We further performed GC content and gene length adjustments using the conditional QN (CQN). 24 However, adding CQN step resulted in smaller numbers of DE genes for small cutoff values (Supplementary Table 1).
Last, we constructed the heat maps in Figure 7 using DE genes with BH-adjusted

Heatmaps of the genes with BH-adjusted
To check the effect of using different BH-adjusted
The Housekeeping Genes
Housekeeping genes are those whose expressions, under ideal situations, should not be regulated or influenced by the experimental conditions/tissue types. 50 However, based on our results, the expression levels of these housekeeping genes are correlated with DNA copy number. As a comparison, the correlations between DNA copy numbers and expression levels of the housekeeping genes are somewhat higher than those between DNA copy numbers and RNA expressions for all genes. For example, we observed that the highest correlation is 0.280 for housekeeping genes, while the correlations for all genes range from 0.10 to 0.186. In addition, the spline smoothing fitted lines for DNA data and RNA data for the housekeeping genes look similar, indicating that the expressions of housekeeping genes are, against our intuition, affected by DNA copy number changes (Fig. 8a and b). Our interpretation is that changes in expression level caused by CNAs are less compensated by gene regulation mechanisms, and thus, CNAs play a more important role in affecting housekeeping gene expression. These results provide strong evidence to suggest that, when CNAs exist, it might not be appropriate to use housekeeping genes as the reference genes for quantitative real-time reverse transcription polymerase chain reaction normalization, and these genes also should not be used as references in NGS data normalization.

The plots of CNA and RNA-seq housekeeping gene expression. Spline smoothing curve was superimposed in bold. (A) For DNA-seq data,
Conclusions
RNA-seq and expression array technologies have been widely used in cancer genetic studies to identify DE genes and reveal the biologic spectrum of cancers, as well as provide diagnostic tools and identify new therapeutic targets. RNA data normalization, especially for microarrays, has been well discussed. However, many normalization methods do not take into consideration how DNA copy number change alters gene expression. Consequently, though these methods work well for normal samples without CNAs, they may not be sufficient for cancer samples with substantial CNAs.
It can be very difficult to identify CNAs using RNA expression data directly, due to the on/off nature of gene expression, and the substantial differences in expression levels of different genes. On the other hand, DNA level data, along with RNA level data, have been collected in many cancer genetic studies to better understand the causes of tumorigenesis. This provides an excellent opportunity for biostatisticians/bioinformaticians to develop integrated methodologies to extract more meaningful information from the data.
We demonstrated in this article that moderate-to-strong correlation between DNA and RNA data does exist, especially for cancer samples with substantial CNAs. This was achieved by taking the average of signal intensities within a window of fixed size for both RNA and DNA data to reduce signal intensity variation and using segment mean values in correlation calculation.
The magnitude of the correlation between DNA copy number and gene expression level is a good indication of whether DNA copy number change affects gene expression. The integrated normalization method proposed in this article benefits more with stronger correlation, in other words, when CNAs occur in many genomic regions.
Many current RNA-seq normalization methods do not have the capacity to make adjustments for CNA-caused variations. The integrated method in this article aims to address this issue by appropriately aligning the global signal intensity. The integrated normalization resulted in more differentially expressed genes being detected than using either the raw data or the DESeq default normalized data. Parenthetically, nuisance variations due to differences in CNAs and sequencing depths would not be removed without proper normalization, thus, diluting the power for DE gene detection. After appropriate normalization, genes that are
We demonstrated the utility of the proposed method using publicly available cell line data due to the facts that there is no restriction on the access of these data and that the cell lines are well studied, with many of their genomic characteristics well known. Meanwhile, we do not foresee any theoretical challenges in applying the method on patient data. Specifically, there should be no difference in terms of aligning the reference two-copy regions across samples regardless whether the data came from cell lines or patient samples. Gene expression profiling is commonly used to provide accurate diagnosis/classification results. In this study, we expect that expression profiling for all the cell lines agrees with the known biological classification. Meanwhile, we anticipate that such classification results should not be affected by how many DE genes are used in the classification algorithm. However, to our surprise, other than using the integrated normalized data, using either the raw data or the DESeq default normalized data, resulted in inconsistent classification results (for different cutoff
We did not perform GC content and gene length adjustments in the integrated normalization for two reasons:
GC content is supposed to affect the numerator and denominator of the constructed read count ratios similarly; thus, it is not necessary to adjust the GC content for the ratios. We plotted the GC content versus the constructed ratio and did not observe obvious relationship between them (Supplementary Figs. 6 and 7); In the DE gene detection stage, since GC content is the same for both the comparison and reference groups, GC content adjustment is also not necessary. Note that the relationship between GC content and DNA/RNA read counts are quite consistent across samples (Supplementary Figs. 8 and 9). In fact, many of the DE gene detection methods, for example, the protocol proposed by Trapnell et al.
51
, the DESeq software we used, and edgeR, do not suggest GC content adjustment because of the nature of such comparisons.
Nevertheless, to evaluate the performance of GC content and gene length adjustments, we applied CQN on those samples. Not surprisingly, CQN did not perform well when we used smaller cutoff values. Our interpretation is as follows:
CQN makes data adjustments based on GC content and gene length; however, since the comparison and the reference groups have the same GC content and gene length, such adjustments have little effect on the comparisons; Since CQN made certain adjustments based on GC content and gene length, if such adjustments are not necessary, then the CQN process turns out to introduce noises and, thus, may have negative effect on the comparisons. Note that, when the effect of GC content is consistent across the samples, then as mentioned in (1), GC content adjustment is not necessary; otherwise, if the effects are not consistent, then we cannot rule out the possibility that we are actually adjusting the spurious correlation between expression and GC content, which is not appropriate. As a comparison, the integrated normalization utilizes information obtained from real experiments, and thus, the adjustments bear biological meanings.
Performing RNA-seq data normalization by using CNAs detected from DNA-seq data can be very useful when CNAs do exist, and such normalization ensures that downstream analyses are more meaningful. For samples that have only focal CNAs or without any CNAs (normal samples), this approach is still applicable except that all the genome will be used as the reference in RNA-seq normalization.
The limitation of our method is that we need a control sample(s), preferably paired normal samples, for CNA detection (it is not needed for RNA-seq data). In fact, accurately identifying CNAs without using any control sample(s) is not straightforward and may need some manual trial and error. In addition, our method improves the power of detecting truly DE genes, but it is not capable of discriminate the driver and passenger genes. Although DE genes located within CNA regions are more likely to be the driver genes than the passenger genes, the nonuniqueness nature of the cause of gene expression level change, along with the very often near-random distribution of CNAs, determines that seeking such an association is quite challenging.
Authors Contributions
Designed the experiments: SY, ZF. Did the data analysis: SY, ZF. Wrote the article: SY, DM, KZ, ZF. All authors read and approved the final article.