
Abstract
Cancer cells have anomalous development and proliferation due to disturbances in their control systems. The study of the behavior of cellular control system requires high-throughput dynamical data. Unfortunately, this type of data is not largely available. This fact motivates the main issue of this article: how to use static omics data and available biological knowledge to get new information about the elements of the control system in cancer cells. Two important measures to access the state of the cellular control system are the gene expression profile and the signaling pathways. This article uses a combination of these two static omics data to gain insights on the states of a cancer cell. To extract information from this kind of data, a statistical computational model was formalized and implemented. In order to exemplify the application of some aspects of the developed conceptual framework, we verified the hypothesis that different types of cancer cells have different disturbed signaling pathways. To this end, we developed a method that recovers small protein networks, called motifs, which are differentially represented in some subtypes of breast cancer. These differentially represented motifs are enriched with specific gene ontologies as well as with new putative cancer genes.
Introduction
Cancer cells have anomalous development and proliferation due to disturbances in their control systems. To increase the knowledge about these phenomena, some quantitative models and experimental studies have been proposed either in an abstract theoretical perspective1,2 or in some particular case studies.3,4 The cell control systems are constituted by the integration of a gene system and signaling pathways that regulate gene expression and metabolic pathways. The signaling pathways are composed of a biochemical network that has a hierarchical modular structure, that is, many complex networks are decomposed in simpler ones, the modules or motifs. 5
A very informative data for studying such complex phenomena would be dynamical data evaluated through time series of omics measurements taken from a single cell or from a set of synchronized cells. Unfortunately, this kind of data is not largely available. This fact motivates the main issue of this article: how to use static omics data and available biological knowledge to get new information about the elements of the control dynamics of cancer cells.
Two important measures to access the state of the cell control system are the gene expression profile and the signaling pathways (ie, control signals built primarily from protein-protein interaction [PPI]). Tumor biopsies data from large cohorts of patients are abundant (eg, the one from The Cancer Genome Atlas) and allow the assessment of gene expressions, which are important to evaluate the impact of genetic heterogeneity in the control systems. This information may be relevant, for example, to distinguish the control systems’ behavior in different types of cancer or in different stages of a given cancer type. Another available data that has some structural information about the cell control system dynamics is the human PPI network.
This article uses a combination of two static omics data: the human PPI network 6 and the transcript expression measurements taken from breast cancer tissues 7 to model the states of a cancer cell. The integration of biological networks and gene expression data is not new. Several reports have addressed the combined use of both types of data using different approaches.8–14 For each type of cancer, this integrated approach results in a subgraph of the human PPI graph, labeled with relative (with respect to the normal tissue) transcript expression values associated to each protein. This labeled PPI graph connects the problem of extracting information about cancer cell dynamics from static omics data and complementary biological knowledge to the formal approach of probabilistic graph models, such as gene expression network 15 and motif network analysis. 16 This network analysis models the phenomena of different kinds by the same abstract model, a graph. It takes abstract graph structure measures, which depend on nodes and arcs, and interprets them in the context of the phenomena studied. The labeled subgraphs under this study will be called as motifs.
To exemplify the application of some aspects of the developed conceptual framework, we will verify the hypothesis that different subtypes of breast cancer have different representation of motifs. This article proposes an analytical method, which integrates PPI networks and differential tissue transcript expression data to identify motifs (ie, small subgraphs) of disturbed signaling pathways and measure the distribution of the observed state of these motifs in breast cancer subtypes. Motifs showing a differential representation in the subtypes are then analyzed, and new cancer genes are proposed.
Following this section, the “Materials and methods” section presents the methods used to extract, analyze, and model the data. The description of the data includes their source, semantics, and preparation. The “Model of analysis” section presents the mathematical description of the operators used to identify the motifs, estimate the motif distributions, and recognize the characteristic motifs of each cancer subtype. In the following “Results” section, the analysis outputs are given, including identification of motifs, characteristics of motif recognition, data enrichment of the motifs recognized, analysis of motifs internal connections for annotation of new cancer proteins, and corresponding enrichment. The article is ended with the discussion of potential applications of the technique presented here and other similar techniques for learning about the structure of the cellular control system and the disturbed subsystems.
Materials and Methods
Data source
In this subsection, we describe the TGA expression data, the PPI data and the enrichment technique.
TCGA data
The TCGA expression data were retrieved from the cBio portal. A
PPI data
The human PPI network was obtained from the STRING database, which includes both known and predicted PPIs.
20
For each association, a confidence score is calculated based on the evidence collected from different data types. Here, we selected interactions with score 700 or 900 from experimental or
Enrichment data
The protein datasets derived from the analyzed motifs were submitted to
Model of analysis
In this subsection, we describe the computational methods developed in this article. First, we introduce some concepts and definitions. Second, we describe the adopted strategy for the motif identification. Finally, we present our methodology to assess the frequencies of the motifs that were obtained in the identification step.
Definitions
A
Definition 2.1. A PPI network graph
A
Definition 2.2. Given a subgraph
In this work, gene expression information is gathered from cancer tissue subtypes. For each subtype, several samples were collected. For each subtype and each sample, the expression levels of a given gene are given by its
Definition 2.3. Given a gene
Let the elements of the set {–1,0,1} be denoted as
Now, let

Connected graphs with four vertices.
Let
With the definitions presented so far, we can now introduce the concept of motif used in this article.
Definition 2.4. A motif
In Figure 2, we present an example of motif. Finally, let
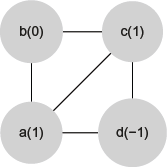
Example of a motif
Based on these definitions, we developed algorithms for motif identification that will be explained in the next section.
Motif identification
In this section, we present two algorithms for motif identification, which is, for a given set of motifs, the search and counting of their occurrences in the PPI network graph, cancer tissue subtypes, and their respective samples. The first algorithm is a basic search and count algorithm, which is described in a higher level, that is, we show only the general steps to perform the motif identification. The second algorithm is a modification of the basic search and count algorithm for connected graphs with four vertices, which we further explored in this work with computational experiments.
The basic search and count algorithm
The basic search and count algorithm receives as input a set of cancer tissue subtypes and their respective set of samples, an integer
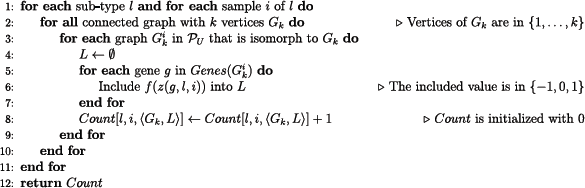
Pseudocode of the basic search and count algorithm.
In this basic search and count algorithm, we assume that the counting issues that might arise due to symmetries between motifs are solved through an appropriate implementation of the
An algorithm for connected graphs with four vertices
The general strategy of this algorithm is, for each vertex in the PPI network graph PU, to explore its adjacent vertices (and also some vertices adjacent to adjacent vertices) and store all connected subgraphs with four vertices found during that procedure. For each search initiated in a vertex

Example of PPI network graph PU.
We start the description of this algorithm by a recursive function to identify the connected subgraphs of four vertices in a PPI network graph PU. To this end, we first introduce an additional concept: let
The IDENTIFY-SUBGRAPHS function receives a PPI network graph PU and a vertex

Pseudocode of a recursive function to identify the subgraphs from a PPI network graph.
In Table 1, we show a simulation of the IDENTIFY-SUBGRAPHS function for an exploration of the PPI network graph depicted in Figure 4 that starts in vertex 7. The main algorithm receives as input a set of cancer tissue subtypes and their respective set of samples and a PPI network graph PU. It returns a table

Pseudocode of a search and count algorithm for connected graphs with four vertices.
Simulation of the IDENTIFY-SUBGRAPHS function.

After the execution of the 19th and last recursive call.
In the pseudocode shown in Figure 6, the function EXTRACT-TOPOLOGY called in line 11 avoids two motifs that are symmetric to each other of being counted separately. Once for connected graphs with four vertices, there are a few possible configurations when the graph isomorphism is taken into account. Figure 1 shows the six equivalent classes defined by all isomorphisms; we treated each case directly through a table that maps different pairs

A procedure to avoid two motifs that are symmetric to each other of being counted separately. At each figure, vertices names and their associated labels are, respectively, outside parentheses and between parentheses. The motifs of (A) and (B) are symmetric to each other, and the EXTRACT-TOPOLOGY function maps them to the same unique motif (C).
Motif frequency analysis
In this section, we describe the methodology of the analysis of the motif statistics produced using the algorithms presented in the previous section (ie, the data stored in the
Let 

Results
The PPI graph used for this work has 7335 nodes, with degrees (ie, number of connections) varying from 1 to 3090 (for the protein UBC), with an average degree of 8. It is important to emphasize that present-day human PPI networks are still incomplete with a high rate of false negatives. We deal with this problem by using mass concentration analysis of relevant motifs. The breast cancer subtypes considered are presented in Table 2.
Number of samples in each breast cancer subtype.

Motif identification
In the following, a motif is just a subgraph where a vertex is associated with any protein with a given label. Consequently, the number of different motifs is 6 × 3 4 = 486, since there are six topologies (Fig. 1) and three possible labels for each vertex.
As expected, the vast majority of motifs have labels
In the following, for the sake of simplicity, we use the letters s, n, and o to indicate the expression levels –1 (suppressed), 0 (normal), and 1 (overexpressed), respectively.
Differential motifs
The counting algorithm of the “Motif identification” section and Expression (2) provide an estimate of motif distribution among breast cancer subtypes. Using Shannon's entropy (Expression (1)), we identified the motifs that are more represented in each breast cancer subtype.
With four subtypes, the maximum entropy is –4 × 0.25 log, 0.25 = 2, representing an uniform distribution. Table 3 shows all the motifs with entropy lesser than one, indicating a concentration of occurrences in one or two subtypes. We are interested in those that are strongly represented in one subtype and have a small relative number of occurrences in others.
Entropy of motifs and distribution among subtypes.

For instance, the first motif in Table 3, K4-osss (topology K4 and expression levels
Enrichment of differential motifs with specific ontologies in breast cancer subtypes
The differential motifs identified in Table 3 were further analyzed in terms of the composition of proteins in the PPI subgraph constructed for each breast tumor subtype. From the samples of each breast cancer subtype, we took the union of all instances of a motif, obtaining a set of proteins. These non-redundant lists (one for each subtype) were then evaluated regarding the enrichment of ontologies from the KEGG. 22 A total of 27 and 12 KEGG categories were exclusively present in TNBC and luminal A, respectively (Fig. 8). For luminal A, Kite-ssos was the most enriched motif in the KEGG categories as shown in Figure 8, while for TNBC, Linear-osoo was the most enriched motif.

KEGG enrichment analysis. The dotchart shows the enrichment analysis performed by using clusterProfiler. All motifs selected by Shannon entropy method are represented at the
Interestingly, most of the KEGG categories found exclusively in TNBC are involved with tumorigenesis, including
Use of motifs to complement the annotation of cancer pathways
One of the most complete annotations of cancer-related pathways is provided by the KEGG database. Its pathways in cancer entry have been widely used as a comprehensive landmark for a systemic view of cancer genes and proteins.
As mentioned earlier, the data in Figure 8 strongly support the view that the motifs identified by our method belong to cancer-related pathways. It is, thus, reasonable to speculate that the set of proteins belonging to our motifs might harbor new putative cancer genes. To evaluate this possibility, we first selected all instances of the motifs that contained at least one node from KEGG's pathways in cancer entry. Among these instances, half (51%) contained only one node from that respective KEGG entry. Instances with two, three, and four nodes from the KEGG entry corresponded roughly to 33%, 14%, and 2% of all instances, respectively. There was no difference between the breast cancer subtypes regarding the above distribution. Next, we select all other proteins belonging to the same motifs but not belonging to the KEGG's pathways in cancer. Proteins classified as overexpressed or underexpressed were separately ranked based on their frequency in the motifs.
The top candidates are listed in Table 4. Using the
The ranked proteins associated with pathway in cancer.

In the list of underexpressed proteins, the transcription factor GATA3 was identified by our method as important in triple negative, and several reports have linked alterations in GATA3 with different aspect of breast tumor biology. 26 The data presented in Table 4 strongly suggest that our method is able to identify known and new cancer genes.
Discussion
The method presented in this study identifies the recurrent four-node motifs in the human PPI network superimposed with expression data from breast cancer patients from the TCGA project. The PPI graph permits to assess regions of the four-dimensional gene expression space and, based on gene vector distribution, recognize the differential gene vectors. The
Author Contributions
Conceived and designed experiments: SJS, JB, MDG, MR. Data generation: AF, MDG, MR. Analyzed the data: MDG, JB, MR. Biological analysis: SJS, AF. Wrote the first draft: JB, SJS, MDG, MR. Contributed to the writing of the manuscript: JB, SJS, MR, MDG. Agree with manuscript results and conclusions: All authors. Jointly developed the structure and arguments for the paper: JB, SJS, MDG. Made critical revisions and approved final version: JB, SJS, MDG, MR. All authors reviewed and approved of the final manuscript.