
Abstract
Modeling tumor growth has proven a very challenging problem, mainly due to the fact that tumors are highly complex systems that involve dynamic interactions spanning multiple scales both in time and space. The desire to describe interactions in various scales has given rise to modeling approaches that use both continuous and discrete variables, known as hybrid approaches. This work refers to a hybrid model on a 2D square lattice focusing on cell movement dynamics as they play an important role in tumor morphology, invasion and metastasis and are considered as indicators for the stage of malignancy used for early prognosis and effective treatment. Considering various distributions of the microenvironment, we explore how Neumann vs. Moore neighborhood schemes affects tumor growth and morphology. The results indicate that the importance of neighborhood selection is critical under specific conditions that include i) increased hapto/chemo-tactic coefficient, ii) a rugged microenvironment and iii) ECM degradation.
Keywords
Introduction
Tumors are highly complex, self-organized biological systems spanning multiple scales from the molecular to cell and further to tissue level. Tumors are characterized by their increased heterogeneity and their ability to dynamically interact and adapt to changes of the microenvironment. A tumor begins with a few cells that have gained the ability to proliferate uncontrollably. The extensive heterogeneity is reflected in both the genetic diversity of the tumor mass as well as in its complex microenvironment that accommodates molecules important for cellular growth, proliferation, and migration. The continuous interaction among the cancer subpopulations and the tumor microenvironment drives tumor progression and invasion.
Tumor invasion involves the ability of tumor cells to migrate and invade into the surrounding host tissue micro-environment. Tumor cells are embedded in a fibrous material known as extracellular matrix (ECM), which is composed of macromolecules including collagens, laminin, and fibronectin. The structure and composition of the ECM play a critical role in tumor invasion, morphology, and metastasis because it affects cell adhesion and motility.1, 2 The ECM is constantly remodeled as the tumor grows. For example, cancer-associated fibroblasts produce extracellular proteins affecting the synthesis of ECM. Collagen filaments are reorganized and cancer cells produce enzymes that can degrade some of the components of the ECM. As the tumor mass becomes invasive, peripheral cells start detaching from the tumor mass, the compactness of its surface is lost, and tumor morphology is determined by the dynamic interactions between cells and the heterogeneous ECM. Cell movement is a complex process that has not yet been understood fully.2–6 It requires the activation of the actin-based machinery within the cell, which produces forces transmitted through cell–matrix adhesions on the surface areas of the cell that are in direct contact with the ECM. Under this consideration, the heterogeneity of the matrix such as the stiffness of the fibers, the various pore sizes, and the orientations of structures such as blood vessels, muscle fiber, and ECM play a significant role in cell movement. In addition to their haptotactic movement, tumor cell migration can be driven by gradients of diffusible substances such as oxygen, glucose, or other signals, a process known as chemotaxis. In order to facilitate their movement, tumor cells usually produce matrix-degrading enzymes (such as matrix metalloproteinases) that degrade the ECM locally. 7 Furthermore, cancer cells can migrate either individually or collectively, increasing the complexity of migration dynamics.
The emergence of tumor invasion is fatal and numerous mathematical models and research work focus on understanding the underlying mechanisms with the ultimate aim to improve prognosis and therapeutic outcome.8–19 Mathematical models enable the exploration of multiple hypotheses that allow a better understanding of tumor evolution and its complex components, which cannot be easily tested in the laboratory. Furthermore, the models predict behaviors of the system that can either guide new targeted experiments or may be even used in clinical practice assuming a model is thoroughly validated. However, the complexity and diversity of the mechanisms that comprise tumor combined with its multidimensional nature make it a very challenging problem to model mathematically. Current mathematical models mostly focus on a single-scale modeling, the microscopic level that describes molecular interactions, the mesoscopic level that takes into account cellular interactions, or even the macroscopic level that describes tissue-level dynamics. Models that integrate various scales in their description are called multi-scaled. In terms of their mathematical basis, the models are either discrete cell-based or continuum models. The discrete modeling approaches, usually model cells as individual entities that follow a set of rules, which allow them to interact with their environment.9, 16 In this case, space and time are of discrete nature. The rules determining cell's behavior are usually biologically or experimentally inspired. On the other hand, the continuum methods approximate cancer cells and their microenvironment as continuous concentrations described by partial differential equations.17, 20, 21 Cell-based models are probably more appropriate for studying tumor invasion, as its evolution involves the migration of a few cells.
Discrete cell-based models can be further subdivided into (i) on-lattice, cellular automata models, which assume that cells lie on a fixed lattice structure, and (ii) off-lattice models, which are closer to a real representation of cells, but they are more difficult to implement. 22 Each tumor cell in the cellular automata model is usually represented by a single lattice site. The lattice structure can constrain the neighborhood on which cell–cell interactions occur. In square lattices, a cell can have either four (von Neumann neighborhood) or eight (Moore neighborhood) neighbors. Cellular automata models have been widely used to describe physical systems because of their strong advantage to remain simple, yet capable of producing rather complex behaviors.
In this work, we present a hybrid approach, based on a model initially proposed by Anderson. 1 Hybrid models address the multiscale nature of cancer complex phenomenon by combining both discrete and continuous variables. A rule-based stochastic cellular automata model on a two-dimensional (2D) square lattice that describes cellular proliferation and movement at cell level is combined with a continuum deterministic model that describes the chemical/ECM dynamics of the microenvironment. We show how a simple extension from von Neumann to Moore neighborhood in cell migration can better approximate cellular motility by minimizing the artifacts arising from lattice anisotropies and how the neighborhood selection can significantly affect tumor growth and morphology under specific conditions.
Hybrid Model of Tumor Growth Description
The mathematical model utilized in this work consists of two interacting components, the discrete one reflecting the tumor cells and the continuous one representing the extracellular environment. The environmental component refers to the tumor microenvironment that includes the oxygen concentration and the ECM density. Both are modeled by continuous variables, whereas the tumor cells are modeled in a discrete way using cellular automata that move, proliferate, and die independently following a set of rules. We further assume that cells lie on a fixed square lattice structure and that each lattice site can accommodate only one tumor cell. Cells can move to a neighboring site that is not occupied by another cell. In cellular automata, the two most commonly used neighborhoods are the von Neumann and the Moore neighborhoods, which take into account the four and eight neighbors of a cell, as seen in Figure 1. The main focus of this work lies on the analysis of how different neighborhood schemes affect cell movement and eventually tumor evolution and morphology. Hence, the way cell movement is approached plays a vital role and will be analyzed in detail in the following section.
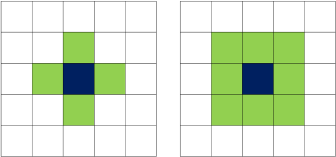
The cellular automaton neighborhoods von Neumann and Moore are visually represented on the left and right, respectively.
Continuum Component
Oxygen
We assume that the tumor is fully and homogeneously vascularized, ie, nutrient sources exist in every grid point of the computational domain. For simplicity, we assume that, the basic nutrient needed by the tumor cells for their growth and proliferation is oxygen.
1
Oxygen is produced by the established vasculature and diffuses into the extracellular space. The equation that describes the spatiotemporal evolution of oxygen is the following:

It should be noted that real tumors are highly more heterogeneous than the above simplifications. Other components of the microenvironment that the continuous compartment could accommodate, such as glucose and hydrogen ions, also play a significant role in tumor. 23 On top of that, real tumor vessels are tortuous, dilated, and leaky; factors which considerably affect the homogeneity of nutrient supply and removal of waste products. However, considering that the focus of our model was to examine the tumor morphologies that arise from the discrete component and not from the interactions of cells with a complex microenvironment, we preferred to oversimplify the continuous component. Nevertheless, as a step toward more realistic cases, cellular migration on a random ECM has also been investigated.
Discrete Component
Cell life cycle and proliferation
Each tumor cell is individually tracked. Each cell can live or die depending on the local oxygen concentration. A living cell can proliferate if it is mature and if there is available space for its daughters or else it becomes quiescent. The lifecycle of a tumor cell is illustrated in the flowchart of Figure 2. Specifically, at each time step, the cell checks if the local oxygen level is under a certain threshold

Cell life flow chart.
In this work, all tumor cells are assumed identical with respect to their phenotypic characteristics. Under this consideration, all cells proliferate at the same rate. Tumor cells with local oxygen concentration above
When a cell reaches its proliferation age, then it is ready to produce two daughter cells. However, proliferation can only occur if there is an empty space in the Moore neighborhood of the cell in order to place its daughter cells. One daughter cell replaces the parent and the other is placed in a neighboring empty site. If no empty space is available, the cell enters the quiescent state. Cells in quiescent state are thus ready to proliferate but cannot do so due to space restriction. An active cell is considered a living cell that is not mature. Having reached their proliferation age, quiescent cells are considered mature and are assumed to consume half the oxygen compared to the active cells. 1 On the other hand, in the event that an empty space is found, the current cell resets its age and makes an exact copy of itself to the empty position. If during the proliferation, multiple empty spaces are found in the neighborhood, a random one is chosen. For simplicity, we assume that mutations do not occur during the proliferation process.
In order to avoid artifacts that would occur if all the cells reached their proliferation ages simultaneously, initial cell ages are randomly assigned to them. Additionally, at each iteration of the lifecycle execution, the cells are updated in a random order. This ensures that at each iteration every cell randomly receives a different priority in the update queue.
Cell Movement
Cancer cell movement is described in this work by the discretized form of the following advection–diffusion equation
24
:
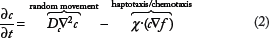
Equation 2 implies that cell motion is dominated by two processes. The first term corresponds to random motility (diffusion), whereas the second term describes the directed migratory response of cells to gradients of either fixed, nondiffusible molecules such as collagens and fibronectin or to unbound, diffusible chemicals such as oxygen, processes known as haptotaxis and chemotaxis, respectively. The choice of the directed movement does not affect the form of the equation, but only changes the interpretation of the guided movement term,
The goal is to discretize movement and create rules that guide the cells in such a way that these discrete entities will behave like their continuous counterpart, namely, Equation 2. 25 In order to achieve that, standard finite-difference methods were used to numerically solve such equations. In the context of continuous variables, such methods utilize Taylor expansions to approximate the differentials of an equation, yielding a description of the shift of concentration from one grid point to its neighboring ones. The idea is that if small-enough space and time steps are used, the continuous solution can then be well approximated.
von Neumann neighborhood
The von Neumann neighborhood consists of upper, lower, left, right, and of course the central lattice points of the grid. It is the simplest 2D scheme on which finite differences can be applied. Equation 2 can be discretized using a standard five-point scheme following the von Neumann neighborhood that yields
1
:
Weights of concentrations shifts for the von Neumann neighborhood.

Moore Neighborhood
In finite differences, usually – but not necessarily – expansion of the neighborhood scheme increases the accuracy of the scheme as well as its computational load.26, 27 We proceed by expanding the neighborhood to include the four diagonal points as well as the orthogonal ones. Likewise the nine-point finite-differences scheme can be used to yield weights to all nine points of a Moore neighborhood:

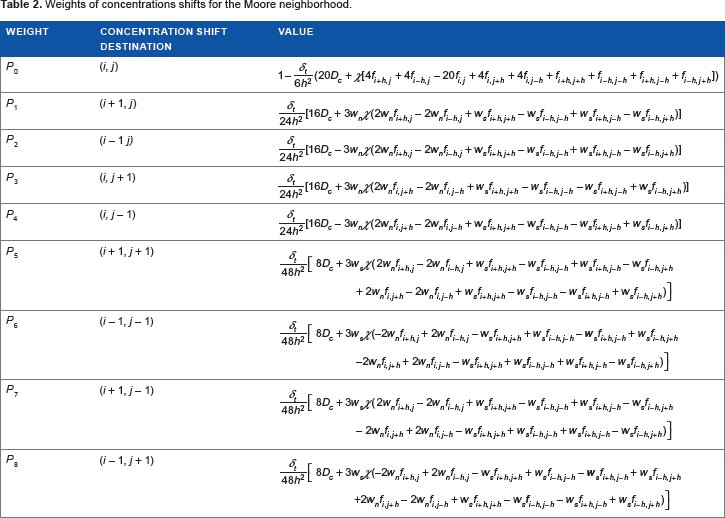
In short, we performed these calculations by approximating the first derivatives in two ways. The first approximation is the same as the one used in the von Neumann neighborhood and the second uses only the diagonal points. The latter approximation enables the computation of the weights to the extra four diagonal points. The final approximation for the derivative is defined as the average of the previous two. The corresponding weight values can be found in Table 2.
Weights of concentrations shifts for the Moore neighborhood.
Choice of direction
Following the work of Anderson,
1
the probability that a cell will move toward a corresponding direction is proportional to the weight that describes the continuous concentration shift. To that purpose, the weights
To construct the ranges
If a cancer cell cannot move toward a certain region, such as in the case where the specific location is occupied by another cell, the weight
Directed movement scenarios
As discussed previously, cell movement is a complicated process and can have various driving mechanisms. Cells can move toward diffusible or nondiffusible chemicals and can migrate either individually or collectively depending on the absence or presence of cell–cell junctions. Furthermore, the structure and composition of ECM considerably affect cellular movement. In our work, we investigate some simplified scenarios of chemotaxis and haptotaxis in order to demonstrate the effect a neighborhood selection may have in tumor growth and morphology under specific conditions.
The first set of experiments assumes that the directed cell movement is driven exclusively by chemotaxis where the chemical attractor is assumed to be the oxygen concentration. This means that tumor cells prefer to move to sites of higher oxygen concentration. This set of experiments was constructed in order to take advantage of the oxygen distribution, which produces a dynamic gradient of radial symmetry and forms a tumor that it is expected to approximate a circular shape.
The second set of experiments considers the haptotactic movement of tumor cells, where cells are assumed to move up to gradients of macromolecules of the ECM,
Time Steps
In order to perform nondimensionalization, the duration of iteration is chosen and is represented by τ. The total simulation time [0, T] is segmented in pieces of τ length, each representing a single iteration of the model. Furthermore, each iteration time step is segmented in smaller steps noted as reaction time steps τ
Reaction time step
The reaction step is assumed to be small enough for the model to be in a quasi–steady state. In essence, the running model compartment considers the variables controlled by the other model parts stable. From the perspective of a cell, for example, this means that during a reaction step the cell can follow its life cycle (ages, proliferates, and dies), while the state of the environment and the position of the cells are stationary. The respective principle is followed when calculating the next environment concentrations and cell positions.
Compartmental time steps
In addition to the

Visual representation of the time steps. See text for details.
As implied by the quasi–steady-state assumption, the environment and the cell positions remain unaffected while the life cycle updates the cell states. Therefore, the cell life flow chart in Figure 2 will always yield the same result. To avoid unnecessary calculations, the cell life step
The choice of the movement time step
Choice of movements per reaction,

Boundary Conditions
When solving the Equation 1, which describes the oxygen, Dirichlet boundary conditions are preferred over no-flux (
Simulation process and simplifications
In order to focus our study on cellular movement and the effect of neighborhood schemes on tumor growth and morphology, many simplifications have been made.
Concerning the discrete part, a single phenotypic scheme was chosen to ensure that the movement and proliferation parameters are the same for all the populations. Furthermore, the cell–cell adhesion forces were ignored at this stage as we focus only on an expansion of the movement neighborhood.
The continuous part of the model was also stripped to its essentials to minimize run time and avoid any possible direct or indirect source for differentiation in the results arising from the interaction between the continuous concentrations of the microenvironment and the movement selection schemes. However, in a different set of experiments, a random ECM has been applied as a step toward more complex environments. In all the experiments, the tumor is considered homogeneously vascularized and neoangiosis is not taken into account.
Implementation
The model was implemented using MATLAB, C, and openMP. The MATLAB platform was extensively used and served as the program backbone. It was utilized to code the discrete model, to visualize the data, as well as to extract the statistics presented. The solution of the continuous part of the model was implemented in C due to its computational time-demanding nature. Also, the openMP library was used to perform the computations in parallel for additional speed up when using multicore CPUs.
Results and Discussion
The simulations were performed on a 2D regular grid of size
Parameter values.

The oxygen concentration was initially set to its maximum saturation value in the whole domain. A square of edge equal to 15 at the center of the grid was filled with tumor cells with probability equal to 0.7 for each point to be filled with a tumor cell. Thus, the initial cancer resides in a square on the center of the domain that is roughly 70% populated.
We investigate the effect of neighborhood selection on tumor evolution considering various distributions of the microenvironment.
We first assume a dynamic radial gradient arising from the distribution of oxygen that considers cells moving chemotactically toward higher oxygen concentrations.
We then explore a random distribution of the ECM where cells are encouraged to move haptotactically to denser areas of the matrix.
In order to quantitatively describe the morphology of the simulated tumors, several commonly applied metrics for the characterization of tumor pattern formation were used. Specifically, the normalized radial variance was applied to the first (i) above-mentioned scenario of radial symmetry, while the radius of gyration (gyradius) and roughness metrics were used in the second scenario (ii) of random distributions.12, 14, 30
Chemotactic movement to gradients of oxygen
In this set of experiments, it is assumed that cells move chemotactically directing their movement in response to oxygen concentration gradients. Taking into account the exact solution of Equation 2 under ideal circumstances (if the attractor consisted of round uniform radial gradients) and the fact that vascularization is homogeneous, the expected outcome is a round tumor. 24
In this scenario, cell positions are affected by oxygen gradients and oxygen concentrations are affected by cell positions. In practice, this adds a layer of interaction between the discrete and continuous components of the model. The parameters used in this set of experiments are as shown in Table 4. Furthermore, the proliferation time of tumor cells equals
To estimate the statistical significance of our results, 100 sets of experiments were executed. Random initializations were performed for the cancer cell population between the experiments as described in the previous subsection, while conserving the same initial state for each von Neumann and Moore set. The tumors were left to grow for 100 iterations, which corresponds to 1,600 fictitious hours (about 66.6 days).
The emerging tumor morphologies of the first set of experiments after 100 iterations can be seen in Figure 4 for the two different neighborhood schemes. Additionally, the growth of the tumor population over time can be seen in the two Supplementary chemotaxis videos, one for each neighborhood scheme. The corresponding oxygen distributions are also shown in Figure 5. The cells depicted with blue, green, and red color correspond, respectively, to proliferative, quiescent, and necrotic cancer cells. A proliferative rim of approximately 25 cells width is formed in both cases, while a few quiescent cells are sparsely distributed around the boundary that is formed between the proliferative and necrotic cells. Due to the increased oxygen demands by tumor cells, necrosis covers most of the tumor at the end of the experiment.

Results from the first set of 100 experiments, cancer cells after 100 iterations using the von Neumann and the Moore neighborhood at the left and the right column, respectively. The blue, green, and red cells denote living proliferative, living quiescent, and dead cancer cells, respectively.
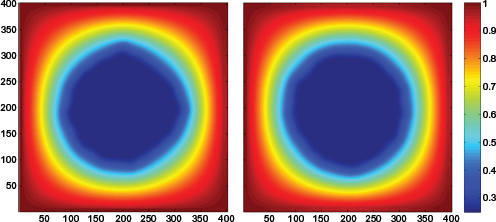
Results from the first set of 100 experiments, final Oxygen concentrations after 100 iterations using the von Neumann and the Moore neighborhood at the left and the right column, respectively.
In Figure 5, it can be seen that the selection of the neighborhood scheme affects the tumor morphology. In particular, the cells following the von Neumann scheme tend to form tumors of diamond shape, while the cells moving based on the Moore neighborhood form tumors that approximate a circular shape. Considering that the oxygen concentration is directly affected by the distribution of tumor cells (Equation 1), a similar pattern is also observed in the corresponding oxygen distributions as is shown in Figure 5. As expected, similar results are also produced when tumor cells are allowed to move chemotactically to a radially symmetric gradient similar to the oxygen concentration but remains invariant over time (results in Section 1 of Supplementary Material).
To quantify the difference between the two neighbor selections, we define the radial variance metric as the variance of the distance of a tumor cell from the center and normalized it by dividing with the total number of the cells. For this metric, the dead cells were also included. The normalized radial variance is thus defined as:


Mean normalized radial variance over time measured over the 100 sets of experiments for the two neighborhood schemes. The solid blue and green lines show the progression of the mean radial variance over time for the von Neumann and the Moore neighborhoods, respectively. The ranges created by the blue and green pairs of dashed lines contain the mean values if the radial variance plus and minus their standard deviations.

Number of live cells overtime measured over the 100 sets of experiments for the two neighborhood schemes. The solid blue and green lines show the growth curves for the von Neumann and the Moore neighborhoods, respectively. The ranges created by the blue and green pairs of dashed lines contain the mean of the of live cancer cells plus and minus their standard deviations.
In order to test the statistical significance of the differences, we first used D'Agostino–Pearson's
Haptotactic movement to gradients of random ECM
To demonstrate the effect of neighborhood selection in haptotactic movement, we assume that cells direct their movement in response to gradients of a random ECM. Various distributions of the ECM are considered as shown in Figure 8. In particular, the ECM distribution was created by drawing randomly pseudorandom values from the standard uniform distribution on the open interval (0,1) and smoothing the outcome through bilinear interpolation by a factor

The random extracellular environments after being smoothed by varying smoothing factors. The top concentration contains no smoothing (
Figure 9 illustrates the emerging tumor morphologies for the different distributions of ECM and the two different neighborhood schemes after 50 iterations (800 simulation hours). Figure 9 demonstrates the importance of ECM distribution on tumor evolution. As can be seen (Fig. 9, columns), smoother ECM distributions produce more compact tumors. Furthermore, movement based on different neighborhood schemes also produces substantially different tumor morphologies. It appears that allowing cells to additionally move toward its diagonal points causes them to follow paths and reach locations that they would not be able to access otherwise. As the ECM becomes smoother (bottom row of Fig. 8), the emerging tumor morphologies for the different neighbors become more similar with each other (bottom row of Fig. 9) indicating that under the specific conditions the two approximations coincide.

Final cancer cell distributions after 50 iterations. Blue cells are proliferating cancer cells and cells represented in green have entered the quiescent state. The von Neumann and the Moore results are shown in the left and the right columns, respectively. The first, second, and the third rows correspond to the various smoothing factor cases 1, 2, and 8.
To quantify the differences in spatial spread and invasive tumor morphology of the neighborhood schemes, the gyradius and the roughness metrics are introduced.12, 14, 30 The gyradius or radius of gyration is defined by:


Gyradius metric overtime. Blue, green, and red lines denote the
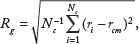
Roughness metric overtime. Blue, green, and red lines denote the

Tumor growth curves over time. Blue, green, and red lines denote the
It can be deduced that the importance of neighborhood selection is more evident as the distribution of the ECM becomes more rugged (top image of Fig. 8). As we have already mentioned, during the cellular migration process, a cell can only move to a neighborhood site that is empty. It is important to point out that the Moore neighborhood has twice the number of possible sites where a cell can move to comparing to the von Neumann neighborhood. When the ECM becomes harsh, this difference seems to play a significant role in tumor expansion allowing tumor cells to better sense and exploit their microenvironment and thus follow the free pathways around them.
It is evident that the Moore neighborhood relative to the von Neumann neighborhood, results in (i) faster tumor expansion as reflected in the time evolution of gyradius, (ii) increased morphological asymmetry in terms of tumor roughness, and (iii) increased viable tumor population as indicated by the growth curves.
Further experiments (results in Section 2 of Supplementary Material) also show that the differences in tumor growth and morphology between the two neighborhood schemes are enhanced under conditions that seem to promote invasion such as increased haptotactic coefficient and ECM degradation. However, it should be noted that an extensive investigation of the conditions under which the differences are more/less evident is important in order to examine more complex microenvironments and tumor cell responses. Also, the validation of the outcomes with real biological experiments is necessary for confirming these observations.
Statistical study of haptotactic movement
In order to verify the robustness of our outcomes as far as haptotaxis is concerned,

Mean values of gyradius over time. Dotted blue and green lines represent the mean populations for von Neumann and Moore, respectively. The ranges created by the blue and green pairs of dashed lines contain the mean values of the populations plus and minus their standard deviations.

Mean values of roughness over time. Dotted blue and green lines represent the mean populations for von Neumann and Moore, respectively. The ranges created by the blue and green pairs of dashed lines contain the mean values of the populations plus and minus their standard deviations.

Mean values of cancer populations over time. Dotted blue and green lines represent the mean populations for von Neumann and Moore, respectively. The ranges created by the blue and green pairs of dashed lines contain the mean values of the populations plus and minus their standard deviations.
To test if the results had a statistical significance, we followed the same procedure as we did with the chemotaxis results. We initially used the D'Agostino–Pearson's
In consistence with real tumor experiments that support linear growth of tumor diameter over time,31, 32 the mean gyradius of the von Neumann–and the Moore-based tumors both grow linearly with a slope of 0.81 and 2.52, respectively. The difference in slopes indicates that the Moore-based tumors exhibit greater expansion rate. In addition, the tumor roughness is increased for the Moore-driven tumors, which implies higher invasion than the von Neumann–driven tumors. It should be noted that contrary to the von Neumann neighbor, the Moore neighbor predicts an initial slower expansion rate followed by a more rapid radial expansion.
Furthermore, the mean values of the viable tumor cell populations show that the cells following the von Neumann scheme result in reduced populations when compared to their Moore counterparts. What is more, the populations appear to switch to lower growth rates than the one they begin with. However, the growth deceleration takes place at different time points per case, 10th and 23rd iteration for the Moore and the von Neumann, respectively. At these particular time points, the growth slows down because oxygen levels fall below the viable threshold and necrotic cells appear. One would expect that the compact morphology would cause the center of the tumor to run out of oxygen faster than the invasive morphology, which could allow the oxygen to diffuse further to the core between the tendrils. However, necrotic cells appear earlier in the aggressive morphology than in the compact. This can be explained if we account for the tumor cells in quiescent state, which, as discussed in section 2, have halved their oxygen consumption. If we sum the mean values for the proliferative populations and the half of the quiescent populations
Combining the knowledge from the gyration and roughness, it can be deducted that the major differences in the growth curves and morphologies can be attributed to the fact that the von Neumann–based tumors tend to grow in a condensed manner, which results in a tumor with many cells in quiescent state, while the Moore-based tumors tend to expand more easily adopting a tendril-like morphology with substantially less quiescent cells.
Conclusion
The emergence of the invasive behavior throughout tumor evolution is highly associated with a fatal outcome. For this reason, the invasive phase of tumor growth has been the focus of numerous studies in an effort to understand its underlying mechanisms and predict its emergence and characteristic patterns as tumor evolves destroying the surrounding host tissue microenvironment. Early prognosis and accurate predictions are of high significance in clinical practice and aid in the application of early and effective treatments.
In this work, a hybrid model for tumor invasion has been adopted 1 by combining a continuum description of the variables that comprise the tumor microenvironment with a rule-based stochastic cellular automata model of the cellular behavior on a 2D square lattice. An expansion of a cell movement mechanism was introduced, enabling the cells to move from von Neumann neighborhood to Moore neighborhood essentially doubling the possible locations to which a cell can move. Then, the impact of the neighborhood scheme selection in tumor cell movement, growth, and morphology was studied.
We first performed 100 sets of experiments within a chemotactic context where we assumed that cellular movement was directed by the gradients of oxygen distribution. Although a homogeneously vascularized tumor is assumed, as the tumor grows in size, the oxygen supply becomes inadequate for the increased metabolic demands of tumor cells, allowing areas of differentiated oxygenation to form within the tumor mass. Due to the radial symmetry of the problem, a tumor of circular shape is expected. With that in mind, in order to assess the distance between our results and the valid circular morphology, we adopted a simple radial variance measure. The results showed that utilizing the Moore neighborhood, the method yields simulations closer to the expected circular morphology. Thus, the inclusion of the diagonal points improved the resulting morphology, alleviating the computational artifacts presented by the previous von Neumann–based approach. Additionally, we showed that the neighborhood choice introduces statistically important differences in the cancer cells population.
Furthermore, haptotaxis has also been explored. The work of Anderson et al.
9
has shown that even when tumors comprise heterogeneous subpopulations when the ECM distribution is assumed homogeneous, a symmetric tumor is formed, whereas a random distribution of the ECM might be more realistic and allows the formation of invasive tumor morphologies similar to those observed in real tumors. Therefore, concentrations representing ECMs were initialized with random distributions, which were smoothed at a varying homogeneity degree. The Moore-based movement resulted in tumor cells with a tendency to follow the ECM paths much easier, thus expanding faster and forming tumor patterns that highly differ from the corresponding von Neumann–based ones, which are considerably more compact. Furthermore, the simulations also show that as the ECM distribution becomes less smooth, the difference between the two neighborhood schemes becomes more evident. To quantify these different tendencies, we used the gyradius and the roughness metrics. All in all, should the environment allow it, the cells equipped with the expanded Moore neighborhood tumor cells are more prone to invasiveness. Finally, the robustness of our outcomes for the random extracellular cases was verified. We performed 100 experiments for each neighborhood with varying ECM distributions but kept a stable smoothing factor. The evaluated gyradius, roughness, and cell populations of all the experiments were submitted to a
As cellular migration is critical for tumor growth and invasion, it stresses the importance to describe movement as adequately as possible. Cellular automata models on a regular lattice remain very popular due to their simplicity and direct relation with the continuum approaches, if the latter are solved using the finite-differences schema. Although lattice anisotropies arising from regular lattices can be circumvented by using random and isotropic lattices,14, 30 as well as by using off-lattice models,
12
we demonstrate in this work how a simple extension from von Neumann to Moore neighborhood in cell migration on a regular lattice can better approximate cellular motility by minimizing the artifacts arising from lattice anisotropies and how the neighborhood selection can significantly affect tumor growth and morphology. Our study also shows that the importance of neighborhood selection can be more evident under specific conditions such as increased hapto/chemotactic coefficient, harsher ECM distribution, and ECM degradation. An extensive exploration of various microenvironments and tumor behaviors with increasing complexity is required in order to better approximate real tumor patterns and reveal the conditions under which the differences between the movement approaches can become more/less evident. To this end, as real clinical cellular-level data of invasive tumors are hard to find and are difficult to control,
Author Contributions
All authors contributed to this work. Original idea and conception: GT, VS. Design of the experiments: ET, GT Writing of the manuscript: GT, ET, VS. Structure and arguments for the paper: GT, ET, VS. Critical revisions and approved final version: VS, KM.
Footnotes
Acknowledgment
The numerical solution of the continuous compartment was developed by Georgios Grekas.
Supplementary Materials
The importance of neighborhood scheme selection in agent-based tumor growth modeling–Sup.pdf