
Abstract
Epithelial-mesenchymal transition (EMT) is a physiological program that is activated during cancer cell invasion and metastasis. We show here that EMT-related processes are linked to a broad and conserved program of transcriptional alterations that are influenced by cell contact and adhesion. Using cultured human breast cancer and mouse mammary epithelial cells, we find that reduced cell density, conditions under which cell contact is reduced, leads to reduced expression of genes associated with mammary epithelial cell differentiation and increased expression of genes associated with breast cancer. We further find that treatment of cells with matrix metalloproteinase-3 (MMP-3), an inducer of EMT, interrupts a defined subset of cell contact-regulated genes, including genes encoding a variety of RNA splicing proteins known to regulate the expression of Rac1b, an activated splice isoform of Rac1 known to be a key mediator of MMP-3-induced EMT in breast, lung, and pancreas. These results provide new insights into how MMPs act in cancer progression and how loss of cell-cell interactions is a key step in the earliest stages of cancer development.
Keywords
Introduction
Epithelial-mesenchymal transition (EMT) is a physiological process that is critical for embryonic development and that plays an important role in wound healing and tissue morphogenesis, but which becomes activated during pathological conditions, including fibrosis and cancer.1–3 EMT is characterized by decreased adhesion to neighboring epithelial cells and the basement membrane, a specialized network of extracellular matrix (ECM) proteins that underlie epithelial tissues; increased association with interstitial ECM molecules; as well as increased cellular motility. Activation of EMT is associated with altered expression of many genes, including downregulation of epithelial markers, including E-cadherin and epithelial cytokeratins; upregulation of mesenchymal marker genes, including N-cadherin and vimentin; and altered expression of integrins and other molecules that associate with the ECM.4,5 In normal development, EMT is a process that is tightly choreographed so as to maintain the integrity of the epithelial sheet, proceeding through steps involving specification of the cells that will undergo EMT, followed by cellular extrusion in coordination with tissue morphogenesis to fill the gap, and then conversion of the extruded cell to the mesenchymal phenotype. In cancer, these processes become uncoordinated and chaotic, and are highly dependent upon the specific characteristics of the tumor microenvironment.
Cell culture models have proven to be useful for dissecting the signaling pathways that regulate EMT,1,6 and sophisticated model systems have been developed to determine how these pathways are integrated in normal tissues and in tumor progression. 7 MCF10A mammary epithelial cells have been used to investigate EMT pathways in premalignant cells, while MCF10A cells are immortal and they do not form tumors in immunocompromised mice and retain their ability to form growth-arrested, polarized mammary acini when grown in the basement membrane surrogate, Matrigel.8,9 However, MCF10A cells readily undergo EMT when exposed to transforming growth factor β (TGFβ),10–12 and have been found to exhibit many EMT-like changes when grown at low cell density: cells grown under sparse conditions on tissue culture plastic express higher levels of many mesenchymal markers, while cells grown under confluent conditions express higher levels of epithelial markers. 13 Induction of EMT-associated transcriptional changes has been observed in other cell lines as well, including the original bladder carcinoma cell model used as an EMT paradigm in early EMT publications. 14 However, the extent to which density-dependent alterations in MCF10A cells fully recapitulate the EMT program and how this process occurs remain unknown.
Many distinct signaling pathways affect the EMT program, and a theme that has emerged is that signals from soluble extracellular factors are integrated with contextual signaling processes for control of cellular phenotype.1,15,16 Among these extracellular molecules, matrix metalloproteinases (MMPs) have emerged as regulators of EMT through modulation of cell-cell and cell–ECM interactions.17–19 The activation of EMT by MMP-3 (stromelysin-1) has been the best characterized. MMP-3 is highly expressed in the mammary gland, where it functions to regulate branching morphogenesis and post-lactational involution.20,21 Transgenic expression of MMP-3 in mouse mammary glands stimulates development of fibrosis, followed by spontaneous tumor formation.22,23 Exposure of cultured mouse mammary epithelial cells to MMP-3 stimulates the EMT program through changes in cell morphology24–26 and cleavage of E-cadherin, 27 increased expression of the Rac1 splice isoform Rac1b, and consequent induction of cellular reactive oxygen species (ROS).28,29 In animal models and in human cancer, MMP-3/Rac1b-induced signaling has been found to lead to EMT, fibrosis, and cancer development in other organs as well, including the breast, lung, and pancreas.30–34
Here, we use transcriptional profiling to investigate the processes by which cell contact regulates EMT and how these processes are affected by exposure to MMP-3. We performed new experiments in which we assessed the effect of differential density in human MCF10A breast epithelial cells and the effect of differential density or exposure to MMP-3 in SCp2 mouse mammary epithelial cells. We found many similar patterns of gene expression in response to differing cell densities in human MCF10A breast epithelial cells and mouse SCp2 mammary epithelial cells, and further found that MMP-3 activates overlapping as well as independent pathways. We obtained evidence that alternative splicing of Rac1b is regulated both by cell density and by MMP-3 as a component of a broad regulation of EMT-associated splicing factors. These findings provide new insights into how the diverse signals from the microenvironment become integrated to facilitate the development of the tumor phenotype.
Materials and Methods
Cell culture
SCp2 nontumorigenic mouse mammary epithelial cells, containing tetracycline-regulated, autoactivated MMP-3 construct, were cultured and used as described previously.28,29,35 The cells were grown in DMEM/F12 (Gibco) supplemented with 2% Tet system approved FBS (Clontech), 0.4 mg/mL G418 sulfate (CellGro), 50 μg/mL gentamicin (Gibco), and 5 μg/mL human recombinant insulin (Gibco). MCF10A cells were grown in DMEM/F12 (Gibco), supplemented with 5% horse serum (Gibco), 20 ng/mL EGF (PeproTech), 0.5 μg/mL hydrocortisone (Sigma), 100 ng/mL cholera toxin (Sigma), 10 μg/mL insulin (Sigma), and 100 μg/mL gentamicin (Gibco) and maintained as described previously. 8
Transcriptional analysis by microarray
SCp2 cells were plated in six-well plates at the indicated densities and grown either in the presence or absence of MMP-3. After 72 hours, the cells were lysed in TRIzol (Invitrogen), and RNA was isolated according to the manufacturer's instructions. The experiment was performed once at seeding densities of 25K, 50K, 100K, and 200K per well, and replicated for seeding densities of 50K, 100K, and 200K; results are presented as single replicates for 25K and with averaged replicates for 50K, 100K, and 200K. Transcriptional profiles were obtained using Affymetrix mouse 430_2 gene expression chips with data analyzed and processed as described previously. 36 MCF10A cells were plated in six-well plates at indicated densities with single replicates and lysed in TRIzol after 48 hours. RNA was assessed with Affymetrix human U133_Plus_2 gene expression chips. Transcriptional profiles have been deposited in Gene Expression Omnibus. Gene expression data were processed and analyzed using Gene-Spring 13.0. Differentially expressed genes in the MCF10A dataset (n = 3108) were identified as FC > 2.0 in 800K density vs 50K density. Differentially expressed genes (n = 7056) in the SCp2 dataset were identified as FC > 2 in any of 50K control vs 50K MMP-3, 250K control vs 250K MMP-3, or 50K control vs 250K control. K-means clustering was performed on the SCp2 differentially regulated gene set using eight groups, Pearson-centered similarity measure, and 1000 iterations. Meta-analysis was performed using the NextBio platform 37 as described previously. 38 Gene expression profiles have been deposited in the Gene Expression Omnibus. (GSE63354 is the superseries containing all expression data; GSE63331 is the SCp2-only subseries and GSE63353 is the MCF10A -only subseries.)
Real-time quantitative PCR
RNA was isolated using TRIzol reagent according to the manufacturer's instructions. cDNA was synthesized with MultiScribe reverse transcriptase (Applied Biosystems). Gene expression levels were assayed by real-time quantitative PCR (RT-qPCR) using 7900HT Fast Real-Time PCR System (Applied Biosystems). TaqMan probes for specific genes (human vimentin Hs00185584_m1, human N-cadherin HS00169953_m1, human E-cadherin Hs00170423_m1, human GAPDH Hs99999905_m1) were purchased from Applied Biosystems. Custom primers and reporter probes were used for human and mouse Rac1b and for mouse GAPDH (human Rac1b: forward primer 5′-TATGACAGATTACGCCCCCTATC-3′, reverse primer 5′-CTTTGCCCCGGGAGGTTA-3′, and probe 5′-AAA-CGTACGGTAAGGAT-3′; mouse Rac1b: forward primer 5′-TGGACAAGAAGATTATGACAGATTGC-3′, reverse primer 5′-CCCTGGAGGGTCTATCTTTACCA-3′, and probe 5′-CCGCAGACAGTTGGAGA-3′; and mouse GAPDH: forward primer 5′-GTGTCCGTCGTGGATC-TGA-3′, reverse primer 5′-GCTTCACCACCTTCTTGAT-GTCAT-3′, and probe 5′-CTTGGCAGGTTTCTCC-3′). All assays were performed in triplicate, and analysis was performed using RQ Manager software (Applied Biosystems) and the 2−ΔΔt method to obtain relative quantitation (RQ) values, with GAPDH used as endogenous control.
Phase contrast microscopy and cell area quantification
Phase contrast images of cells were acquired prior to their lysis in TRIzol, using Olympus IX51 microscope, equipped with Olympus objectives (UPlanFLN 10x NA 0.3, LUCPlanFLN 20X NA 0.45) and an Olympus DP72 camera. Projected cell areas were determined using ImageJ software 39 by manually outlining cells. At least 40 cells were measured per condition. Graphs represent average cell area with error bars showing standard error of the mean (SEM).
Results
Cell density controls extensive transcriptional programs in MCF10A cells
To determine how gradual differences in MCF10A cell density affected patterns of gene expression, cells were plated in 35-mm plates at 50K, 100K, 200K, 400K, 600K, and 800K cells per dish, and then cultured for 24 hours (Fig. 1A). Image analysis of cell morphology for these conditions (Fig. 1B) revealed that while the cells were more spread at the lowest densities, the differences between the higher densities were smaller. MCF10A cells are known to show differential expression of EMT marker genes depending on whether the cells are cultured under sparse or confluent conditions,13,40 and we also found differential expression of EMT markers, with progressively increasing mRNA levels of the epithelial marker E-cadherin (Fig. 1C) and progressively decreasing mRNA levels of the mesenchymal markers N-cadherin (Fig. 1D) and vimentin (Fig. 1E) at higher cell densities throughout the density range.

Regulation of EMT characteristics by cell density in MCF10A cells. (
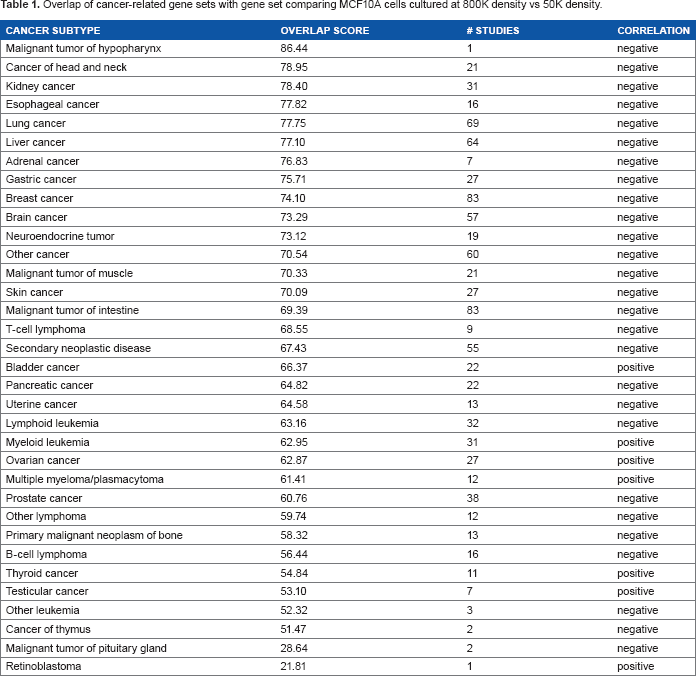
Transcriptional profiling of the MCF10A cells identified a large number of genes that were substantially regulated by cell density: 1444 probes (mapped to 1131 genes) were upregulated more than two-fold in 800K density relative to 50K density (Fig. 2A and B) and 1658 probes (mapped to 1303 genes) were downregulated more than two-fold in 800K density relative to 50K density (Fig. 2C and D). Meta-analysis of the MCF10A gene set using the NextBio platform revealed significant overlap with numerous cancer-associated datasets (Table 1), including lung cancer, liver cancer, and breast cancer. The negative association of the MCF10A dataset (comparing 800K density vs 50K density) with most cancer datasets indicates that lower cell density is more associated with cancer as compared with the normal tissue. Examination of overlap with individual datasets (Table 2) revealed significant negative correlation between the MCF10A dataset and gene sets comparing breast cancer vs normal breast tissue,41–46 particularly when the breast cancers were of the basal molecular subtype. This finding suggests that the MCF10A cells, which are immortal and nontransformed but which are classified as basal-type breast cancer cells,13,47 activate basal-type cancer characteristics at lower cell densities. The MCF10A dataset also showed significant negative overlap with comparisons of breast cancer cell lines, including MCF10A cells expressing activated ErbB2 vs control vector, 48 the transformed MDA-MB-231, MCF-7 and T47D breast cancer cell lines vs MCF10A cells, 49 and the MDA-MB-231 cells vs M98040 normal breast cells. 50 With regard to the highly significant overlap (P = 1.9E - 184) with the dataset comparing MDA-MB-231 cells vs MCF10A cells, it was striking that the majority of the 2385 overlapping gene features showed a negative correlation (Fig. 2E), indicating that more than 2/3 of the transcriptional alterations induced by low density cultivation of MCF10A cells overlapped significantly with MDA-MB-231 cells. Comparison of the dataset of density-dependent gene expression changes in MCF10Acells with clinical datasets examining differences between breast cancers of different intrinsic subtypes identified significant overlap with four datasets comparing basal subtype breast cancers with normal breast tissue (Supplementary Fig. 1A, P = 1.6E - 65, ref. 42 ; Supplementary Fig. 1B, P = 15.0E - 63, ref. 51 ; Supplementary Fig. 1C, P = 1.2E - 28, ref. 52 ; and Supplementary Fig. 1D, P = 1.6E - 48, ref. 53 ). We also identified significant overlap with a dataset comparing basal subtype breast cancer vs normal subtype breast cancer (Supplementary Fig. 1E, P = 2.2E - 25, ref. 52 ), and another dataset comparing breast cancer cell lines of the basal B subtype vs basal A subtype (Supplementary Fig. 1F, P = 3.7E - 54, ref. 54 ). The direction of association indicates that MCF10A cells plated at low density manifest an increasing association with basal subtype breast cancer.

Analysis of genes differentially expressed by density in MCF10A cells. (
Overlap of cancer-related gene sets with gene set comparing MCF10A cells cultured at 800K density vs 50K density.
Meta-analysis reveals overlap of gene set comparing MCF10A cells cultured at 800K density vs 50K density with studies of breast cancer, breast cancer cell lines, cellular differentiation, and EMT.
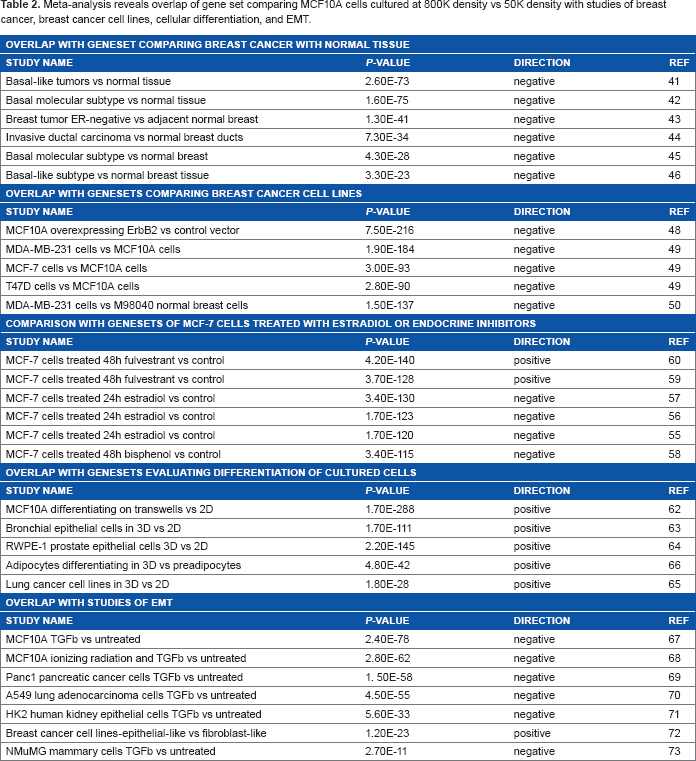
The MCF10A dataset showed significant negative overlap with datasets comparing MCF-7 breast cancer cells treated with estradiol55–57 or the estrogenic compound bisphenol, 58 and significant positive overlap with MCF-7 cells treated with the estrogen receptor (ER) downregulator fulvestrant,59,60 consistent with the identification of EMT-inducing characteristics of estrogen signaling in the ER-positive MCF-7 cell line. 61 The MCF10A dataset also showed significant positive overlap with datasets comparing cell lines cultured under differentiating conditions, including MCF10A cells cultured on transwells vs tissue culture plastic 62 (P = 1.7E - 288, with 2106 overlapping gene features; Fig. 2F), bronchial epithelial cells, RWPE-1 prostate epithelial cells, or lung cancer cell lines cultured in 3D Matrigel vs tissue culture plastic,63–65 and cultured adipocytes compared with preadipocytes. 66 Similar strong overlap was found between the MCF10A dataset and gene sets from experiments examining transcriptional changes induced by EMT.67–73 These findings indicate that cell density affects extensive transcriptional programs associated with malignancy, differentiation, and EMT in MCF10A cells.
Cell density and MMP-3 control overlapping transcriptional programs in SCp2 cells
To dissect the differential effects of cell density and external stimuli on induction of EMT, we cultured SCp2 mouse mammary epithelial cells at differing densities with MMP-3 (Fig. 3). Because MMP-3-induced EMT requires cell spreading, 25 we selected a range of cell densities that would allow for sufficient cell spreading at even the highest seeding density (Fig. 3). Evaluation of transcriptional profiles identified 7056 genes that were more than two-fold differentially expressed in response to MMP-3 (50K control vs 50K MMP-3 and 250K control vs 250K MMP-3) or in response to cell density (250K control vs 50K control). To begin to dissect the differential signaling pathways activated in response to cell density and MMP-3, transcriptional profiles of these differentially expressed genes were clustered using a K-means algorithm into eight groups (Fig. 4). We initially assessed K-means classification into 2, 4, 8, and 12 clusters. One of the endpoints we wished to pursue was the meta-analysis using NextBio, and we found that the classification into eight groups provided the most manageable number of genes for analysis using this utility. In the first two groups (Fig. 4A and B), genes showed regulation by both cell density and by MMP-3. These groups were enriched with genes associated with cell-cell and cell-ECM adhesion and interaction (Table 1, Supplementary Tables 1–3), including the gene encoding C/EBPβ, a key regulator of epithelial cell differentiation and proliferation in mammary branching morphogenesis74,75 and in the morphogenic response to epimorphin in mammary epithelial cells,76–80 as well as the gene encoding the connective tissue growth factor (CTGF), a key regulator of EMT and a mediator of the earliest stages of breast cancer development.81–83 In the second two groups (Fig. 4C and D), gene expression differences were primarily associated with cell density and less affected by the presence or absence of MMP-3. These groups were enriched with genes associated with cellular biogenesis and metabolic processes (Table 1, Supplementary Tables 1–3), including the gene encoding RAB40B, which trafficks MMPs to the invadopodia during breast cancer cell invasion, and the gene encoding SERPINB2/PAI2, which regulates cellular interactions with the ECM.84,85 The third set of gene expression groups included genes that were primarily regulated by MMP-3 (Fig. 4E and F). These groups were enriched with genes associated with cell division and organization (Table 1, Supplementary Tables 1–3), including genes known to be regulated by MMP-3. 35 Comparison of the set of genes regulated by density in MCF10A cells showed significant overlap with subgroups A–F, with expected directionality of correlation: positive for clusters A–D and negative for clusters E and F (Supplementary Fig. 2). No significant overlap was found between the genes regulated by density in MCF10A cells and clusters G and H (data not shown).

Effects of MMP-3 treatment on SCp2 mouse mammary epithelial cells cultured at different cell densities. Either 50K (top row), 100K (middle row), or 250K (bottom row) SCp2 cells were plated in 35-mm plates, and then treated as controls (left column) or with MMP-3 (middle column). Cell area measurements indicate significantly increased cell spreading with MMP-3 treatment at all three densities (right column). Scale bars, 250 μm in large views and 50 μm in insets.

Clustering of genes differentially regulated by density and by MMP-3 treatment in SCp2 cells. (
Regulation of Rac1b splicing by cell density and MMP-3
The final two gene groups identified by the K-means clustering contained genes that were regulated by density in the absence of MMP-3, but less regulated by density in the presence of MMP-3 (Fig. 4G and H), an effect that could be induced if the protein(s) acting as sensors of cellular density for regulation of these genes was cleaved or blocked by MMP-3. These groups were enriched with genes encoding splicing factors (Table 1, Supplementary Tables 1–3). Evaluation of genes with these characteristics and annotated as associated with RNA processing revealed 56 gene features (mapped to 37 genes) that were upregulated by cell density in the absence of MMP-3 (Fig. 5A–C) and 80 gene features (mapped to 56 genes) that were downregulated by cell density in the absence of MMP-3 (Fig. 5D–F). Strikingly, these genes included HNRNPA1, which encodes a splicing factor that inhibits EMT86,87 and that is known to regulate the induction of Rac1b in mouse mammary and lung epithelial cells exposed to MMP-3.32,88 Analysis of HNRNPA1 expression data in the SCp2 cell experiments revealed substantial density-dependent differences in untreated cells, but relatively similar levels in MMP-3-treated cells (Fig. 6A). Consistent with the role of hnRNPA1 as a repressor of exon 3b inclusion, 88 expression of Rac1b in the same samples decreased in the untreated samples as a function of density, while the levels of MMP-3-induced Rac1b remained constant (Fig. 6B). Other splicing factors contained in the density-regulated/MMP-inhibited gene clusters have been implicated in other studies to influence Rac1b inclusion, including SRSF1 (ASF/SF2), which acts to increase inclusion of exon 3b 89 and which was downregulated by density in the absence of MMP-3, but maintained higher expression levels in the presence of MMP-3 (Fig. 5E). Furthermore, while expression levels of HNRNPA1 were undetectable in the MCF10A cells (data not shown), we did find that density-dependent differences in the expression of ESRP1 and ESRP2 (Fig. 6C), which encode splicing factors that have been shown to regulate exon 3b inclusion in human oral squamous carcinoma cells, 90 were also associated with density-dependent differences in the expression of Rac1b (Fig. 6D).

Enrichment of mRNA processing genes in clusters of genes regulated by only density in the absence of MMP-3. (

Density-dependent differences in expression of gene splicing factors and Rac1b in SCp2 and MCF10A cells. (
Discussion
Here we showed that the regulation of the EMT program by cell contact is a highly conserved process, with many similar transcriptional alterations found in mouse and human cells cultured at differing cell densities (Supplemental Fig. 1). We also found that the density-dependent, EMT-associated changes were a component of a larger cancer-related gene program, as cultivation of MCF10A human breast epithelial cells at low density activated many of the transcriptional features of breast cancer, while cultivation at high density activated transcriptional features of differentiated cells (Fig. 2E and F, Tables 1 and 2). We found that cell density and MMP-3 affected distinct transcriptional alterations in SCp2 mouse mammary cells (Fig. 4C–F) and regulated others in tandem (Fig. 4A and B). We also made the unexpected findings that MMP-3 treatment affects the transcription of a cluster of genes that is regulated by cell density (Fig. 4G and H) and that this cluster is enriched in genes encoding RNA processing proteins (Fig. 5, Table 3, Supplemental Tables 1–3), including the RNA splicing factors that regulate expression of Rac1b, the key mediator of MMP-3-induced EMT, under the same conditions (Fig. 6). These results provide insights into the common processes by which cell contact affects cellular phenotype and sensitivity to induction of EMT and how these processes may be integrated in the development of breast cancer.

Alternative splicing allows individual genes to take on multiple, often opposing, functions.91,92 Differential regulation of splice isoform expression of many genes is a feature of cancer development and progression, as cancer cells preferentially express many different splice isoforms that can block anticancer apoptotic mechanisms, drive glycolytic metabolism, induce angiogenesis, and stimulate invasion through induction of EMT.91,93,94 While some cancer-associated mutations have been found to directly affect the expression of physiologically relevant splice isoforms, the majority of alternative splicing events in cancer are because of alterations in the splicing process itself. 92 Splicing is controlled through the action of the spliceosome, a large ribonucleoprotein (RNP) complex that selects which pre-mRNA sequences will be retained or excluded. The classical regulators of alternative splicing include the serine/arginine-rich (SR) proteins, which generally promote exon inclusion, and the heterogeneous RNPs (hnRNPSs), which generally promote exon exclusion. 91 Of the SR proteins, ESRP1/2 have been a particular target of study for their role in facilitating the EMT program 95 : differential activity of ESRP1/2 affects EMT through alternative splicing of FGFR1, 96 hMena,97,98 p120-catenin, 96 fibronectin, 95 and Rac1b.89,90,99–101 Of the hnRNP proteins, hnRNPA1 has been focused on as a mediator of EMT processes 87 and has been identified as specifically involved in the regulation of Rac1b by MMP-3. 88 We found here that cell contact regulated ESRP1/2 and hnRNPA1 expression in MCF10A and SCp2 cells, and that this regulation was affected by the presence of MMP-3 (Fig. 6). We also identified a number of other genes encoding RNA processing proteins whose expression was regulated by cell density and by MMP-3 (Figs. 4G, H and 5). How differences in cell density affect these processes, and the role of MMP-3 in their abrogation, is unclear. Differences in cell density and exposure to MMP-3-containing conditioned media have been previously observed to regulate alternative splicing of the fibronectin mRNA in SCp2 cells, 102 which supports the idea that the effects observed here may reflect a larger phenomenon. Additionally, cell density has been found to control nonsense-mediated decay of the splicing factor ASF/SF2 (SRSF1), 103 although whether this process is regulating the observed differences in splicing factors contained in clusters G and H (Figs. 4G, H and 5) is unknown.
Rac1, like other members of the Ras superfamily, is a GTPase that cycles between a GDP-bound inactive form and a GTP-bound active form. Rac1b was originally identified in colorectal and breast tumors as an alternatively spliced transcript containing the 57-nucleotide exon 3b, resulting in a 19-amino acid in-frame insertion in the Rac1b protein sequence. 104 Rac1b was found to have greatly reduced intrinsic GTPase activity and accelerated GDP–GTP exchange; the 19-amino acid insertion also led to altered association with Rac1 effector proteins.105–107 Rac1b was subsequently identified as a critical effector of MMP-3-induced EMT in SCp2 cells: MMP-3-induced Rac1b induces elevated levels of cellular ROS, which drive EMT and genomic instability. 3,28,29,108 Further studies have revealed MMP-3-induced Rac1b and consequent EMT processes in lung and pancreas as well.30,32–34,109 In addition to the expected upregulation of Rac1b by MMP-3 in the SCp2 cells, we also found that Rac1b was upregulated at lower cell density in both the SCp2 and the MCF10A cells (Fig. 6B and D), conditions under which the MCF10A cells showed strong overlap with breast cancer cell lines and tumor biopsies (Table 2). These results support the possibility of inhibition of Rac1b as a therapeutic approach for breast cancer. 110 EHT164 is an inhibitor of Rac1 family of GTPases that has selectivity toward Rac1b111,112 and that has been found to inhibit estrogen-dependent breast cancer cell proliferation in culture models, 113 although the effects of this compound in clinical settings remain to be evaluated.
In summary, we have found that cell contact regulates a broad transcriptional program that is conserved between mouse and man and that is highly relevant to the transition from the differentiated state to malignancy. We also found that MMP-3 induces EMT by interfering with the density-dependent regulation, causing the cells to retain their cancer-like transcriptional state even at higher cell density. These results point toward loss of cell contact as a critical step in the activation of the EMT program in the development of breast cancer.
Author Contributions
Conceived and designed the experiments: MAC, DCR. Analyzed the data: MAC, DCR. Wrote the first draft of the manuscript: MAC, DCR. Contributed to the writing of the manuscript: MAC, CMN, DCR. Agree with manuscript results and conclusions: MAC, CMN, DCR. Jointly developed the structure and arguments for the paper: MAC, CMN, DCR. Made critical revisions and approved the final version: MAC, CMN, DCR. All authors reviewed and approved of the final manuscript.
Supplementary Materials
Supplementary Table 1
Broad MSigDB - Canonical Pathways for SCp2 cell experiment.
Supplementary Table 2
Broad MSigDB - Regulatory Motifs for SCp2 cell experiment.
Supplementary Table 3
Gene Ontology (GO) for SCp2 cell experiment.
Supplementary Figure 1
Meta-analysis of datasets showing overlap of density-dependent gene expression changes in MCF10A cells with biosets comparing breast cancer of basal subtype vs other subtypes. In each panel, Bioset 1 is the list of genes upregulated or downregulated more than two-fold in cells cultured at 800K density vs 50K density (n = 3102 features mapped to 2434 genes). (
Supplementary Figure 2
Overlap of genes regulated by density in MCF10A and by MMP-3 in SCp2 cells. Significant overlap of genes upregulated in MCF10A cells at 800K vs 50K (left column) or genes downregulated in MCF10A cells at 800K vs 50K (right column) with genes regulated by both density and MMP-3 (top row; comparison shown for genes regulated in 50K control vs 50K MMP-3), with genes regulated primarily by density (middle row; comparison shown for genes regulated in 250K control vs 50K control), and with genes regulated primarily by MMP-3 (bottom row; comparison shown for genes regulated in 50K control vs 50K MMP-3).