
Abstract
Subnetwork detection is often used with differential expression analysis to identify modules or pathways associated with a disease or condition. Many computational methods are available for subnetwork analysis. Here, we compare the results of eight methods: simulated annealing-based jActiveModules, greedy search-based jActiveModules, DEGAS, BioNet, NetBox, ClustEx, OptDis, and NetWalker. These methods represent distinctly different computational strategies and are among the most widely used. Each of these methods was used to analyze gene expression data consisting of paired tumor and normal samples from 50 breast cancer patients. While the number of genes/proteins and protein interactions detected by the eight methods vary widely, a core set of 60 genes and 50 interactions was found to be shared by the subnetworks identified by five or more of the methods. Within the core set, 12 genes were found to be known breast cancer genes.
Introduction
With the advent of high-throughput measurements in biotechnology, cancer biologists are able to dissect the complicated pathology of cancers from multiple directions. These measured molecular profiles include genetic mutations, copy number variance, messenger RNA (mRNA) expression, microRNA expression, DNA methylation, protein abundance, etc. 1 However, multidimensional data also bring a tremendous challenge to the computational biology community. What can these data tell us about cancer? Differential analysis is a straightforward method in which differences in the molecular profiles of tumor and normal cells are identified. These analyses rely on a large number of samples and result in the identification of thousands of differences in molecular profiles. How to interpret these molecular variations as a whole is still under investigation.
Alternatively, molecular interaction data have shown powerful potential for connecting isolated molecular variations into a meaningful framework. These analyses usually start with differential analysis of molecular profiles, eg, differential gene expression, and score the extent of the difference for each gene. Next, biological network data that indicate the association of genes are collected, and then the scores are overlaid on the network. Now the task is to extract a subset of the network, ie, a subnetwork of the global network, such that the subnetwork is as small as possible while connecting as many highly scored genes as possible. This subnetwork enriched in differentially expressed genes can be used to discover, for example, that the upregulation of one gene is caused by the overexpression of its upstream regulator or dysfunction of its suppressor.
Subnetwork detection is a crucial analysis since it is capable of linking multiple individual molecular variations into an insightful wiring diagram showing how one individual variation is related to the others. Many methods for subnetwork detection have been developed. In 2002, Ideker et al first proposed a computational model for subnetwork detection based on simulated annealing. 2 They also proved that subnetwork detection is an NP-Hard problem. 2 As reviewed by Mitra et al. 3 , many attempts have been made during recent the decade to solve this problem efficiently using approximation algorithms. Due to the diversity of subnetwork scoring functions used by the different approximation algorithms, it is unlikely that different programs will obtain identical or even very similar subnetworks given the same expression and network data.
In this study, we propose a pipeline to comprehensively evaluate the performance of subnetwork detection methods from multiple aspects. We first select eight methods and assess them equally using an authoritative data set of breast cancer from The Cancer Genome Atlas (TCGA). 1 Then we perform a differential expression analysis using DESeq 4 and score the significance of expression change for each gene. Next, we extract subnetworks using the eight methods and compare their outputs based on their coverage of significant genes, network modularity, mutual similarities, and functional enrichment. Finally, we compare their computational costs, user friendliness, and discuss their strengths and weaknesses, respectively.
Results
Overview of Subnetwork Detection Methods
Over 40 computational models have been developed during the past decade based on various algorithms, as reviewed by Mitra et al. 3 , and Berger et al. 5 We selected eight of them (Table 1) for further comprehensive assessment based on the following three rules. First, the input of the models must be a network, and an expression set or a list of gene weights based on the expression. The models were ruled out if they required genetic mutation data or integration of co-expression data. Second, the selected models must be accessible either with open source code or a well-maintained online Graphical User Interface (GUI). Third, the selected models must represent diversity of methodology, and similar or integrative models are excluded. We summarize the eight selected methods and discuss their advantages and limitations in Table 2.
Overview of eight methods.

Performance summary of the eight methods.

In order to perform a fair assessment, we kept the input data of the eight models as similar as possible (see Table 1). On one hand, we used the protein-protein interaction network from Human Protein Reference Database (HPRD)
6
as model input if there is no preloaded network data in the models. On the other hand, if the models used their preloaded networks and output a subnetwork including genes not in the HPRD network, we pruned them from the subnetwork. In terms of expression data, we first utilized DESeq to normalize the raw counts of mRNA sequencing from TCGA breast carcinoma data set. Then we performed differential expression analysis across the 50 case and 50 control samples and assigned each gene an adjusted
Assessment of Subnetwork Quality
We assess the quality of subnetworks output by the eight methods from two aspects: coverage of significant genes and network modularity. First, we prepared volcano plots with log2(fold change) versus −log10(

Volcano plots of differential gene expression showing −log10 of the
To further examine the specificity and sensitivity of significant gene coverage of each method, we label each detected gene as a positive sample for each method and examined whether the expression
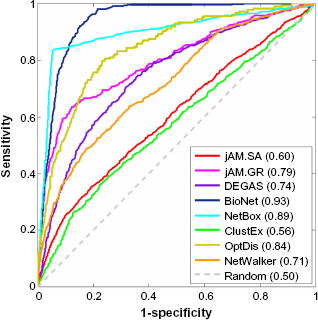
ROC curves of −log10 of the
To examine modularity of the eight subnetworks, we used two different measures: Global Clustering Coefficient (GCC) 9 and Cut-Based Ratio (CBR). 10 GCC measures how close a subnetwork is to a completely connected graph. And CBR measures the degree to which a subnetwork consists of more edges between nodes within the subnetwork and fewer edges between nodes inside and outside the subnetwork. Both modularity scores were scaled to the interval [0, 1] by dividing by the maximum quantities (Fig. 3). We can see that the OptDis subnetwork has the highest GCC, probably because there are many small (3 to 5 genes) fully connected modules in the subnetwork. In contrast, the ClustEx subnetwork has the highest CBR, probably due to the hierarchical clustering step used before growing the subnetwork within the clusters. The subnetworks of jAM.GR and DEGAS have moderately high modularity scores; both methods search for subnetworks using greedy strategies.

Modularity of the eight subnetworks
Cross-Model Comparison and Functional Analysis of Subnetworks
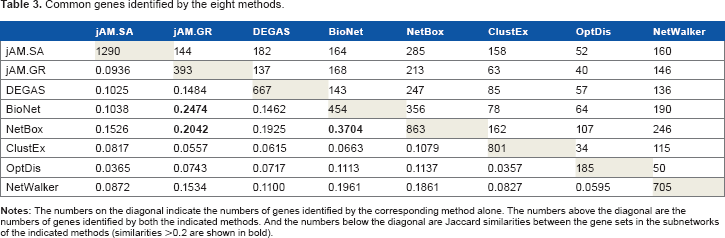
To investigate the similarity of the eight output subnetworks detected by the different methods, we first performed a pairwise comparison of the subnetworks using Jaccard similarity, in terms of nodes (Table 3) and interactions (Table 4). Surprisingly, it was found that the subnetworks of BioNet and NetBox were the most similar even though they used different subnetwork detection strategies. Methods using similar subnetwork detection algorithms have moderate similarities in their output subnetworks, such as jAM.GR and DEGAS. In contrast, methods with the same input expression and network data often detect very dissimilar subnetworks, for instance DEGAS and OptDis, and NetBox and ClustEx. The pairwise similarities of the subnetworks suggest that the use of similar algorithms and/or similar input data do not guarantee a similar output. This is because the different methods use different objective functions to evaluate a subnetwork in optimization.
Common genes identified by the eight methods.
Common interactions identifed by the eight methods.

We tested whether the detected subnetworks contain putative breast cancer genes. First, we collected 462 breast cancer genes from the KEGG Orthology Based Annotation System (KOBAS) version 2.011 functional enrichment list, which integrates Online Mendelian Inheritance in Man (OMIM), 12 KEGG DISEASE, 7 Functional Disease Ontology (FunDO), 13 Genetic Association Database (GAD), 14 and the National Human Genome Research Institute (NHGRI) Genome-Wide Association Studies (GWAS) Catalog 15 disease databases. With those 462 genes as ground truth, we calculated the precision and recall of each of the eight subnetworks (Fig. 4) and found that the top subnetworks in identifying the true breast cancer genes are those produced by BioNet, NetWalker, NetBox, and jAM.GR. Surprisingly, these four methods use totally different algorithms for subnetwork detection (see Table 1). And NetWalker displayed its potential for predicting true disease genes, even though its coverage of significantly differentially expressed genes was relatively poor; this may be due to its use of random walks to diffuse information through the whole network without any restriction to shortest paths and greedy search.
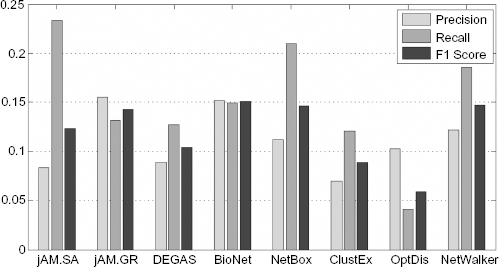
Prediction of the 462 breast cancer genes by the eight subnetworks. F1 score is defined as 2 × precision × recall/(precision + recall)
Then we used the list of true breast cancer genes to investigate if cancer-related genes are more likely to be detected by multiple methods. The distribution of all genes and the breast cancer genes is shown in Figure 5A in terms of how many different methods detect genes in these classes. We can see in Figure 5A that many genes are detected by only a few methods, whereas a small number of genes are detected by almost every method. Surprisingly, the percentage of breast cancer genes in the reported subnetworks increases with the number of methods detecting those genes, suggesting that the genes detected by more methods are more likely to be a true breast cancer genes. And also it suggests that an ensemble method that integrates multiple methods may be a better way of detecting subnetworks covering more disease genes. Similarly, we collected 2,058 interactions enriched in breast cancer pathways using KOBAS 2.0 from the KEGG pathway, 7 Pathway Interaction Database (PID), 16 BioCarta, 17 Reactome, 18 BioCyc, 19 and Protein ANalysis THrough Evolutionary Relationships (PANTHER) 20 databases. The distribution of interactions in terms of the number of methods detecting those interactions is shown in Figure 5B. We found that no interactions were commonly detected by more than six methods. The interactions commonly detected by more methods are slightly more likely to be enriched in pathways related to breast cancer.

Number of methods detecting genes and interactions in subnetworks. Histograms of the number of genes (
To examine functional enrichment of commonly detected genes, we used KOBAS to annotate the 553 genes detected by at least three methods (Supplementary Table 1). The top enriched KEGG pathways of these genes are cell cycle (hsa04110), MicroRNAs in cancer (hsa05206), and Pathways in cancer (hsa05200), all with the corrected
Finally, we used Cytoscape 3.021 to visualize a prominent subnetwork in which each interaction is detected by at least five methods. This subnetwork consists of 60 genes and 50 interactions (Fig. 6). Within those 60 genes, there are 12 true breast cancer genes (red border) detected by KOBAS 2.0 in the multiple databases. Notably, the breast cancer gene Nuclear Receptor Subfamily 3, Group C, Member 2 (NR3C2), a gene encoding the mineralocorticoid receptor, was the only gene detected by all the eight methods. An RNA interference (RNAi) experiment has verified that the depletion of NR3C2 increases cell death in breast. 22 This evidence is consistent with Figure 6 in which NR3C2 is downregulated in breast cancer cells (log2(fold change) = −2.2). We also found that actin alpha 1 (ACTA1), one of the interactors of NR3C2, was detected by five methods and was downregulated as well. ACTA1 is a highly conserved protein responsible for cell motility and a major constituent of the contractile apparatus. 23 This suggests that downregulation of ACTA1 causes increased cell motility and cancer metastasis. Similarly, inhibin, beta A (INHBA), pleiotrophin (PTN), and seven in absentia homolog family E3 (siah E3) ubiquitin protein ligase 2 (SIAH2), which were detected by seven methods, have been experimentally verified to be associated with breast cancer development. Overexpression of INHBA in mesenchymal cells increases colony formation potential of breast epithelial cells. 24 PTN, a secretory cytokine, has been found to stimulate breast cancer progression through remodeling of the tumor microenvironment. 25 Downregulation of SIAH2 has been found to be associated with resistance to endocrine therapy in breast cancer. 26
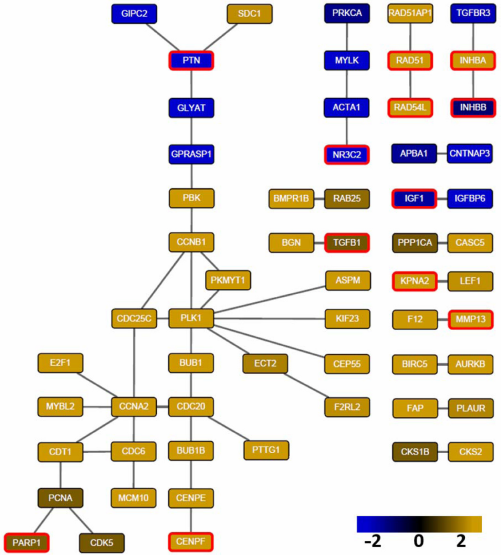
Prominent subnetwork whose interactions are detected by at least five methods. Node color indicates log2 fold change of differential expression (yellow: upregulated in tumor samples; blue: downregulated in tumor samples). The 12 genes in red border are in the list of 462 known breast cancer genes. Visualized by cytoscape 3.0 version6.
Conclusion
We have performed a comprehensive assessment of a broad spectrum of state-of-the-art methods for subnetwork detection using up-to-date gene expression data specific for breast cancer. The key findings in this study can be summarized in the following three main points.
First, based on the functional enrichment analysis, the subnetworks detected by the individual methods offer only limited information on breast cancer pathology. However, the prominent subnetwork detected by the majority of the methods offers a very specific and relevant result that is clearly related to breast cancer pathology. The data used here are probably as good as or better than what is currently available for most kinds of tumors and are therefore representative of typical situations. Even though each of the eight methods were claimed to be effective in their original publications, based on the data sets they used, the subnetwork detection problem still cannot be considered to be solved and needs further investigation.
Second, the enrichment in known breast cancer-related genes in the set of genes identified by many independent methods suggests that investigators should use several different methods based on different principles. For the data set used here, we suggest that a combination of BioNet, jAM.GR, NetBox, and NetWalker could be used, although it is not clear that this would be true for all data sets or types.
Third, in terms of ease of use, some of the methods are available only as source code, which must be compiled and installed, typically on a UNIX-based system; this may be an obstacle for some experimental biologists. A GUI is highly recommended for the purpose of wide use, or perhaps implementation within a widely used system such as R.
We suggest that the definition of subnetwork needs to be refined to be something more than a simple subset of a global network. Interactome data need to be dissected and reorganized using high-level structures, such as pathways and protein complexes. Those interactome structures ensure that the output subnetworks are biologically meaningful and guide subnetwork detection methods to prune a global network without losing the important biological structures.
Methods
Data Preprocessing
Subnetwork detection usually requires two input data sets, a gene expression data set and a network data set. In this study, gene expression was measured by mRNA sequencing (RNA-Seq), and were obtained from TCGA breast invasive carcinoma category.
1
The expression data consist of raw counts, normalized median transcript lengths, and Reads Per Kilobase of transcript per Million mapped reads for 20,532 genes in 50 tumor samples, paired with 50 normal samples from the same patients. The network data set was downloaded from HPRD.
6
After gene ID matching using BioNet, 7,369 non-redundant genes remained (Supplementary Table 2) and 28,571 interactions were recorded among the encoded proteins after removal of self-loops and isolated interactions (Supplementary Table 3). DESeq
4
was used to normalize the raw counts and to detect differentially expressed genes between the tumor and normal samples based on a negative binomial model. The
Subnetwork Detection Methods
Unless further specified, we used default setting of parameters for all eight models. The input expression and network data are summarized in Table 1, and the gene and interaction lists of the eight subnetworks are in shown Supplementary Tables 2 and 3, respectively.
jActiveModules2,28 requires a weighted gene list with the weights ranging from 0 to 1. Hence, we directly used the adjusted
DEGAS
29
has multiple optional algorithms, and we used the CUSP (Covering Using Shortest Paths) heuristic algorithm to detect subnetworks. Dysregulation direction was selected to be DIFF, and maximum number of modules was set to 1. The number of covered genes
BioNet
30
requires the raw
NetBox
31
is provided with a preloaded Human Interaction Network, and therefore, the only input data needed are a list of seed genes. We used only the genes with the adjusted
ClustEx 32 provides preloaded network data and also supports customized network uploading. For comparative purposes, we used the trimmed HPRD network described above.
It also requires a seed gene set; we used the same set used with NetBox. We considered only the largest output cluster (801 genes) as the final output subnetwork, since all the other 354 clusters contained less than 40 genes.
OptDis 33 needs three input data sets: a network, a gene expression profile, and a gene ID conversion list linking the network and expression sets. As shown in Table 1, OptDis ran slowly. To keep the computational cost tractable, we set the maximum size of modules to 10. OptDis returned 50 modules, all with sizes less than 10 genes. We consider the union of these modules to be a single subnetwork in our analysis.
NetWalker
34
has a preloaded network database called the NetWalker Interactome Knowledgebase. After matching our 7,369 genes with the 13,328 genes in the preloaded network, we obtained 7,354 matched genes. NetWalker requires an expression ratio for each gene centered around 1. We defined the ratio as
Subnetwork Quality Assessment and Functional Enrichment Analysis
Majority of network analysis and graphing were done using MATLAB. And the functional enrichment analysis of subnetworks was performed by KOBAS version 2.0. 11 We identified 462 breast cancer genes out of the 7,369 genes (Supplementary Table 2) in multiple disease databases using KOBAS, and used them as the ground truth to evaluate the predictability of the eight subnetworks (see Figs. 4,5A, and 6). Similarly, we combined the 462 breast cancer genes with 227 genes enriched in cancer pathways to query the HPRD network and found 2,058 interactions (Supplementary Table 3) that connect the 689 genes in the querying list as a positive set of breast cancer pathways (see Fig. 5B). For the functional analysis of commonly detected genes by at least three methods, we input those genes in KOBAS and set the 7,369 genes to the background gene set (Supplementary Table 1).
Author Contributions
Conceived, designed, and conducted the experiments: BJ. Contributed to the writing and revision of the manuscript: BJ, MG. Both authors reviewed and approved of the final manuscript.
Footnotes
Acknowledgments
The authors thank Doug Yatcilla for his advice and assistance installing and running software. The authors also gratefully acknowledge use of the facilities of the Purdue Rosen Center for Advanced Computing.