
Abstract
A major goal in cancer medicine is to find selective drugs with reduced side effect. A pair of genes is called synthetic lethality (SL) if mutations of both genes will kill a cell while mutation of either gene alone will not. Hence, a gene in SL interactions with a cancer-specific mutated gene will be a promising drug target with anti-cancer selectivity. Wet-lab screening approach is still so costly that even for yeast only a small fraction of gene pairs has been covered. Computational methods are therefore important for large-scale discovery of SL interactions. Most existing approaches focus on individual features or machine-learning methods, which are prone to noise or overfitting. In this paper, we propose an approach named MetaSL for predicting yeast SL, which integrates 17 genomic and proteomic features and the outputs of 10 classification methods. MetaSL thus combines the strengths of existing methods and achieves the highest area under the Receiver Operating Characteristics (ROC) curve (AUC) of 87.1% among all competitors on yeast data. Moreover, through orthologous mapping from yeast to human genes, we then predicted several lists of candidate SL pairs in human cancer. Our method and predictions would thus shed light on mechanisms of SL and lead to discovery of novel anti-cancer drugs. In addition, all the experimental results can be downloaded from http://www.ntu.edu.sg/home/zhengjie/data/MetaSL.
Introduction
The current anti-cancer drug development is faced with multiple issues, such as low approval rate of new drugs despite enormous amounts of money and time invested in the drug discovery, emergence of drug-resistance, and side effects of single-target drugs.1,2 Recently, a novel anti-cancer strategy called “synthetic lethality” (SL) has shown great potential to address these issues. A pair of genes is defined as SL if mutation of either gene alone has little effect on the cell but mutations of both genes would lead to cell death.1,2 While the DNA mutation rate is extremely low in normal cells, there are abundant somatic mutations in cancer cells. Thus, a drug that targets the SL partner gene of a cancer-specific mutated gene will kill cancer cells, but spare normal cells. Originally discovered in genetic experiments of yeast and fruit fly, 3 SL was proposed by Hartwell et al as a new framework for anti-cancer therapies in 1997, 4 and since then has been under intense research. Recently, clinical success for breast cancer therapy has been achieved by an SL-based drug, namely the inhibitor of poly ADP-ribose polymerases (PARPs), which has SL interactions with the BRCA1 and BRCA2, two well-known genes for DNA repair whose mutations lead to breast cancer. 1
The dominant approach to discovery of SL is high throughput screening using RNA interference (RNAi) or compound libraries. For instance, Tong et al developed a genome-wide strategy for the construction of double mutants named synthetic genetic array (SGA) analysis 5 ; Ooi et al introduced the genomic approach of SL analysis by microarray (SLAM). 6 In addition, a variant of the SGA method, called epistatic miniarray profiling (E-MAP), was developed to quantify the synthetic effects.7,8 However, the screening-based approach has limitations, eg, high cost, false positive, lack of mechanistic interpretation, and inconsistency among cell lines. As a result, very few SL pairs have been discovered in human cancer. 9 With abundant data of genetic interactions including SL, yeast (Saccharomyces cerevisiae) is a popular model organism for cancer research. It is also because several pathways critical for cancer (eg, DNA damage, cell cycle) are highly conserved between human and yeast. 9 Nevertheless, even for yeast, the number of known SL pairs is low compared to all possible genetic interactions. Many potential SL candidates remain to be discovered for yeast as well as other model organisms (eg, Caenorhabditis elegans, zebrafish). To this end, computational prediction can play important roles, as a cheap and efficient approach complementary to the wet-lab screening. Moreover, computational methods of systems biology based on pathway modeling and functional analysis could shed light on mechanisms of SL interactions. Recently, several machine learning methods have been proposed and tested on the benchmark datasets of yeast, showing that computational methods have great potential to analyze and predict SL. 10 13 Qi et al applied diffusion kernels defined on the network of yeast SL interactions in a support vector machine (SVM) classifier for the prediction of new genetic interactions and protein co-complex membership. 10 Paladugu et al extracted multiple features from protein-protein interaction networks, which were used in an SVM to predict new SL interactions. 11 Li et al used protein domain as the main type of features to achieve high performance of SL prediction. 12 These methods tend to focus on a particular type of features and to use a single machine learning method. However, as a highly complex cellular phenomenon, SL interactions are likely to be caused by different mechanisms. Thus, integrative analysis of multiple features would be desirable. Pandey et al proposed a method called “multi-network multi-classifier” (MNMC) that integrates results of multiple predictive methods into one system. 13 However, MNMC combines the predictions of multiple classifiers without considering their difference in predictive performances. As such, if any classifier employed makes poor predictions, the overall performance of MNMC may be affected.
As more data sources are available and more computational models are designed, meta-analysis methods gain their popularity in computational biology domain for data integration and model combination.14,15 In this paper, we propose a meta-analysis approach called “MetaSL,” which integrates multiple features into multiple predictive models. 16 In contrast to MNMC, MetaSL assigns different weights to the predictions from various models, according to their performances (measured by AUC) during the training process. In other words, the final decisions will be made based on a weighted consensus derived from votes of the participating classifiers. Running on yeast benchmark data, MetaSL was able to achieve an AUC of 87.1%, better than MNMC and other methods. Moreover, we conducted analysis of feature ranking output by MetaSL, which provided biological insights into the observed SL of yeast. In addition, we designed various orthologous mappings between yeast and human genes. By mapping yeast SL to orthologous human genes and taking into account the pathways and gene ontology (GO) annotations, this paper reported human SL candidates that may lead to discovery of novel anti-cancer drug targets.
Methods
Features from Multiple Data Sources
SL means that mutations of two non-essential genes result in a lethal phenotype. 17 Therefore, two genes with an SL relationship generally have back-up functions for each other. To model such relationship, we collected various features to measure the similarity between two genes, including GO semantic similarity, topological similarity in PPI networks, gene expression correlation, and so on. We denote these features as similarity-based features (S features in short). In addition, the clinical applications for each gene in the SL pairs should be non-essential. We thus collected features for individual genes to reflect their propensity to be non-essential and these features are denoted as lethality-based features (L features in short). All these features are summarized in Table 1. Next, we briefly introduce the coding of features from various data sources. We calculated the semantic similarity between genes based on the GO term similarity that is defined in Ref. 18 As we know, GO has three sub-ontologies [biological process (BP), molecular function (MF), and cellular component (CC)], and we were able to calculate a semantic similarity for two genes in each sub-ontology of GO. Therefore, we have three features for GO semantic similarity between genes. For two genes in a PPI network, the number of their common neighbors can be utilized to measure their similarity. We employed a simplified variant of FSweight19,20 to show the topological similarity between two genes. In tandem affinity purification with mass spectrometry (TAP-MS) experiments, two proteins occurring more frequently in the same purifications (ie, bait-prey and prey-prey relationships) tend to have a higher similarity. Here, we utilized a recently developed method called C2S 21 to calculate the similarity from the TAP-MS data. For two genes, the Pearson correlation coefficient between their expression profiles was also applied to measure their similarity. In addition, similarity-based features for two genes in this paper included their co-complex membership, co-pathway membership, whether or not they are paralogs, as well as the number of their common or interacting domains.
Data sources and features for predicting yeast SL pairs.

For each gene, the degree (ie, the number of incident edges) in a PPI network, the number of paralogs, and the number of domains are used as lethality-based features. 22 In total, 17 features are used to predict SL pairs, consisting of 11 similarity-based features and 6 lethality-based features.
Individual Classifiers and the Meta-Classifier
Once we collected the features for gene pairs, various classifiers can be applied to predict whether a given pair of genes is an SL pair or not. In this paper, eight classifiers from the WEKA machine learning suite 23 were used, namely, random forest, J48 (a type of decision tree), Bayesian logistic regression, Bayesian network, PART (a rule-based classifier), RBFNetwork, bagging (bootstrap aggregating), and classification via regression. Among the eight classifiers, random forest is a well-known ensemble classifier. A random forest is a set of decision trees such that each tree is built from a random subset of features. 24 In addition, SVM is a state-of-the-art classification technique and it has been proven to be one of the best classifiers in many application domains. 25 SVM finds a maximum-margin hyperplane for classification by solving a convex optimization problem. In this paper, we explored SVM with linear and Gaussian RBF kernels (using SVM light software 26 ) for predicting SL pairs. With SVM (two kernels) and the above eight classifiers from WEKA, we have ten individual classifiers in all.
Given a pair of genes x, assume that pi(x) is the probability of x to be SL as predicted by the ith classifier (1 ≤ i ≤ N, where N is the number of classifiers and is fixed as 10 in this paper). The MNMC method
13
combines the results from the above 10 classifiers in Equation 1. Here, 
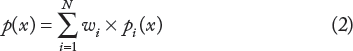
As we know, the above individual classifiers may have different performances for classification. However, the MNMC method treats them equally when combining them in Equation 1 and does not take their relative importance into account. In this work, we apply the following weighted sum in Equation 2 to combine the individual classifiers. We assign the weight wi to the ith classifier based on its classification performance during the training process, eg, a classifier with higher performance will be assigned with a larger weight. Here, we measure the classification performance for classifiers using the AUC, ie, the area under the Receiver Operating Characteristics (ROC) curve (AUC), which is a graphical plot of the sensitivity vs. 1-specificity for a classifiers as the decision threshold varies
Prediction of SL in Human Cancers
In addition to predicting new SL pairs from yeast datasets, we also strive to discover new SL gene pairs of human cancer as potential drug targets. Our strategy to predict SL pairs in human cancer is through transferring the knowledge from yeast to human via comparative genomics. In fact, several existing studies transfer the knowledge from yeast to human beings,9,27–29 based on the conservation of genes related to genome integrity and cell cycles. In particular, RAD54 and RAD27 form an SL interaction in yeast. The authors in Ref. 29 observed that RAD54B-deficient human colorectal cancer cells can be killed by FEN1 silencing, indicating that RAD54B and FEN1 are SL partners. This provides us with a successful example of such knowledge transfer for SL prediction in human cancers.
In this paper, a human gene pair will be predicted as an SL pair in cancer if the following requirements are satisfied. First, this human gene pair has a conserved SL interaction in yeast. Second, one of these two genes is a gene mutated in cancer. For example, two yeast genes yi and yj form an SL relationship while two human genes hi and hj are orthologs of yi and yj, respectively. If hi or hj is a gene that is observed to be mutated in a certain type of cancer, (hi, hj) is then a predicted as SL pair in the human cancer. As such, we prepare the yeast SL pairs, various types of orthologs, and the list of human cancer genes as follows for SL prediction in human cancer.
First, we collected two sets of yeast SL pairs, ie, yeast ground (YG) truth collected from BioGrid and yeast predicted (YP) SL pairs.
Second, we use the ortholog pairs based on DNA sequences, which were downloaded from Ensembl, to map genes from yeast to human beings. In order to map more genes between yeast and human beings, we also define the following two types of functional orthologs in this paper to map more genes orthologous between yeast and human beings.
Functional ortholog, Type 1: To be a pair of this type of functional ortholog, two genes from human beings and yeast are required to have at least a common domain and a GO term in common.
Functional ortholog, Type 2: First, two genes must have a domain in common. Second, instead of sharing a common GO term, two genes are required to have a GO similarity larger than a pre-defined threshold. If the threshold value for the GO similarity is high, the second type of functional ortholog should be more stringent than the first type. In addition, we calculate the GO similarity by following the method in Ref. 18
Lastly, we collected 507 human cancer genes from COSMIC: Cancer Gene Census via the link http://cancer.sanger.ac.uk/cancergenome/projects/census/. With the list of genes mutated in cancer, we can then generate candidate SL pairs in human cancer and each pair has one gene from this list.
Results
Experimental Data
Yeast SL data were downloaded from BioGRID. 30 Originally, there were 10,885 SL pairs in total. However, some of them contain essential genes, which should be excluded because by the definition of SL each single gene in an SL should be non-essential. With the list of essential genes downloaded from http://bioinfo.mbb.yale.edu/genome/yeast/cluster/essential/, we collected 7,347 SL pairs where every gene is non-essential. To train various classifiers, we considered these 7,347 SL pairs as positive data and generated the same number of random pairs (they are not involved in the positive data and have no essential genes) as negative data.
Gene ontology (GO) data were downloaded from http://www.geneontology.org/. The yeast PPI data (eg, DIP data 31 ), gene expression profiles for yeast genes, and their protein domain information were downloaded from Ref. 20 . The real complexes were downloaded from the website of Wodak's lab, 32 and the predicted complexes were generated by the COACH algorithm 33 from DIP data. The sequence orthologs between yeast and human genes and the paralogs for yeast genes were downloaded from the Ensembl database. The pathways for yeast were collected from SGD database, while 364 pathways for human beings were collected with GeneGO MetaCore (https://portal.genego.com).
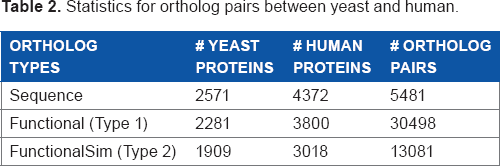
Table 2 shows some statistics for three types of orthologs. For example, there are 5,481 sequence ortholog pairs between 2,571 yeast proteins and 4,372 human proteins. “Functional” and “FunctionalSim” in row 3 and 4 refer to the first and second types of functional orthologs, respectively. Here, the threshold for generating the second type of functional orthologs is set as 0.6. For results with other threshold values, refer to Supplementary Table.
Statistics for ortholog pairs between yeast and human.
Feature Importance Analysis for Yeast SL Prediction
In our dataset, 17 features are used for predicting yeast SL pairs as shown in Table 1. Next, we aim to answer the question – which features are most important for SL prediction?
After training the linear SVM, the absolute values of the feature weights or coefficients show the importance of these features, 34 ie, the larger the |cj| is (cj is the coefficient for the jth feature), the more important is the jth feature in SL prediction. In addition, the coefficients from LASSO22,35 also indicate the importance of individual features. Table 3 shows the feature importance indicated by both SVM and LASSO coefficients, in which the first column shows individual features. For instance, GO_BP_Sim, GO_CC_Sim, and GO_MF_Sim represent the semantic similarities between two genes based on the three GO sub-ontologies - BP, CC, and MF, respectively. In addition, Paralog_A and Paralog_B are the numbers of paralogs of two genes, while Paralog_AB represents whether these two genes themselves are paralogs of each other. The second and fourth columns are the coefficients from linear SVM and LASSO, respectively. For LASSO, the shrinkage parameter is set as 0.0134 and we did not perform feature normalization. Refer to Supplementary materials for shrinkage parameter setting and more results collected by different types of feature normalizations.
Feature importance for yeast SL prediction indicated by SVM and LASSO coefficients.
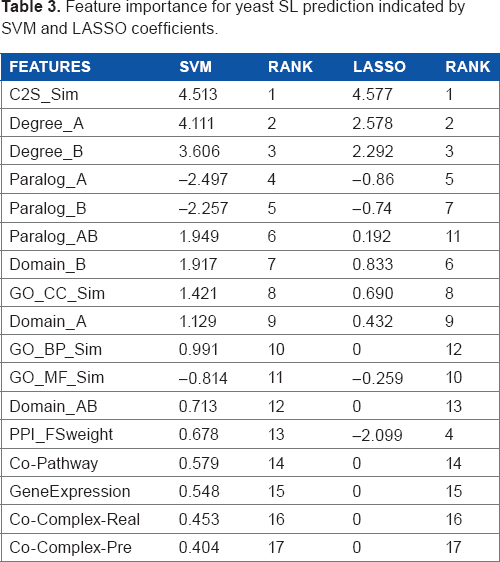
For these two feature rankings in Table 3, their Spearman correlation coefficient is 0.8554, and such a high Spearman correlation demonstrates that they are quite consistent. For example, the C2S scores from TAP-MS data are both ranked first by the two methods. In addition, the lethality-based features, such as degree, paralog, and domain for individual genes, have similar importance indicated by both methods. The C2S score 21 was originally proposed to measure the co-complex membership between two proteins. It is ranked as the most important feature, indicating that co-complex information would be important for SL prediction. However, two features based on the co-complex membership in both real and predicted complexes have low importance demonstrated by both SVM and LASSO coefficients. The reason could be that only a small number of positive and negative SL pairs are co-complex pairs, eg, 167 out of 7,347 positive SL pairs and 5 out of 7,347 negative SL pairs are co-complex pairs in real complexes. Interestingly, the significant difference between the numbers of positive and negative co-complex SL pairs (167 vs. 5 in real complexes and 154 vs. 4 in predicted complexes) leads to high gain ratio scores (another indicator of feature importance) for these co-complex-based features. In particular, the two features of co-complex-real and co-complex-pre have gain ratio scores of 0.104 (ranked forth) and 0.105 (ranked third), respectively. Therefore, the two features based on co-complex memberships have high gain ratio scores, which is consistent with the high rank of C2S scores measured by SVM and LASSO coefficients. As described above, our 17 features can be divided into two categories, ie, similarity-based features (S features) and lethality-based features (L features). Figure 1 shows the performance of individual classifiers on the S and L features, from which we can thus make the following two observations. First, various classifiers achieve significantly higher performance (ie, AUC) on S features than L features, implicating that S features are likely to be more important for the prediction of SL pairs. Second, individual classifiers generally achieve better performances after we combined both S and L features (except for two classifiers J48 and RBFNetwork). This demonstrates that L features are also helpful although S features are relatively more important.

The performance of various classifiers across different feature sets. The performance of individual classifiers on the S and L features was shown.
Performance of Individual Classifiers and Metasl
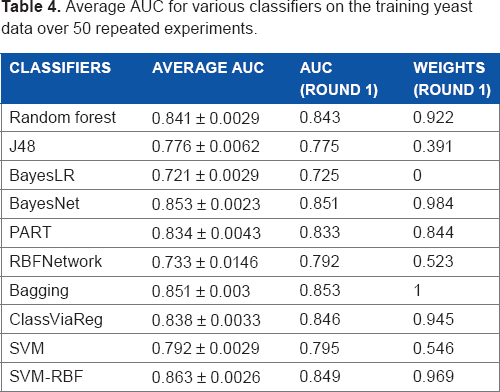
We divided our data into two parts, ie, two-thirds of the data for training and one-third for testing. On the training data, we perform 5-fold cross validation and then obtain the AUC for individual classifiers. With the weights for classifiers based on their AUC, we are then able to combine the results of various classifiers on the test set using Equation 2. We repeated the above process for 50 times. Table 4 shows the average AUC for various classifiers on the training data. Supplementary Tables S1 and S2 in the Supplementary Materials file show the average accuracy and F-measure for various classifiers. As shown in Table 4, SVM with RBF kernel (0.863), Bayesian network (BayesNet, 0.853), and bagging (0.851) achieve higher AUC than other individual classifiers on the training data. Assume the ith classifier achieves an AUC of xi, its weight for MetaSL, wi, is scaled by (xi - min)/(max - min). In Table 4, the third column shows the AUC for various classifiers over the first run of the experiment, where max = 0.863 (achieved by SVM with RBF kernel) and min = 0.679 (achieved by BayeLR).
Average AUC for various classifiers on the training yeast data over 50 repeated experiments.
Figures 2 and 3 show the average AUC and accuracy for individual classifiers as well as MNMC and MetaSL on the test data, respectively (Supplementary Fig. S1 shows the average F-measure). random forest, Bayesian network (BayesNet), bagging, and SVM with RBF kernels have good and comparable performance, eg, with AUC around 0.85 and accuracy around 0.76. Meanwhile, MNMC achieves an AUC 0.84 and accuracy 0.735. MetaSL achieves an AUC 0.871 and accuracy 0.787, outperforming MNMC and the 10 individual classifiers as shown in Figure 2. In addition, we also tried different weighting schemes for various classifiers. Refer to Supplementary files for detailed results.
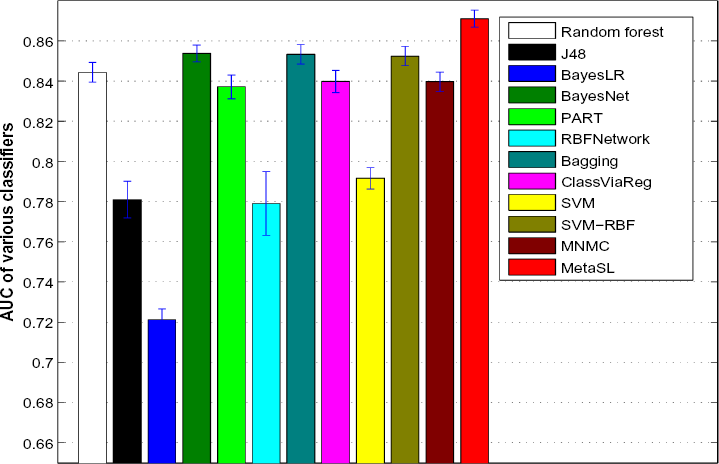
Average AUC of various classifiers including MNMC and our MetaSL on the test data.

Average Accuracy of various classifiers including MNMC and our MetaSL on the test data.
Results for Predicted Yeast SL Pairs
We have introduced the results on the training and testing data in the above subsections. Next, we show the results of novel yeast SL pairs predicted by MetaSL. In our experiments, there are 5,504 non-essential yeast genes. The number of non-essential genes in reality may be less than 5,504 because the list of 694 essential genes here is still far from complete. We aim to make predictions for all the gene pairs, ie,
Table 5 shows the top 10 yeast SL interactions predicted by MetaSL. We observe that in these gene pairs, the two genes tend to have high functional similarity, eg, 9 out of these 10 pairs have GO similarity higher than 0.65 as shown in the third column. In particular, it is interesting to notice that the following three pairs: (YNL104C, YOR108W), (YLR186W, YPL217C) and (YBR009C, YNL030W) have already been reported as genetic interactions in BioGRID. 30 Moreover, the two genes in the pair (YNL104C, YOR108W), which is ranked as second in Table 5, have relation of synthetic growth defect as validated by experiments. 36 In addition, for all the three pairs of genes (YNL104C, YOR108W), (YBR009C, YNL030W) and (YLR270W, YOR173W), each pair shares common protein domains. Therefore, we believe that gene pairs ranked high by MetaSL provide good candidates for experimental screening of SL in the future.
Top 10 predicted yeast SL pairs and their GO term similarity.

Predicted SL Pairs in Human Cancers
As introduced in the “Prediction of SL in human cancers” section, we aimed to predict SL pairs in human cancers from yeast SL pairs via knowledge transfer. In this paper, we have 7,347 yeast SL pairs collected from BioGrid, which serve as training data for MetaSL. We denote this set of yeast SL pairs as YG, which stands for yeast ground truth. We can also select the same number of SL pairs with top scores, which are predicted by MetaSL. We denote this set as YP representing yeast predicted SL pairs. With these yeast SL pairs, the orthologs between yeast and human beings in Table 2, as well as the genes mutated in cancer from COSMIC, we can thus collect six sets of human SL pairs in cancer as shown in Table 6. In Table 6, the first column shows various sets of human SL pairs. For example, “HumanSL-YG-Functional” refers to the set of human SL pairs predicted from YG using functional orthologs for mapping. The other five sets of human SL pairs are named similarly. In addition, we also downloaded 113 human SL pairs from the Syn-Lethality database, 37 which were collected from literature on wet-lab experiments. The second column is the number of SL pairs in each dataset and the third column shows the number of SL pairs whose two proteins are involved in the same pathways. Each SL pair has a semantic similarity based on the GO annotations of the proteins. The last column is the average GO similarities for all the SL pairs in each dataset.
Human SL pairs in cancers.

For six predicted SL sets, two proteins of an SL pair are rarely involved in the same pathways, eg, “HumanSL-YP-Functional” has only 3.48% (537 out of 15,432) SL pairs whose two proteins co-occur in the same pathways, and the percentages of co-pathway pairs in the other five sets are even lower. However, in the Syn-Lethality database, 17 out of 113 real SL pairs have two proteins from the same pathways. The ratio for the Syn-Lethality database (ie, 15.04%) is much higher than the predicted datasets, implying that we should explore more pathway information for SL prediction.
Two proteins with SL interactions are often backup of each other for some important function and are thus supposed to have high functional similarity. However, YG for yeast and the Syn-Lethality database for human beings, as the benchmark datasets for SL pairs, have low average GO similarity scores 0.355 and 0.390, respectively. Meanwhile, we observe in Table 6 that two datasets “HumanSL-YG-FunctionalSim” and “HumanSL-YP-FunctionalSim” have not only the highest average GO similarities but also the lowest ratio of pairs whose two proteins are from the same pathways. These results suggest that we should not rely too much on functional information, but integrate these two data sources (ie, pathways and GO annotations) in an effective manner for SL prediction in the future.
Case Studies for Human SL Pairs
Note that two different SL pairs in YG and YP may predict the same human SL via ortholog mapping. Such SL pairs are considered to more promising as they have evidence from YG and YP. In particular, two datasets “HumanSL-YG-Functional” and “HumanSL-YG-Functional” in Table 6 have 10,834 SL pairs in common. Six out of these 10,834 SL pairs are also involved in the Syn-Lethality database. These six SL pairs are between a proto-oncogene EGFR and other six genes, namely AURKA, PRKACB, PRKCD, PRKCE, PRKCZ, and RPS6KA5 (S6K). In addition, Figure 4 shows a predicted human SL relationship between EGFR and PRKCZ. Next, our case studies are focused on these SL pairs with EGFR. EGFR as a proto-oncogene belongs to a family of four transmembrane receptor tyrosine kinases that mediate the growth, differentiation, and survival of cells. It is associated with a number of human cancers and is a validated cancer therapeutic target.38,39 Figure 5 shows several EGFR related pathways, which lead to tumorigenesis, tumor proliferation, metastasis, chemoresistance, and radioresistance. 40 In Ref. 38 , the authors constructed a protein network centered on EGFR and designed siRNA screens for this network. They found that the drugs targeting the proteins connecting to EGFR, such as protein kinase C family (eg, PRKCD and PRKCE) and Aurora kinase A (AURKA), synergized with EGFR inhibitors to reduce cell viability and tumor size. For example, co-inhibition of EGFR and AURKA would reduce SRC family kinase activity. In addition, siRNA hits on RPS6KA5 and PRKACB also enhances apoptosis in the presence of EGFR inhibitor. 38 It is interesting that most of these EGFR-related SL pairs (EGFR and red proteins) are involved in the pathways in Figure 5. It may indicate that signaling pathways are promising for us to understand and interpret the underlying mechanisms of SL.

A predicted human SL between EGFR and PRKCZ in cancer. The SL interaction between YOR231W and YPL140C is from the yeast ground-truth YG, while the one between YDR477W and YER129W is a predicted SL pair (from YP). The arrowed lines show functional orthologs between proteins. In fact, all six proteins in this figure have a PFam domain in common, ie, PF00069. In addition, YoR231W, YPL140C, EGFR, and PRKCZ have two GO terms in common, ie, GO:0006468 and GO:0007165. EGFR and YDR477 share Go:0007165 while PRKCZ and YER129W share GO:0006468.

Predicted human SL pairs involved in EGFR pathways. The figure shows several EGFR pathways, 40 which often lead to tumorigenesis, tumor proliferation, metastasis, chemoresistance, and radioresistance. Receptor tyrosine kinase (RTK) includes EGFR and IGFR. In this figure, proteins in red including PRKC family, S6K (RPS6KA5), and AURKA are predicted as SL partners of EGFR.
Discussion and Conclusions
SL based anti-cancer treatment is an emerging strategy that targets critical difference between normal and tumor cells, thereby killing tumor cells selectively. The sequencing technologies have provided new data about somatic mutations and other alterations in cancer. Finding SL partners of these cancer-specific mutated genes would provide promising candidates of drug targets. However, because of the high cost of wet-lab screening of genetic interactions, there is a dearth of confirmed SL in human cancer. With abundant benchmark data, yeast is a good model organism for the study of SL. But even for yeast, the number of benchmark SL may be still low. Thus, computational methods are expected to play important roles for large-scale discovery of SL.
In this paper, we proposed an integrative approach that combines multiple genomic and proteomic features and multiple machine learning methods into one meta-analysis system called “MetaSL” for yeast SL prediction. Our features consist of those depicting similarity between two genes and the lethality of single genes. As far as we know, only one previous method (called “MNMC”) combines multiple classifiers to predict SL. 13 However, MNMC treats the results of different methods equally, despite their different performances. By contrast, our method of MetaSL takes into account the differences of predictive methods, using AUC-based weights learned from the training data of yeast SL. We have also analyzed the relative importance of features for the predictive performance, which sheds lights on causal factors of SL interactions. Testing on the SL benchmark data of S. cerevisiae, MetaSL achieved an AUC of 87.1%, the highest among all methods of SL prediction. Furthermore, we designed various orthologous mappings between human and yeast genes, and then we identified SL in human cancer through knowledge transfer from yeast to human.
In spite of promising performance of MetaSL, we have noticed its limitations, which point to future work. First, although our feature weight ranking and GO analysis provide some clues about causal factors of SL, the underlying mechanisms of SL remain unclear. To address this issue in future, we will add pathway analysis to interpret the discovered SL pairs. Using additional post-processing, we hope to filter out false positives and select top reliable SL candidates for experimental studies. Second, the number of features we have used here is still low, and there are inter-dependence among features. In future, we will collect a comprehensive set of features (eg, considering epigenetic features of histone modifications) and conduct feature selection before training our model.
Overall, SL-based cancer medicine is still in its infancy. Our method of MetaSL combines strengths of previous computational methods by meta-analysis of genome-wide features of yeast genes. By integrating additional data and knowledge, we will not only improve the predictive performance but also gain mechanistic understanding of SL, which will contribute to the design of next-generation anti-cancer therapies.
Author Contributions
Conceptualized and designed the method: MW, JZ. Drafted the manuscript together: MW, XJL, JZ. Responsible for the implementation: MW, FZ. Participated in discussion and conceptualization as well as revising the draft: CKK, XLL. All authors read and approved the manuscript.
Supplementary Materials
Footnotes
Acknowledgments
A preliminary version of this work was presented at the ACM Conference on Bioinformatics, Computational Biology and Biomedical Informatics (ACM BCB, 2013), Washington DC, USA, and included in its Proceedings, pp. 384–391.