
Abstract
Optical coherence tomography (OCT) is a high-resolution, nondestructive imaging modality that enables time-serial assessment of adenoma development in the mouse model of colorectal cancer. In this study, OCT was utilized to evaluate the effectiveness of interventions with the experimental antitumor agent α-difluoromethylornithine (DFMO) and a nonsteroidal anti-inflammatory drug sulindac during early [chemoprevention (CP)] and late stages [chemotherapy (CT)] of colon tumorigenesis. Biological endpoints for drug interventions included OCT-generated tumor number and tumor burden. Immunochistochemistry was used to evaluate biochemical endpoints [Ki-67, cleaved caspase-3, cyclooxygenase (COX)-2, β-catenin]. K-Ras codon 12 mutations were studied with polymerase chain reaction-based technique. We demonstrated that OCT imaging significantly correlated with histological analysis of both tumor number and tumor burden for all experimental groups (P < 0.0001), but allows more accurate and full characterization of tumor number and burden growth rate because of its time-serial, nondestructive nature. DFMO alone or in combination with sulindac suppressed both the tumor number and tumor burden growth rate in the CP setting because of DFMO-mediated decrease in cell proliferation (Ki-67, P < 0.001) and K-RAS mutations frequency (P = 0.04). In the CT setting, sulindac alone and DFMO/sulindac combination were effective in reducing tumor number, but not tumor burden growth rate. A decrease in COX-2 staining in DFMO/sulindac CT groups (COX-2, P < 0.01) confirmed the treatment effect. Use of nondestructive OCT enabled repeated, quantitative evaluation of tumor number and burden, allowing changes in these parameters to be measured during CP and as a result of CT. In conclusion, OCT is a robust minimally invasive method for monitoring colorectal cancer disease and effectiveness of therapies in mouse models.
Introduction
Colorectal cancer (CRC) is the third leading cancer with respect to incidence and death rates in both men and women in the United States, responsible for 136,830 new cancer cases and 50,310 deaths in 2014. 1 The slow development of CRC over a period of 10–20 years and extensive documentation of common genetic alterations involved in disease progression make CRC a viable target for chemopreventive and chemotherapeutic interventions. In evaluating treatment methodologies for CRC, targeting of the adenomatous polyposis coli (APC) gene is of particular interest, as mutation of this gene results in the initiation of the adenoma-carcinoma sequence, and has been found in 70%–80% of human CRC cases.2,3 The mutant APC gene activates the Wnt-signaling pathway, leading to the induction of enzymes regulating cell growth and inflammation, such as the polyamine biosynthetic enzyme ornithine decarboxylase (ODC),4,5 and the key isoenzymes converting arachidonic acid to prostaglandins, cyclooxygenases 1 and 2 (COX-1 and COX-2).6–8 Although directly targeting APC with chemopreventive or chemotherapeutic compounds remains difficult, targeting the downstream effectors of Wnt-signaling pathway ODC and cyclooxygenases has been effective in inhibiting colorectal carcinogenesis in animal models and human investigations. The irreversible inhibitor of ODC, α-difluoromethylornithine (DFMO), has been successfully applied to suppress intestinal polyamine levels and tumor formation in experimental models of colon carcinogenesis as well as in a randomized colon cancer prevention trail.9–13 The nonsteroidal anti-inflammatory drug (NSAID) sulindac, which exhibits both anti-COX-1 and COX-2 activities, as well as induces cellular polyamine catabolism and export, was also reported to be an effective chemoprevention (CP) agent in both human and murine CRCs.14–17
Combinations of DFMO with NSAIDs, such as aspirin, peroxicam, and selective COX-2 inhibitors, have shown antitumor efficacy with possible additive or synergistic mechanisms.18–22 Furthermore, combined DFMO/sulindac treatment has effectively suppressed colon cancer cell growth and survival responses in vitro and prevented colorectal adenoma formation in a mouse.22–24 The highly significant efficacy of a combination of DFMO and sulindac has been observed in a randomized double-blind, placebo-controlled phase III trial for colorectal adenoma prevention. 25 These studies, along with the findings from numerous COX-2 inhibitor (coxib) trials26–28 and the latest randomized celecoxib versus DFMO/celecoxib trail completed in patients with familial adenomatous polyposis (FAP) by Lynch et al, 29 provide important evidence that early neoplasia in the colon can be pharmacologically inhibited/delayed and that polyamines and prostaglandins are valid therapeutic targets in the management of early colorectal neoplasia.
A limitation of current human and rodent investigations of agents acting in a chemopreventive (before tumor formation) and chemotherapeutic (after tumor formation) manner is the challenge of time-serially tracking disease progression within an individual subject. Human studies have been limited to one or two imaging time points, making it impossible to determine the growth rate of adenoma under different treatment regimens. While most previous small animal studies have relied on tumor counts following euthanasia and colon explant, we were particularly interested in tracking tumor number and volume over time, in order to monitor the individual colon tumor growth rates. Also, when performing chemotherapy (CT) studies, the typical lack of information on the number and size of tumors at the start of CT makes exact determination of the chemotherapeutic effect in an individual animal impossible to compute. Thus, to enable time-serial examination of the colon for CP and CT treatment assessment, a nondestructive imaging modality is required.
In the azoxymethane (AOM)-induced CRC mouse model, adenomas develop in the distal colon, which is accessible to high-resolution endoscopic imaging techniques. In this study, we rely on simple, rapid mapping of the distal colon with the cross-sectional imaging modality optical coherence tomography (OCT), which has been miniaturized for the investigation of the distal 30 mm of the mouse colon. Although investigations of disease status in mice using whole-body imaging methods such as magnetic resonance imaging 30 and computed tomography 31 have been conducted, adenomas less than 5 mm in diameter are usually too small to be detected. High-resolution versions of these imaging instruments have met with some success in imaging large adenoma in small animal colon, but remain limited in the ability to detect smaller adenoma, are relatively expensive, and slow. 32 Visual inspection of the distal mouse colon with white-light endoscopes is possible,33,34 but quantitative evaluation of adenoma size requires a labor- and expertise-dependent process. OCT, on the other hand, is a high-resolution, minimally invasive imaging modality that may be an effective alternative for analyzing disease progression. OCT uses low levels of reflected near-infrared light to form an image with high resolution (2–20 μm) and reasonable penetration depth (1–2 mm). 35 In addition, image acquisition is fully automated and rapid. In vivo studies in human subjects have shown that OCT is capable of delineating the layers of healthy colon,36,37 detecting adenoma and carcinoma, 37 and differentiating between dysplastic and hyperplastic polyps. 38 OCT is ideal for providing time-serial evaluation of disease progression and therapy, as evidenced by longitudinal studies in the eye (eg, glaucomatous progression) 39 and blood vessels (eg, response to an absorbable scaffold). 40 Furthermore, previous research in our laboratory has developed and applied both dual-modality41–43 and ultrahigh resolution44–46 OCT endoscopy systems in mouse models of CRC, demonstrating the ability of OCT to time-serially image individual mice and track disease progression in the distal 30 mm of the colon. Through time-serial imaging, additional parameters such as tumor burden growth rate can be extracted, which is not possible with the current destructive methods.
The present study tests the hypothesis that the OCT is an effective method for monitoring colorectal disease and will be useful for the assessment of efficacy of drug treatments. This hypothesis was tested through time-serial imaging of disease progression in the AOM-induced mouse model of sporadic CRC using an endoscopic spectral-domain OCT system. The study is also aimed to examine the efficacy of DFMO and low-dose sulindac when treatments were applied either before or after adenoma detection (CP or chemotherapeutic regimes) in the same animal model of CRC. Gross photos and histological sections served as gold standard confirmation of disease at the final imaging time point.
Materials and Methods
Endoscopic spectral domain optical coherence tomography system
The design of the endoscopic OCT system implemented in this study has been previously described in detail. 46 Briefly, ultrahigh resolution is achieved using a super-luminescent diode light source (Superlum Broadlighter) centered at 890 nm with a 150 nm full-width at half-maximum bandwidth. A 50:50 coupler splits the source optical power into a reference arm and a sample arm. The sample arm consists of a 2 mm diameter endoscope with focusing optics at the tip. The focusing optics include a custom lens assembly coupled into a rod prism to achieve a side-firing endoscope. The endoscope optics are enclosed in a 2 mm diameter glass tube for protection during imaging. Linear and rotation actuators control the lateral and angular position of the endoscope optics inside the glass envelope. Backscattered light from the reference and sample arms recombine at the 50:50 coupler, and interference is detected by a custom-built CCD-based spectrometer. A total of 5000 sampled spectra are reconstructed and combined to form the resultant 30 mm longitudinal × 2 mm deep images (5000 × 1024 pixels) with 5 μm longitudinal and 3.5 μm axial resolution.
Animal model
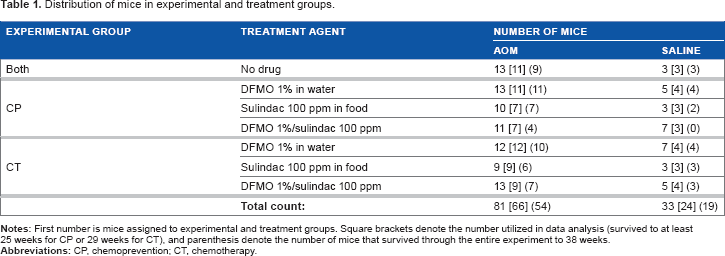
The commonly used AOM-induced mouse model of sporadic CRC was employed, using a carcinogen-susceptible A/J mouse strain. AOM (10 mg/kg body weight) was purchased from Sigma-Aldrich Chemicals and was administered to mice subcutaneously (sc) once a week for five weeks, starting at six weeks of age. One hundred fourteen A/J mice (Stock #000646), purchased from Jackson Laboratory, were initially enrolled in the study. The experimental protocol for the study is presented in Figure 1. Each experimental group (CP and CT) consisted of two categories of mice (AOM and saline) and four treatment subgroups (no drug, DFMO, sulindac, DFMO/sulindac). Eighty-one mice were weighed and injected with AOM (10 mg/kg body weight, sc; Sigma-Aldrich Chemicals) to induce carcinogenesis. AOM was administered once a week for five weeks, starting at six weeks of age. The remaining 33 mice received saline of equivalent volume following the same dosing schedule. The mice in the AOM and saline no drug groups were used as experimental controls in both the CP and the CT experiments. Treatment with DFMO (Dow Chemical Company,), 1% in water, and/or sulindac (Sigma-Aldrich Chemicals), 100 ppm in AIN 93G food (Harlan Laboratories Inc), was initiated concurrently with AOM induction for the CP group (at six weeks of age), whereas treatment was initiated at 24 weeks of age for the CT experimental group in order to allow adenomas to develop. See Table 1 for the number of mice included in each of the experimental and treatment groups. All mice were housed by the University of Arizona Animal Care on a 12:12 hour light/dark cycle with free access to water and food during the study. All protocols were approved by the University of Arizona Institutional Animal Care and Use Committee.
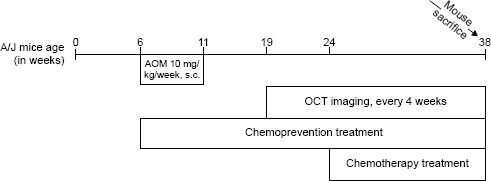
Schematic representation of the experimental protocol.
Distribution of mice in experimental and treatment groups.
Imaging protocol
The mice were first imaged ten weeks following AOM induction, and subsequently imaged monthly for four additional months. Total study duration from receipt of the mice to euthanasia was approximately eight months. Twenty-four hours prior to imaging, mice were fasted and given Pedialyte® in place of water to clear the colon. Mice were weighed, anesthetized with either 2.6% Avertin solution ip or a mixture of ketamine (0.33 mg/mL, 100 mg/kg) and xylazine (0.033 mg/mL, 10 mg/kg) ip. The colon was then gently flushed with 3–9 mL of warm saline, and the endoscope was coated with a biocompatible water-based lubricant and inserted approximately 32 mm. For all mice, 30 mm longitudinal OCT images were collected at eight different positions spaced 45° apart. Imaging of each mouse took approximately five minutes and required no user intervention.
Tissue acquisition and histology
Following the final imaging time point, the mice were euthanized with CO2 gas and 30 mm of colorectal tissue was excised for histological processing. Excised colons were opened longitudinally, adhered flat to Whatman paper, gross photos were obtained, and the tissue was fixed in 10% formalin. The fixed colons were embedded in paraffin, longitudinal sections were obtained every 250 μm, and the sections were stained with Hematoxylin and Eosin. A blinded observer analyzed the histological sections to determine the number and maximal width of discrete adenoma per mouse. The gross photos of the excised colons and the results of histological analysis provided gold standard confirmation of the final OCT imaging time point.
Image analysis protocol
OCT image features associated with normal colon tissue and adenoma have been previously verified, and 95% sensitivity to adenoma has been demonstrated. 38 The features of normal colon include consistent mucosal thickness, consistent signal attenuation with image depth, and visible tissue boundaries. Features of adenoma include thickened regional mucosa and/or moderate-to-marked protrusion of mucosa to more than twice the average regional thickness, moderate-to-marked signal attenuation, and faint or obscured tissue boundaries. 38 All eight images for each mouse at each time point (4560 images total) were visually analyzed by a nonblinded observer using the above objective criteria to determine the number of discrete adenoma per mouse. Adenoma size was determined as the maximal width of discrete adenoma identified in the OCT images. Discrete adenoma volume was determined using the aforementioned size value. Owing to the 45° spacing between images, complete characterization of asymmetrical lesions is highly unlikely. As such, spherical volumes were assumed in the calculation of adenoma volume. The size measurements and discrete volumes were then used to calculate total tumor burden (sum of discrete adenoma volumes per mouse at each time point). All measurements were recorded for statistical analysis and comparison with histology. The observer who scored the raw images was different from the blinded observer who scored the histology slides.
Immunohistochemistry and scoring
Colon sections from three animals per each experimental group were processed for immunohistochemistry (IHC) analysis. IHC was performed using the automated Ventana platform from Ventana Medical Systems (VMS) using a streptavidin DAB detection kit from VMS. Tissue was cut to 3 μm thickness and baked at 65°C for 30 minutes before staining. The tissue was stained for proliferation marker Ki-67, apoptosis marker cleaved caspase-3, Wnt-signaling marker β-catenin, and inflammation marker COX-2. For Ki-67, a rabbit monoclonal primary antibody (Leica Biosystems) was used at a dilution of 1:100, with a secondary antibody (biotinylated IgG mouse anti-rabbit from Vector Laboratories Ltd) at a dilution of 1:100, both antibodies were incubated for 30 minutes. Cleaved caspase-3 (Cell Signaling Technology, Inc.), a rabbit monoclonal antibody, was used at a dilution of 1:8000 and incubated for 60 minutes, with a mouse anti-rabbit IgG secondary antibody used at a dilution of 1:100 (Vector Laboratories Ltd) incubated for 30 minutes. For β-catenin, a rabbit monoclonal antibody (Cell Signaling Technology, Inc.) was used at a dilution of 1:300, incubated for 60 minutes followed by a mouse anti-rabbit IgG secondary used at a dilution of 1:100 (Vector Laboratories Ltd) incubated for 30 minutes. The COX-2 antibody was purchased from VMS in a prediluted form and used directly on the tissue, and a mouse anti-rabbit IgG secondary (Vector Laboratories Ltd) was used at a dilution of 1:100 and incubated for 30 minutes. The appropriate positive control tissue was used for each antibody assay. Analysis of the Ki-67 and cleaved caspase-3 staining was done by manually counting the number of positively stained cells in the crypts directly adjacent to the muscularis in 50 colonic crypts per slide. The slides stained for COX-2 and β-catenin were read by an experienced pathologist (RBN) with 30 years of experience, who was blinded to treatment categories. The results are presented as a long score based on the sum of intensity of staining multiplied by the percent of stained tissue area. The following scoring criteria were used: 0, no staining; 1+, weak diffuse staining (may contain stronger intensity in <10% of the cells); 2+, moderate staining in 10%–90% of the cells, and 3 +, more than 90% of the cells stained with strong intensity. Staining for all biomarkers was analyzed in three mice from each treatment group except for AOM-sulindac and AOM-DFMO/sulindac groups in CT category where scoring from two mice per group was obtained.
Restriction fragment length polymorphism analysis of mouse K-Ras gene codon 12 mutations
DNA was isolated from paraffin-embedded colon tissue slides using Qiagen FFPE kit (QIAGEN Inc.). Specific primers were designed to create a BstNI restriction site at codon 12 of the mouse K-ras exon 1. The wild-type primer sequence AAA CTT GTG GTG GTT GGA GCT GGT was modified to create BstN1 restriction site (a G->C change made at codon 11, 3 bp from the 3′ end, bolded underlined below). The following primers were used for the polymerase chain reaction (PCR): 5′-AAA CTT GTG GTG GTT GGA
Statistical analysis methods
Statistical comparison of OCT data between experimental and treatment groups was performed for weight gain, number of tumors, tumor burden growth rate, and IHC staining. Data for all saline category treatment groups within an experimental group were combined, as values did not vary significantly. Statistical analysis of tumor number and tumor burden growth rate only included the AOM-treated mice. All measurement time points were included for the CP experimental group, whereas only time points following treatment initiation at 24 weeks of age were included for the CT experimental group. Statistical analysis of weight gain and tumor burden growth rate was performed by fitting a linear regression line to the values measured across time for individual mice. The analysis of the number of tumors was based on the maximum observed number of tumors over the entire study duration or at time of death for individual mice. Mice that died before the end of the experiment were excluded from these analyses if they did not have at least two measurements to allow slope estimation or one measurement of maximum value. Thus, in the CP experiment, five mice (all AOM categories) that died before week 21 were excluded from weight gain analysis and tumor number analysis, and nine AOM mice that died before week 25 were excluded from the tumor burden growth rate analysis. In the CT experiment, 10 mice that died before week 29 were excluded from the weight gain analysis, six AOM mice that died before week 29 were excluded from tumor burden growth rate analysis, and four AOM mice that died before week 25 were excluded from tumor number analysis. The number of animals in each category included in tumor burden growth rate analysis is shown in square brackets in Table 1. The number of mice surviving to the final time point is shown in parentheses in Table 1.
In the analysis of weight gain, the effects of AOM versus saline, DFMO treatment (presence or absence), and sulindac treatment (presence or absence) were assessed using a three-way ANOVA. As a three-way interaction between these variables was found to be not significant, it was removed from the model and all two-way interactions were assessed. When a two-way interaction was statistically significant (P < 0.05), stratified analyses were performed. In the analysis of tumor burden growth rate, only AOM-treated mice were included in a two-way ANOVA, with stratified analyses performed if appropriate. The number of tumors was analyzed using Poisson regression, with assessment of interaction as outlined above. All P-values reported are two-sided and are not adjusted for multiple comparisons.
In order to verify the accuracy of OCT, statistical analyses of the final OCT time point and histology with respect to the number of tumors and tumor burden were performed. The data from all mice with corresponding histology were included in these analyses. The data for the AOM and saline-no drug groups were used in both the CP and CT comparisons. When animals were sacrificed before the end of the study, the values observed at the time of sacrifice were used in the analyses. The correlation between the OCT and histology tumor burden measurements was assessed using the Pearson correlation coefficient and confirmed using the nonparametric Spearman correlation coefficient. The distribution of the number of tumors was compared using a Fisher's exact test. Differences in the mean values for tumor burden and the number of tumors were tested using the nonparametric Wilcoxon signed-rank test.
Statistical analysis of IHC staining was performed to evaluate the treatment effects and differences between treatment groups in terms of the number of positively stained cells (for Ki-67 and cleaved caspase-3) or staining score (for β-catenin and COX-2). Each analysis was done using score results from different animals (number of animals specified in the tables) per each treatment group. For Ki-67 and cleaved caspase-3, the mean number of positively stained cells and the associated standard deviation were presented and Poisson regression with overdispersion was performed to evaluate the treatment effects and the differences between treatment groups in the number of positively stained cells. For β-catenin and COX-2, the average score of IHC staining and the associated standard deviation were presented and linear regression was performed to evaluate the treatment effects and the differences between treatment groups in the staining score. For both Poisson and linear regression, Tukey's post hoc test was performed to adjust for multiple comparisons while evaluating the differences between groups.
Fisher's exact test was employed to test for the difference in the occurrence of K-RAS mutations between the different treatment groups. All P-values reported are two-sided and are not adjusted for multiple comparisons.
Results
Time-serial analysis of disease progression in OCT
The OCT system yielded high-resolution images of murine colonic morphology with clear distinction between tissue types such as the mucosa, submucosa, and muscularis propria. Furthermore, the micron-scale resolution attained by this system allowed relevant markers of disease progression to be tracked. OCT can image about 1 mm deep in mouse colon tissue, sufficient to image through the entire normal colon and smaller adenoma. An example OCT image series for one mouse over the five imaging time points is presented in Figure 2, along with corresponding final time point histology. In the first image (Fig. 2A), a colonic lesion portraying several of the characteristics consistent with adenoma, such as regional mucosal thickening and marked signal attenuation, is evident. Additionally, tissue boundaries are faint compared to adjacent normal colon. However, the lesion does not meet the mucosal protrusion of more than twice the average regional thickness criteria. As such, it would not be counted as an adenoma. In contrast, the same lesion is depicted in the second image (Fig. 2B), portraying all of the characteristics consistent with adenoma. In the third through fifth images (Fig. 2C, D, and E, respectively), an additional lesion with characteristics consistent with adenoma appears in the proximal end of the images. As time progresses, both lesions significantly increase in size. The corresponding histological section (Fig. 2F) confirms the presence of adenoma at the suspected locations.
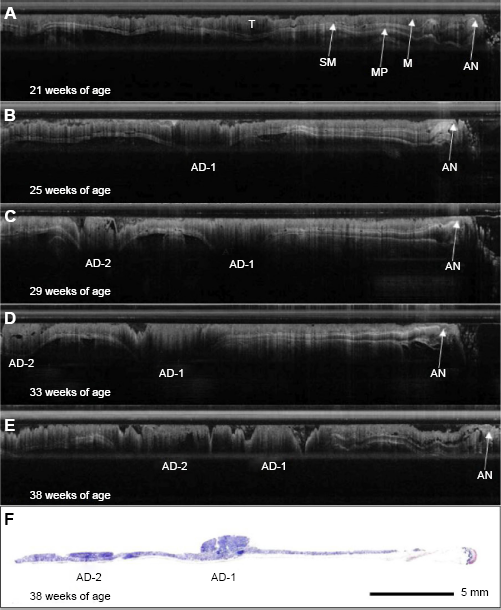
Time-serial OCT image series. OCT image series for a single mouse at a single rotation over time. (
Accuracy of OCT
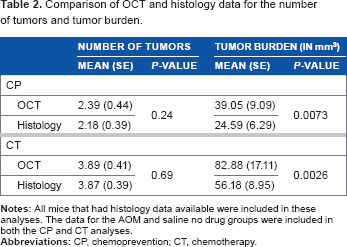
The final time point OCT and histology means and standard errors for the number of tumors and tumor burden for both experimental groups are depicted in Table 2. The results for the number of tumors were very similar between OCT and histology, whereas the tumor burden measured by OCT was consistently higher than that measured by histology. Both Pearson and Spearman correlation analyses determined that highly significant correlations existed between the OCT and histology measurements for both the number of tumors and tumor burden for both experimental groups (all P < 0.0001). The statistical analyses comparing the mean number of tumors showed no statistically significant differences between the OCT and histology data for either experimental group (P = 0.24 for CP and P = 0.69 for CT). However, significant differences in the tumor burden values for OCT versus histology were found in both the CP and CT experimental groups (P = 0.0073 and P = 0.0026, respectively). Overall, OCT was determined to have 89.02% sensitivity to adenoma, and only 12.57% of the total number of tumors identified were false positives (21 out of 167).
Comparison of OCT and histology data for the number of tumors and tumor burden.
CP experimental group
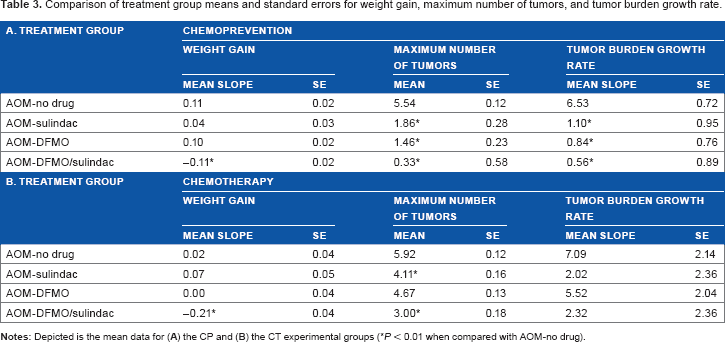
For the CP experimental group, OCT image analysis resulted in the finding that 100% of the mice in the no drug group developed adenomas over the course of the study, whereas prevalence was reduced to 72.7% in the DFMO group, 85.7% in the sulindac group, and 22.2% in the DFMO/sulindac group. The value of treatment with DFMO and/or sulindac is further depicted in Figure 3, showing a drastic reduction in the average number of tumors and average tumor burden growth rate per mouse over time in the DFMO and sulindac treatment groups. Statistical analysis of the AOM-treated mice by two-way ANOVA revealed a significant effect of DFMO (P < 0.0001), sulindac (P = 0.0003), and the DFMO/sulindac combination (P < 0.0001) on the maximum number of tumors observed when compared with the AOM-no drug group. A statistically significant interaction between the drugs was not found (P = 0.57), nor was there a significant difference between DFMO alone versus sulindac alone (P = 0.51). Analysis of tumor burden growth rate by two-way ANOVA found that DFMO and sulindac interacted at a statistically significant level (P = 0.0039), with a statistically significant decrease compared with AOM-no drug (P < 0.0001). Subsequent stratified analyses determined that treatment with either drug alone significantly reduced tumor burden growth rate in the absence of the other drug (P = 0.0002 for DFMO, P = 0.0030 for sulindac). There was no statistically significant difference in tumor burden growth rate in the effect of DFMO alone versus sulindac alone (P = 0.83). Data are compiled in Table 3.
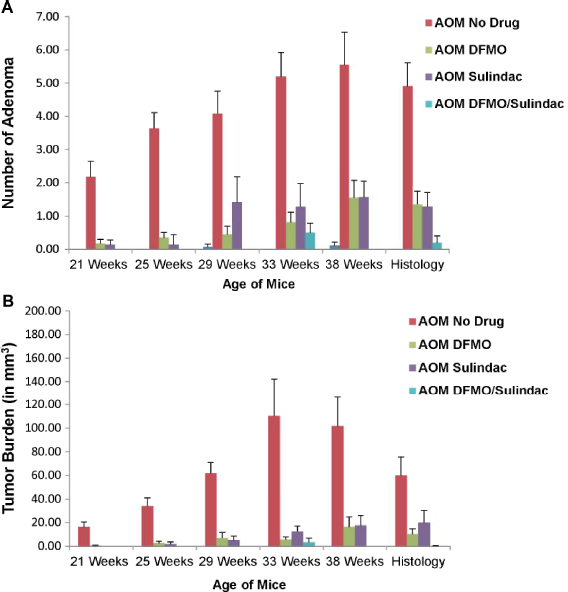
Chemoprevention experimental group time-serial plots of average number of tumors and average tumor burden. Depicted above are the plots for average number of tumors per mouse (
Comparison of treatment group means and standard errors for weight gain, maximum number of tumors, and tumor burden growth rate.
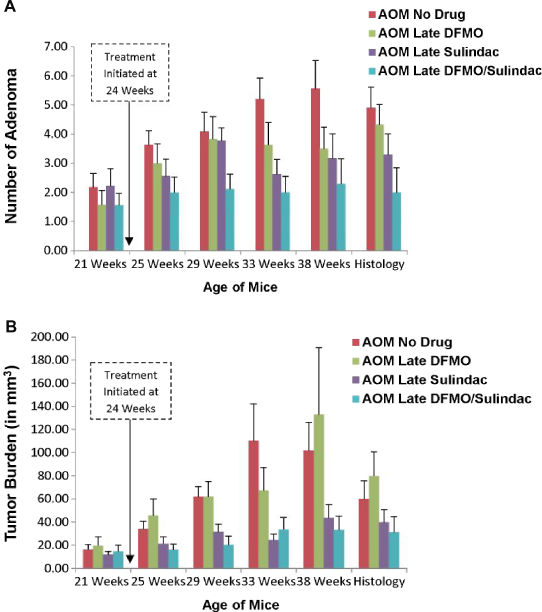
IHC analysis of colonic tissues from different treatment groups (three slides/group) revealed that in the CP setting both DFMO and sulindac suppressed cell growth as single agents or in combination as assessed by Ki-67 IHC (Fig. 4A). Statistical analysis of Ki-67-positively stained cells shows that DFMO treatment was more effective than sulindac in the inhibition of cell proliferation (AOM-no drug vs AOM-DFMO, P < 0.001, AOM-no drug vs AOM-sulindac, P = 0.03, and AOM-no drug vs DFMO/sulindac, P < 0.0001) (Table 4A). None of the pairwise comparisons of cleaved caspase-3 positively stained cells between AOM-no drug and CP treatment groups reached statistical significance (Table 5A). The analysis of pattern and level of expression of COX-2 protein in colon tissue samples showed epithelial staining with the localization of COX-2 protein in lamina propria cells, in crypts, and inflammatory cells, but there was no localization of COX-2 in dysplastic epithelial cells within the AOM-induced tumors (Fig. 4B).
IHC scores for Ki-67 staining. (
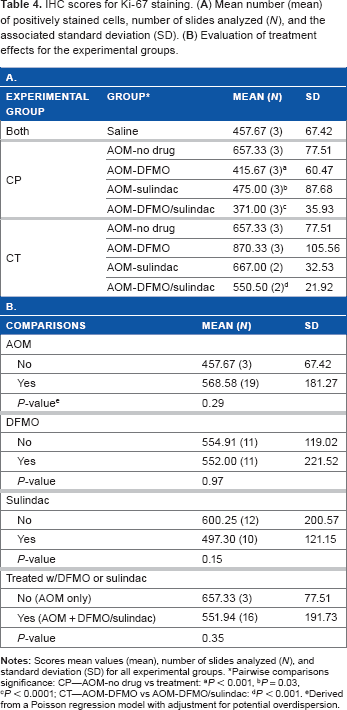
Pairwise comparisons significance: CP—AOM-no drug vs treatment:
P < 0.001,
P = 0.03,
P < 0.0001; CT—AOM-DFMO vs AOM-DFMO/sulindac:
P < 0.001.
Derived from a Poisson regression model with adjustment for potential overdispersion.
IHC scores for cleaved caspase-3 staining. (
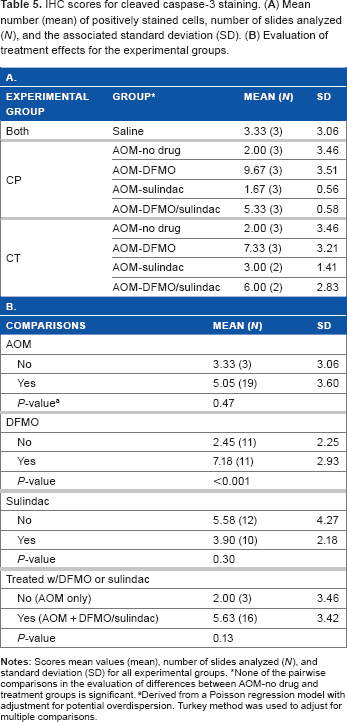
None of the pairwise comparisons in the evaluation of differences between AOM-no drug and treatment groups is significant.
Derived from a Poisson regression model with adjustment for potential overdispersion. Turkey method was used to adjust for multiple comparisons.
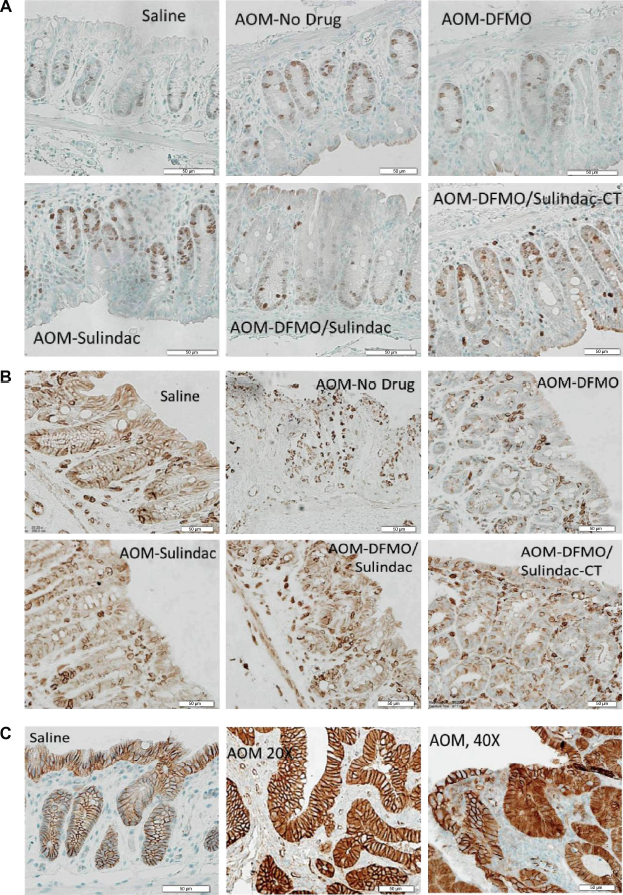
Examples of IHC staining of Ki-67, COX-2, and β-catenin. (
In the AOM-DFMO/sulindac group, a 3.75-fold decrease in the mean COX-2 intensity score in the crypts was observed, but this difference was not statistically significant because of a high variation between the samples (Table 6A). β-catenin staining was not affected by any treatment (Supplementary Tables 1 and 2). The only difference was found in β-catenin staining of adenomas where the intensity score was higher in cytoplasm and lower in membrane compared to the normal mucosa (Fig. 4C, Supplementary Tables 1C and 2C, P < 0.0001 for both).
IHC scores for COX-2 staining in colon crypt area. (
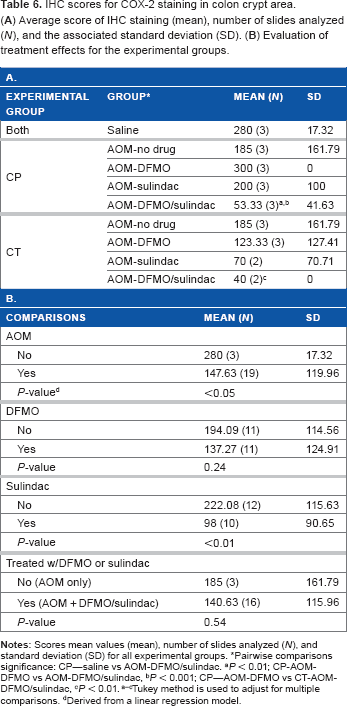
Pairwise comparisons significance: CP—saline vs AOM-DFMO/sulindac.
P < 0.01; CP-AOM-DFMO vs AOM-DFMO/sulindac,
P < 0.001; CP—AOM-DFMO vs CT-AOM-DFMO/sulindac,
P < 0.01. a–cTukey method is used to adjust for multiple comparisons.
Derived from a linear regression model.
The restriction fragment length polymorphism (RFLP) analysis of the mutational status of the K-Ras gene (codon 12) identified that 37.5% of samples in AOM-no drug group and 40% in AOM-sulindac group carried the mutation in codon 12 of K-Ras gene. On the contrary, DFMO treatment prevents occurrence of K-Ras-mutations in the AOM-DFMO treatment group (Table 7, P = 0.0429 is statistically significant) as it suppresses cell proliferation. 47 The AOM-DFMO/sulindac group had a lower percent of K-Ras mutation (7.69%) compared to no drug and sulindac groups (Table 7).
Percent of K-Ras mutation for the AOM-treated mice.
CT experimental group
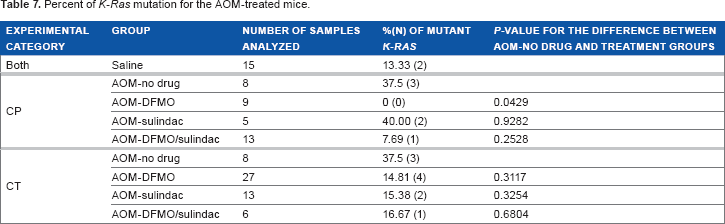
For the CT experimental group, the average number of tumors and average tumor burden growth rate per treatment group over time are depicted in Figure 5, showing a less dramatic effect of the drugs. A statistically significant interaction between DFMO and sulindac was not found with respect to either maximum number of tumors (P = 0.80) or tumor burden growth rate (P = 0.68). Statistical analysis by two-way ANOVA revealed a significant effect of sulindac (P = 0.0072) but not DFMO (P = 0.07) on the maximum number of tumors per mouse. DFMO and sulindac in combination statistically significantly reduced the tumor number in treated animals compared to AOM-no drug animals (P < 0.01), but there was no difference between the combination versus sulindac alone (P = 0.20). Neither sulindac (P = 0.07) nor DFMO (P = 0.73) were found to significantly reduce tumor burden growth rate. Data are compiled in Table 3.
CT experimental group time-serial plots of average number of tumors and average tumor burden. Depicted above are the plots for average number of tumors per mouse (
The analysis of IHC staining for Ki-67 and cleaved caspase-3 showed that neither agent nor their combination were able to significantly reduce cell proliferation or stimulate apoptosis in treated animals compared to AOM-no drug mice when the agents were applied after tumor initiation (Tables 4A and 5A). But when individual treatment groups were compared, DFMO/sulindac combination group had reduced Ki-67 staining compared to AOM-DFMO group (Table 4A, P < 0.001). Treatments did not have any statistically significant effect on the expression levels or intracellular distribution of β-catenin in the normal tissue (Supplementary Tables 1A and 2A). Analysis of K-Ras mutation in different treatment groups showed the decrease in the percent of identified K-Ras mutations in all treatment groups compared to AOM-no drug group but these results did not reach statistical significance (Table 7, CT).
Discussion
Minimally invasive, high-resolution optical imaging techniques have demonstrated their ability to identify early microscopic changes associated with neoplasia. 48 Optical imaging modalities, such as OCT, confocal microscopy, fluorescence imaging, and multiphoton microscopy (MPM), are ideal for the early detection of colon as well as other (eg, ovarian) cancers.32–46,49–52 We have recently shown that imaging of mouse models with OCT, fluorescence imaging, and MPM at multiple time points is possible and allows for the detection of microscopic and macroscopic changes in the tissue with disease progression.52–54
In this study, we applied endoscopic OCT time-serial imaging to determine the effectiveness of DFMO and low-dose sulindac treatments in a mouse model of CRC. We tested two treatment regimens: chemopreventive and chemotherapeutic, and corroborated the final time point endoscopy results with IHC analysis of colon tissue for biochemical assessment of drug interventions. Endoscopic OCT images of each mouse were obtained at five different time points and utilized to determine the number of adenomas and tumor burden. This study was novel for two reasons. First, it evaluated multiple treatment regimes at multiple times, whereas previous research using these drugs have only evaluated one time point of one treatment regime (DFMO,10,11 sulindac,14–16 or the combination of DFMO and sulindac23,24). A second novel aspect of this study is that our endoscopic OCT system enabled nondestructive imaging, which allows us to determine the number of tumors and tumor burden as a function of time. Thus, analysis of tumor burden slope, or growth rate, could be conducted. As shown in Figure 5, mice in the CT experimental group did not start with the same number of tumors or tumor burden, so nondestructive imaging was crucial for proper statistical analysis of the effects of DFMO and sulindac in a chemotherapeutic setting.
OCT accuracy and measurement error
Our OCT system clearly delineated the architectural features of healthy colonic tissue, including the mucosa, submucosa, and muscularis propria, and differentiated between normal tissue and adenoma (see Fig. 2). Imaging with OCT is far more rapid than with a white-light endoscope; no colon insufflation or special expertise is required, a series of images is obtained in less than 5 minutes, and images are a known constant scale for easy measurement of tumor size. Comparison of final imaging time point data with histology showed a significant correlation between measurements taken by OCT and histology. Also, adenoma detection based on OCT image analysis is highly accurate. However, OCT consistently estimated a larger tumor burden than histology, because of errors in adenoma sizing most likely from sampling error, tissue distortion, suboptimal image quality in a few cases, and histological processing. OCT images were only obtained every 45°, which may lead to sampling error in size estimation. Insertion of the endoscope causes adenoma to compress, violating the assumption of a spherical tumor. In some OCT images of highly diseased colons, the image quality was degraded by residual feces or blood, making it more difficult to discern adenoma from residual debris, or distinguish individual adenoma from multiple adenomas in close proximity to each other. Finally, histological processing is known to dehydrate and shrink tissue samples, so histological measurements are expected to be smaller than those obtained in vivo. In one controlled study, the average OCT layer thickness was 19% larger than histology. 55 However, even with these limitations, our protocol was able to correctly identify adenoma with a sensitivity of 89.02%, with only 12.57% of the adenomas counted being false positives. This finding compares similarly with our previous studies on accuracy of adenoma detection, 46 which found a sensitivity of 95% and false positive rate of 15.56%.
Efficacy of DFMO and sulindac treatments
DFMO acts to prevent intestinal carcinogenesis by a mechanism involving the irreversible inhibition of the polyamine biosynthetic enzyme ODC, suppression of genes involved in cell migration cell-cell communication, 47 and depletion of tissue thymidine pools. 56 In contrast, the NSAID sulindac has been shown to inhibit the activities of the two isoforms (COX-1 and COX-2) of cyclooxygenase enzyme, as well as induces apoptosis through both COX-dependent 14 and COX-independent mechanisms. 17
Our current findings of biological endpoints (tumor number and tumor burden) and cancer biomarkers prove that DFMO is an effective CP treatment modality for reducing both the number of tumors and tumor burden growth rate. The lack of an interaction between DFMO and sulindac and the lower average number of tumors observed in the DFMO/sulindac combination group suggests that these drugs may combine additively to further reduce the number of adenoma that develop. With respect to tumor burden growth rate, no effect of DFMO was found, but there was a nearly significant (P = 0.07) effect of sulindac. Based on these results, it appears that DFMO is most likely to have a significant effect on inhibiting carcinogenesis when applied during the initiation stage, whereas sulindac may be effective in both the initiation and promotion stages.
IHC analyses served as independent markers associated with cancer treatment. The IHC for Ki-67 protein, which is elevated in proliferating cells and correlates with the clinical course of the disease, shows that the number of Ki-67 positively stained cells was low in DFMO and DFMO/sulindac treated colon tissues in the CP setting (Table 4). Ki-67 scoring analysis suggests that DFMO acts as the more efficient inhibitor of cell proliferation than sulindac.
When treatments were started after adenomas became visible by OCT (CT setting), sulindac alone showed effectiveness in reducing the colon tumor number, but not tumor burden. In CT setting, DFMO and DFMO/sulindac groups had elevated levels of apoptosis by cleaved caspase-3 positive cells staining (Table 5A), although comparison between AOM-no drug and these treatment groups did not reach statistical significance.
Furthermore, we performed IHC staining of the colon tissues from different treatment groups for COX-2 protein. COX-2 is involved in initiation and promotion of malignancy in different cancers, and elevated expression of COX-2 protein and prostaglandin levels have been reported in human adenomas and carcinomas of the colon.57,58 In our study, COX-2 expression was used as a marker of the treatment efficacy with sulindac, a nonselective COX-2 inhibitor. We found the most significant suppression of the COX-2 protein expression in DFMO/sulindac combination groups of both CP and CT treatment settings.
We also measured the level and subcellular localization of β-catenin in the colon tissue samples of animals from different experimental groups. β-catenin is a known transcriptional regulator of the Wnt-signaling pathway. β-catenin is also involved in cell adhesion through its complex with cadherin; therefore, it is important in the development of CRC. 3 In this study, the expression and subcellular localization of β-catenin was not significantly affected by the applied treatments. The only difference was found in adenomas compared to the normal mucosa, such that adenomas had increased cytoplasmic staining and decreased cytoplasmic membranous staining (Fig. 5C and Supplementary Tables 1C and 2C, P < 0.0001 for both). Loss of membranous β-catenin staining, significantly less nuclear staining, and elevated cytoplasmic staining have been observed in colonic adenomas of FAP patients resistant to sulindac treatment. 59
CRC arises as a result of progression from benign colorectal adenoma to malignant carcinoma through accumulation of chromosomal abnormalities, genetic mutations, and epigenetic changes. 2 Because of the reported resistance to sulindac treatment of adenomas that carry mutations in the K-RAS oncogene, 59 we measured the mutational status of K-Ras in colon samples of control and treated animal in CP and CT groups. Guda et al 60 reported a low (6%) frequency of K-Ras activating mutations, located predominantly in exon 1 of K-Ras gene, in AOM-treated A/J mice sacrificed at 32 weeks of age. In our study, mice were sacrificed at 38 weeks of age and had higher (37.5%) frequency of K-Ras mutations in the AOM-no drug group (Table 7). Treatment with DFMO was effective in preventing the occurrence of K-Ras mutations in the CP study (0%, mutations, P = 0.043). In the CT setting, there was no statistically significant difference in the occurrence of K-Ras mutations between AOM-no drug and treatment groups (P > 0.05), although all treatment groups had the lower percent of K-Ras mutations compared to AOM-no drug (Table 7). Based on this finding, we concluded that the lack of significant effect of treatments initiated in CT setting may be explained in part by the accumulation of K-Ras mutations before the start of treatment.
Agents toxicity in AOM-induced A/J mouse model of colon carcinogenesis
Limitations of the animal model should be considered when translating these findings to human colon cancer prevention and treatment. CRC in human beings can develop as a consequence of alterations in a number of pathways, including the sporadic and FAP-associated adenoma–carcinoma sequence, hereditary nonpolyposis CRC and colonic inflammation-associated cancer. 3 The molecular events associated with colorectal disease progression include frequent somatic mutations and deletions in tumor-related genes, including K-RAS, APC, and p53. In the AOM-induced CRC model, the most frequently found mutation is in the K-RAS oncogene, whereas mutations in APC and p53 tumor suppressor genes are less common.60–62 Moreover, in the AOM-treated mouse model, the AOM derivative methylazoxymethanol (MAM) induces DNA adduct formation, leading to genetic alterations in DNA repair genes, TGF-β signaling molecules, β-catenin, and K-RAS, 63 resulting in the upregulation of COX-2 and ODC. This carcinogenesis pathway represents the less common genetic alteration in human beings, whereas an estimated 70%–80% of cases are initiated by a mutation in the APC gene. 3 Therefore, the effectiveness of treatment with DFMO and sulindac in this mouse model may not be completely comparable with human cases where APC is mutated. The incidence and multiplicity of colonic adenomas are significantly higher in AOM-induced A/J mice compared to AOM-induced C57BL/6 and 129/Sv mouse strains making it a suitable model for CP research. A/J mice metabolize more AOM on average than other strains of mice because of increased activity of CYP2E1 (an enzyme that converts AOM to MAM). 63 The particular susceptibility of A/J mice to AOM could result in liver toxicity, which would compromise the metabolism of sulindac. 64 Finally, treatment in this model was dependent upon animal eating and drinking habits. A decrease in food and water consumption could have limited the ability of DFMO and sulindac to prevent carcinogenesis. Previous research with human subjects has indicated that the extended use of DFMO or NSAIDs causes toxic side effects. For instance, dosage-dependent mild-to-moderate temporary hearing loss is a known toxicity of treatment with DFMO.12,13,25,65,66 On the other hand, extended NSAID use has been associated with gastrointestinal bleeding, gastrointestinal permeability, and increased risk of cardiovascular events.67–69 The NSAIDs most likely to be toxic are of the coxib type, which tend to be selective COX-2 inhibitors. 67
The current study utilized a lower dose of DFMO (1%) and sulindac (100 ppm), compared to doses used in previous studies with a C57BL6 strain. 24 In the present study, a statistically significant reduction in weight gain resulted from the combination of DFMO and sulindac, regardless of experimental or treatment group, and for sulindac alone for mice in the CP group, which were exposed to the agent for a longer period of time than the CT group. Treatment with DFMO alone did not alter the animal weights. It is possible that the mice simply found the taste of the drug-laced food to be disagreeable. It is also possible that A/J mice are more susceptible for the chronic effect of sulindac on the gastrointestinal epithelium than other strains. 64 Although specific evaluations for upper gastrointestinal ulcerations were not performed at necropsy, visual inspection of the mice at each imaging time point and of the excised colons did not reveal any adverse side effects of treatment with DFMO and/or sulindac.
Conclusion and Future Directions
This first application of OCT for tracking colonic disease progression and evaluating chemopreventive and chemotherapeutic agent effectiveness significantly improved upon the current paradigms for evaluating disease progression and agent effectiveness in human and mouse models, allowing time-serial data on an individual subject to be easily and quickly obtained. Furthermore, the design of this study evaluated multiple treatment regimes, enabling the interaction between DFMO and sulindac to be elucidated, as well as the effect of agent timing relative to adenoma formation. In addition, analysis of cancer biomarkers in this study was performed on the same experimental animals and provided the molecular basis for the observed effects of DFMO, sulindac, and its combination.
Our results show that DFMO/sulindac combination can be successfully used as chemopreventive and chemotherapeutic treatments for suppression of colon tumor number. The current study suggests that DFMO is most effective when the treatment is initiated with the start of AOM injections and continues through the initiation, promotion, and progression stages of colon carcinogenesis. Also, in the CP setting, DFMO treatment prevented occurrence of K-Ras mutations in the AOM-induced colon cancer model. Therefore, DFMO alone is very effective in suppressing colon carcinogenesis in the chemopreventive setting. Time-serial imaging analysis of the tumor number and tumor burden growth rate in the CT setting confirmed the effectiveness of sulindac treatment in suppressing colon tumor number compared to AOM-no drug or AOM-DFMO CT groups. In previous studies, sulindac was found to be the most effective when given during the promotion/progression stages, attributed to its effect on apoptosis.70,71 In our study, sulindac was effective in suppressing COX-2 expression, but did not have any effect on apoptosis, evaluated by cleaved caspase-3 staining.
The efficacy of pharmaceuticals administered during surveillance intervals to prevent colon carcinogenesis may depend on whether the agents prevent new adenomas from forming or cause regression of existing adenomas. Future studies could determine if reducing the exposure interval to these agents would retain sufficient anticarcinogenesis activity while reducing the risk of potential toxicities associated with DFMO and/or sulindac. While the currently used endoscopic OCT system was highly capable of obtaining useful measures of tumor count and burden, more accurate measures of adenoma size and shape, and thus tumor burden, could be obtained using a spiral-scanning OCT system that obtains three-dimensional images of the colon. In future studies, we will use a system, similar to the one previously reported. 72 Additionally, future development of endoscopic OCT systems capable of cellular resolutions may enable earlier detection of neoplasia in both mouse models and human patients, thereby improving the morbidity and mortality rates associated with CRC.
Author Contributions
Conceived and designed the experiments: SL, EWG, NAI, and JKB. Analyzed the data: SL, PSR, RAW, KJS, RB, AL, CHH, DJR, RBN, ERA, KF, and NAI. Wrote the first draft of the manuscript: SL. Contributed to the writing of the manuscript: PSR, RAW, RB, DJR, NAI, and JKB. Agreed with manuscript results and conclusions: all the authors. Jointly developed the structure and arguments for the paper: SL, EWG, NAI, and JKB. Made critical revisions and approved the final version: all. All the authors reviewed and approved the final manuscript.
Footnotes
Abbreviations
Acknowledgments
University of Arizona Cancer Center Support Grant (including usage of Shared Resources) P30CA023074.