
Abstract
Microarray technology has been widely applied to the analysis of many malignancies, however, integrative analyses across multiple studies are rarely investigated. In this study we performed a meta-analysis on the expression profiles of four published studies analyzing organ donor, benign tissues adjacent to tumor and tumor tissues from liver, prostate, lung and bladder samples. We identified 99 distinct multi-cancer biomarkers in the comparison of all three tissues in liver and prostate and 44 in the comparison of normal versus tumor in liver, prostate and lung. The bladder samples appeared to have a different list of biomarkers from the other three cancer types. The identified multi-cancer biomarkers achieved high accuracy similar to using whole genome in the within-cancer-type prediction. They also performed superior than the one using whole genome in inter-cancer-type prediction. To test the validity of the multi-cancer biomarkers, 23 independent prostate cancer samples were evaluated and 96% accuracy was achieved in inter-study prediction from the original prostate, liver and lung cancer data sets respectively. The result suggests that the compact lists of multi-cancer biomarkers are important in cancer development and represent the common signatures of malignancies of multiple cancer types. Pathway analysis revealed important tumorogenesis functional categories.
Introduction
Human malignancies remain one of the leading causes of mortality in the United States. Uncontrolled growth, reduced ability to undergo apoptosis and the ability to metastasize are some of the important features of malignancies, regardless of origins of tissues. There are multiple mechanisms underlying the phenotype of cancer. The alterations of cell growth and cell death signaling pathway due to mutation and inactivation of tumor suppressor genes and/or amplification and activation of proto-oncogenes have been thought to be the primary causes of carcinogenesis. 1 Abnormalities of the same signaling pathways can be found in multiple types of human cancers, while a tumor may contain multiple abnormalities in signaling. Overlapping these abnormalities among multiple types of tumors may shed light on some key alterations of carcinogenesis.
Prostate cancer is second only to skin cancer as the most commonly diagnosed malignancy in American men: at current rates of diagnosis, one man in six will be diagnosed with the disease during his lifetime. 2 Even though nutritional and environmental etiology has been implicated for prostate cancer development, such link has yet to be firmly established in general population. Some studies suggested that up to 80% of men age older than 80 were found to contain pathologically recognizable prostate cancer, while rarely any man younger than 40 developed the same disease. This argues against any singular specific etiology responsible for prostate cancer besides aging. Histologically, prostate cancer cells closely interact with their neighbor stromal cells to form some distinctive architectural patterns that make up the basis of Gleason's grading. 3 The clinical courses of most prostate cancers are long, and some are life-threatening. Hepatocellular carcinoma, on the other hand, is quite the opposite. It is not age related, and is tightly linked to cancer etiologies such as alcohol, hepatitis B or C virus or certain toxins. Hepatocellular carcinoma is distinctive in its well confined nodular architecture. The clinical courses of most of the hepatocellular carcinomas are short and the fatality is high. Most of the lung cancers, with the exception of small cell carcinoma, are also associated with distinctive etiologies, such as smoking or chronic exposure to certain type of carcinogens. The urothelial carcinoma of the urinary bladder, however, is primarily idiopathic or viral related. Since these four types of cancer are so far apart in etiology, morphology and clinical courses, any common ground between these tumors could be interpreted as a likely common pathway of carcinogenesis.
In the literature, microarray technology has been widely applied to the analysis of many malignancies, including the four cancer types mentioned above. However, meta-analysis to integrate multiple studies has rarely been investigated. Segel et al. 4 proposed a systematic approach to incorporate 1,975 arrays in 22 tumor types and constructed a large gene module map. The resulting module map was, however, too complex to follow up and the modules were based on 2,849 known biologically meaningful gene sets instead of learning new sets of multi-cancer biomarkers. The gene matching of heterogeneous array types also potentially deteriorate the analysis accuracy. In this report, we performed a meta-analysis on 455 arrays collected from four microarray studies in Affymetrix U95Av2 platform: 94 samples of liver tissue 5 (43 liver cancer, 30 hepatic tissues adjacent to liver cancer, 21 normal liver from organ donors), 148 samples of prostate tissues 6 (66 prostate cancer, 59 prostate tissues adjacent to prostate cancer and 23 organ donors), 151 samples of lung tissues 7 (134 tumors and 17 normal lung tissues) and 62 urinary bladder tissues 8 (5 normal and 57 tumors). The use of common array platform has avoided the problem of incorrect gene matching and gene annotation, a common cause to deteriorate the performance of meta-analysis in microarray. 9 We performed two batches of analyses. In batch I, all three tissue types in liver and prostate were analyzed using analysis of variance (ANOVA) model. In batch II, normal and tumor tissues in all four cancer types were included and t-test was used to identify multi-cancer biomarkers (see Table 1 for data description). The identified biomarkers were found to have high predictability in both within-cancer-type (i.e. cross-validation within a single cancer type) and inter-cancer-type (i.e. prediction model trained in one cancer type and used to predict another cancer type) prediction via leave-one-out cross validation. Further pathway enrichment analysis identified statistically significant function categories of the biomarkers. Validation of the 47 batch II multi-cancer biomarkers on an independent 23 prostate tissues yielded 96% accuracy in inter-study prediction from the original prostate, liver and lung cancer data sets respectively, showing the robustness of the multi-cancer biomarkers and their implications to common carcinogenesis of multiple cancer types.
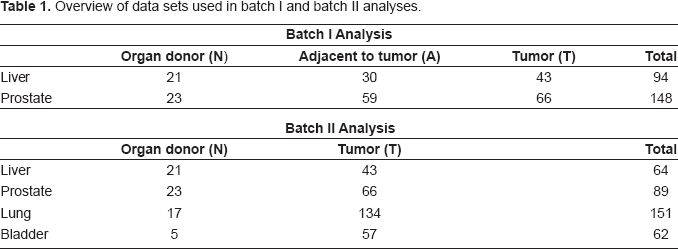
Overview of data sets used in batch I and batch II analyses.
Materials and Methods
Data and Preprocessing
We collected four published microarray data sets5–8 to perform meta-analysis on prostate, liver, lung and bladder samples. A total of 455 U95Av2 arrays were analyzed (94 liver, 148 prostate, 151 lung and 62 bladder tissues) with each covering 12,625 genes and EST sequences. The common array platform eliminated technical difficulties including gene matching and inter-platform discrepancies. In liver and prostate data sets, three types of samples were collected: organ donor (N), normal tissues adjacent to tumor (A) and tumor tissues (T). In lung and bladder tissues, only organ donor and tumor tissues were available. We analyzed the data through two batches of analyses. In the first batch, both liver and prostate data sets with all three tissues were included. The expression patterns across the three types of samples were the major targets for investigation. In the second batch, data of all four organ types were included and only normal and tumor samples were compared. For details see Table 1.
The raw data (CEL files) were preprocessed in each cancer type separately using dChip software for array quality assessment, normalization, expression intensity extraction and log-transformation (base 2). Genes of low information content in each data set were filtered respectively and the union gene set of the four data sets was retrieved for further analysis. Specifically, in each data set, the top 50% genes with the largest average intensities were first selected. Among them the top 50% genes with the largest standard deviations were further identified, resulting in 25% genes (3,156 genes) selected in each data set. The union list of these most informative 25% genes in four data sets was used for subsequent downstream analysis (a total of 5,917 genes). The expression intensities in each sample column of each data set are standardized to have zero mean and unit variance so that data sets of different cancer types are comparable.
Biomarker Selection by ANOVA and T-Test
In batch I analysis, ANOVA model was fitted for the organ donor (N), adjacent to tumor (A) and tumor (T) samples with a βparameter for field effect and a γ parameter for tumor effect. Stepwise algorithm was used to select the best regression model. The ANOVA model is described in the following:
ANOVA model for batch I analysis: (A) Eight categories of ANOVA patterns used to select multi-cancer biomarkers. N denotes normal, A tissue adjacent to cancer, and T tumor sample. (B) Venn diagram representation of the number of ANOVA genes found to be significantly altered in liver and prostate tissues when comparing N, A and T groups. (C) Bar graph of genes that were altered in liver (1854), prostate (1139) or both tissue samples with same pattern (111). (D) Histogram of correlations of N-A-T patterns across prostate and liver of the 520 common ANOVA genes.

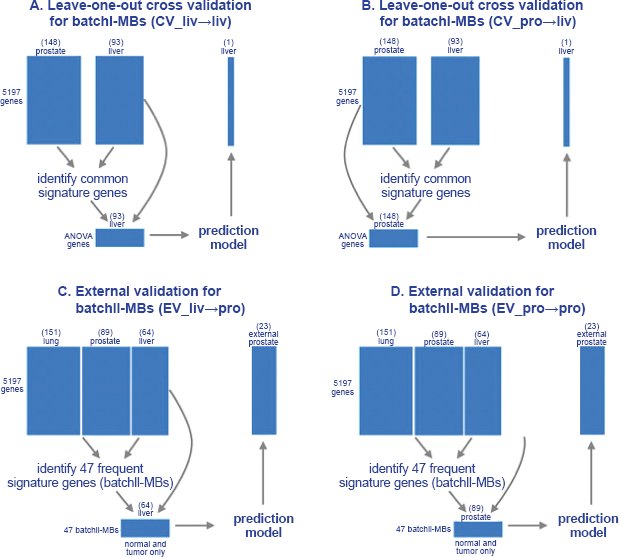
In the batch II analysis, similar gene selection procedure was performed. Instead of ANOVA, simple t-test was performed to distinguish normal and tumor. Given the comparison of a pair of cancer types (e.g. liver vs. lung), genes satisfying the two criteria used in batch I were first selected and the intersection of the gene lists obtained from the two compared cancer types were identified. Among them, genes with concordant differential expression direction (up- or down-regulation) were used to construct prediction model for within-cancer-type (Liv↠Liv and Lun↠Lun) and inter-cancer-type (Liv↠Lun and Lun↠Liv) analysis. Leave-one-out cross validation was similarly performed. For each pair of cancer type comparison, gene lists of more than 70% appearance in the leave-one-out cross validation signatures were identified and were denoted as “liv-pro-MBs” (i.e. multi-cancer biomarkers in liver-prostate comparison), “liv-lun-MBs” etc. The intersection genes of “liv-pro-MBs”, “liv-lun-MBs” and “pro-lun-MBs” are denoted as “batchII-MBs” (See Fig. 4; bladder cancer data appear to generate a very different biomarker list than that from liver, prostate and lung data, as will be describe later).
Diagram of batchI-MBs and batchII-MBs and their intersection genes. The 47 batchII-MBs are listed in Table 5 and 109 batchII-MBs are listed in Supplement Table 4.
Gene-Specific Scaling in Inter-Cancer-Type Classification
Figure 2 demonstrates expression patterns of one selected gene for each of the eight pattern categories (the category (N = T) > A had no gene and is omitted). We observed that gene-specific scaling was needed for many of the biomarkers so the prediction information could be carried across organs. For example in “APBA2BP”, the expression of group A is consistently greater than N and group T is further greater than A in both liver and prostate samples. However, the levels of expression intensities in liver and prostate are in different scale even though all the liver and prostate samples are preprocessed and properly normalized across data sets. This phenomenon may be due to differential sample preparation, tissue physiology and/or hybridization conditions in different studies. As a result, we conducted gene-specific scaling in all inter-cancer-type classification. Conceptually the scaling parameters are estimated so that the gene vectors in each study are standardized to mean 0 and standard deviation 1. However, since each study has a different ratio of normal versus tumor samples, we performed a bootstrap sampling before scaling so that the gene vectors were standardized under a synthetic condition that groups (N, A and T) are of equal sample size in each study (see Appendix for more details).
Expression patterns of selected representative genes in liver and prostate samples. Selected genes of seven pattern categories from the 111 common concordant ANOVA genes in liver and prostate samples. Global sample normalization has been performed across prostate and liver data sets. It is clearly seen that although all these biomarkers demonstrate concordant patterns across prostate and liver, many of them (APBA2BP, SLC39A14, AGT, TOP2A and B2M) are at different expression level and direct application of a prediction model developed in one data set will likely perform poor in the other data set.
Classification Method and Leave-One-Out Cross Validation
PAM (Prediction Analysis of Microarray) was used to construct the prediction models in this paper.
10
The method has been found effective in many microarray prediction analyses and has the merit that gene selection is embedded in the method. When “all genes” are used, the predictive genes are automatically chosen from the total of 5,917 genes to construct the prediction model. When “common signatures” are used, the common biomarkers are selected according to the description in the section “Biomarker selection by ANOVA and t-test” and no gene selection is further performed in PAM. Results of both gene selection procedures are reported and compared. To avoid over-fitting in the evaluation of cross-predictability of the multi-cancer biomarkers, we conducted rigorous leave-one-out cross validation (see the prediction scheme in Figs. 3A and 3B), i.e. the left out sample does not participate in the selection of marker genes.
Confusion Matrix and Prediction Index
In the literature, the overall accuracies from different methods are usually reported to compare performance. It is, however, often a misleading index in practice. Supplementary Table 1 demonstrates an example. Among 42 tumor patients, one false negative was made and among six normal patients, five false positives were made. The overall accuracy is pretty high (87.5%) but it is a result of predicting almost all tissues as tumor with high sensitivity (97.6%) but extremely low specificity (16.7%). A standard alternative to this situation may be the AUC (area under ROC curve) index by varying classification threshold in the classification rule. This measure is, however, not readily available for classical methods like KNN and SVM. Even for methods that can calculate AUC, the measure is very unstable for small sample size. In this paper, we report the confusion matrixes that convey the entire prediction results in the appendix. A 2 × 2 table is used to summarize the number of patients in true and predicted status of normal or tumor groups. The two off-diagonal numbers represent the false positives and false negatives in the prediction and their sum represent to total errors made (see Supplement Table 1). We then further summarize the prediction results by a prediction performance index (PPI) that is defined as the average of sensitivity and specificity, to be used throughout this paper for performance evaluation.
Pathway Analysis
For each gene list of multi-cancer biomarkers, the gene ontology (GO) database was used for pathway enrichment analysis. For each GO term, a Fisher's exact test was performed to determine the enrichment of the gene list and a p-value was generated.
11
We performed this analysis in batchI-MBs, batchII-MBs and all pairwise comparison multi-cancer biomarkers in batch II (liv-pro-MBs, liv-lun-pro-MBs etc). The p-value results were summarized in a heatmap (Fig. 5).
Pathway analysis heatmap. The enriched Gene Ontology terms are demonstrated on rows and lists of multi-cancer biomarkers are shown on columns. The significance (p-values) is represented by gradient red color. When the number of genes of the biomarker list that fall in the GO term is too small or zero, the p-value assessment is not computable or not stable and is represented as missing in white color.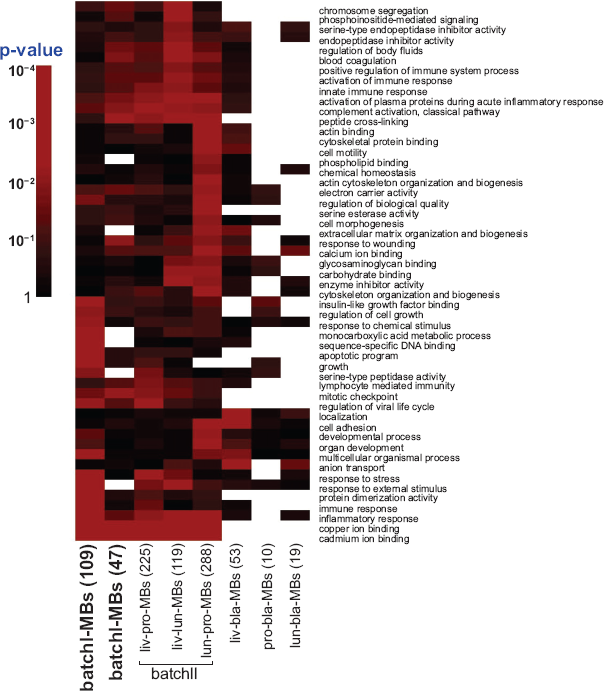
External Evaluation of Batchii-MBs by Independent Prostate Data
A data set of 23 prostate cancer samples performed in an independent lab 12 was used for external validation of the batchII-MBs. A toltal of 47 batchII-MBs were identified from the normal and tumor samples in liver, prostate and lung data sets. To evaluate the robustness and inter-cancer-type cross-predictability, a prediction model based on the 47 batchII-MBs in the normal and tumor samples of liver data set was constructed and was used to evaluate the 23 external prostate cancer samples (see “EV_liv↠pro in Fig. 3C). The evaluation of prediction model generated by the old prostate data is denoted by “EV_pro↠pro” in Figure 3D. Similarly we also perform “EV_lun↠pro” evaluation. The data preprocessing of the 23 new samples was conducted similarly to the four analyzed data sets and simple constant normalization was adopted against the original prostate data set. Additional gene-wise normalization against the original prostate is also applied so the liver and lung data sets can be used to predict the 23 new prostate samples.
Results
To identify common signature genes among four types of malignancies, we started with the prostate and liver data sets in batch I analysis because of more balanced numbers of tumor and normal samples and availability of benign tissues adjacent to tumor. In this analysis, 1,854 genes from liver data set and 1,139 genes from the prostate data set were found to fit the ANOVA model and meet the gene selection criteria. Among these genes, 520 genes were common in both organs (Venn diagram in Fig. 1B). The histogram of correlations of N vs A vs T patterns (average intensities of each group) across two organs in each gene is shown in Figure 1D. Majority of the genes were highly correlated across prostate and liver but surprisingly 113 genes presented strong negative correlation (<–0.7), which may reflect the differences in tissue types. The 520 selected genes were categorized into eight patterns as demonstrated in Figure 1A. These patterns represent either tumor specific alteration, field effect, or reactive changes. Among these 520 genes, 111 genes were in the same pattern categories in liver and prostate (Fig. 1C) based on our definition in Figure 1A. Further analysis of expression of the 111 genes in both organs indicated that even though the expression patterns for these genes across N, A and T were identical in both organs, the levels of expressions may vary greatly (for example, APBA2BP and SLC39A14 in Fig. 2). This suggests that direct application of classification model constructed in one cancer type may not predict the histology of tissues in the other cancer type. To resolve this problem, an adequate gene-specific scaling across organs was carried out for the inter-cancer-type prediction. The gene-specific scaling procedure described in the Method section and Appendix is applied for all analyses hereafter.
Prediction performance indexes (PPI) in batch I analysis. Pairwise two-group comparisons (N vs. T, N vs. A and A vs. T) are performed.

Prediction performance indexes (PPI) in batch II analysis. The values shaded in grey are summarized in Table 4.

PPI summary of within-cancer-type and inter-cancer-type predictions in batch II analysis.

All genes are used in the within-cancer-type prediction to allow PAM for automatic predictive gene selection. Numbers of genes used in PAM are shown in parentheses.
In all inter-cancer-type predictions, only common signature genes are used in PAM and PAM does not perform further gene selection. The numbers of genes appeared more than 70% of leave-one-out cross validations are shown in the parentheses (i.e. liv-pro-MBs, liv-lun-MBs and pro-lun-MBs).
The 44 batchII-MBs overlapped by pair-wise comparisons of liver, prostate and lung data sets (liv-pro-MB, liv-lun-MB, pro-lun-MB). The first 12 genes with asterisk overlapped batchI-MBs. The signed mean fold change shows mean fold change of tumor versus normal when positive (up-regulation) and normal versus tumor when negative (down-regulation).

To validate the robustness and cross-predictability of batchII-MBs, a data set of 23 independent prostate cancer samples obtained from another institute
12
was evaluated. The prediction model based on the 47 batchII-MBs in the 64 normal and tumor liver samples achieved 96% (22/23) accuracy in predicting the 23 independent prostate samples (the “EV_liv↠pro” scheme in Fig. 3C). Evaluation of “EV_pro↠pro” and “EV_lun↠pro” also gave the same results (96% accuracy). Since we only have tumor samples in the external prostate data, there is a potential pitfall that the high accuracy may be an accidental result of study discrepancies between the new 23 prostate samples and the normal and tumor samples in analyzed data sets. We performed multi-dimension scaling (MDS) plots to visualize the new and old samples and excluded this possibility (Fig. 6). The new prostate tumor samples are scattered and mixed with the old tumors but separated from old normal samples. As a result, the high accuracy of the prediction on this new data set is not caused by pure “accident.”
MDS plot of existing training data set and independent prostate cancer data. Three MDS plots of the existing liver, prostate and lung training data sets respectively with the 23 independent prostate tumor samples. The mixing of the 23 tumor samples and old tumor samples exclude the possibility of accidental high accuracy due to study differences.
Discussion
Meta-analyses have been performed for several types of human malignancies.13–18 However, to our knowledge, this is the first report showing that a microarray gene expression model demonstrates inter-cancer predictability between different types of cancers using the identified multi-cancer biomarkers. These results not only were evaluated in cross-validation analysis of existing working data sets but also were validated by independent prostate tissues collected and preprocessed separately. This argues strongly in favor of the reproducibility of the multi-cancer biomarkers and the models. The 44 batchII-MBs appear to represent the common gene expression alteration among hepatocellular carcinoma, lung and prostate cancer. They follow similar patterns of differential expression in normal and tumor tissues for prostate, lung and liver cancer. Surprisingly, these gene signatures predict prostate, lung and hepatocellular carcinoma with similarly high accuracy as using the entire genome information of 5917 genes in each within-cancer-type prediction in prostate, lung or liver cancer. This suggests that the 44 genes are the major determinant of gene expression alteration in these three types of cancers.
Comparing the 44 genes to published potential biomarker list yielded high overlapping (28 overlapped to the 3,312 gene list generated in Bhattacharjee et al. 7 22 overlapped to the 2,413 gene list generated in Luo et al. 5 16 overlapped to the 726 gene list generated in Yu et al. 6 ). The high level of inter-organ cancer predictability using just 44 genes implies that the core of cancer gene alterations may actually be quite small. The alterations of the expression of these genes could represent the common features of the three types of malignancies. None of these genes was, however, identified as the most significantly altered in bladder cancer suggest the dis-resemblance of bladder cancer to these three types of cancers. Among these genes includes a interferon inducible protein, 1–8D (IFITM2, 411_i_at). This gene was a known important mediator of interferon induced in cell growth inhibition and induction of cell death.19,20 1–8D was down-regulated in hepatocellular carcinoma, lung cancer and prostate cancer, while pro-growth genes such as cyclin B1 (CCNB1, 34736_at) was significantly up-regulated in three types of tumor samples. Other genes involving in growth controls including growth arrest specific 6 (GAS6, 1597_at), G0/G1swtich 2 (GOS2, 38326_at) are also abnormally expressed in these tumors. The 44 gene list also includes six metallothioneins including 1A, 1B, 1E, 1F, 1H and 2A (MT1A, 31623_f_at; MT1B, 609_f_at; MT1E, 36130_f_at; MT1F, 31622_f_at; MT1H, 39594_f_at; MT2A, 39081_at). Metallothioneins are some low molecular weight zinc binding proteins that play important role in regulating transcriptional activity for variety of genes, and play crucial role in zinc signaling.21,22 Abnormal up-regulation of these genes may result in global pattern of gene expression alteration. Up-regulation of metallothioneins were thought to contain prognostic value in invasive ductal breast cancer. 23 CCNB1 and most of the metallothioneins were also identified in batchI-MBs where adjacent tissues were included in the analysis. In the pathway analysis, we also observe many cancer related functional categories, including “mitotic checkpoint”, “apoptotic program”, “copper ion binding” and “cadmium binding”. Investigation into the abnormalities of these pathways may yield important insight into the common carcinogenesis mechanism of the tumors. A possible future work is to study sequential biopsies in the progression of different tumors in a mouse model and analyze the expression changes of the biomarkers identified in this paper. Such rigorous validation of signature genes can help create a carcinogenic model and reduce the inter-individual genetic differences.
The clinical implication of our finding is two-fold: If the prediction of hepatocellular carcinoma, lung cancer and prostate cancer using our 44 batchI-MBs is interchangeable, we like to hypothesize that the abnormalities in the expression of the 44 genes represent a common features of these malignancies. Therapeutic targeting toward some of these genes will be of significant value in treating these malignancies. Second, the 99 batchII-MBs predicts tissues adjacent to malignancies versus completely normal organ tissues with high accuracy. This model may be able to serve as predictor of malignancies nearby even if a biopsy misses its tumor target. This may serve as an indicator for a quick follow-up re-biopsy until the tumor(s) is identified. Alternatively, the detection of a strong cancer field effect change may argue for some prophylactic treatments before morphological cancer appears.
Dsiclosure
The authors report no conflicts of interest.
Footnotes
Acknowledgements
This work is supported by grants from National Cancer Institute to JHL (R01 CA098249), by Urology development fund and by the John Rangos Foundation for Enhancement of Research in Pathology. G.C.T. is supported by National Institute of Health (1 KL2 RR024154–02) and University of Pittsburgh (Central Research Development Fund, CRDF; Competitive Medical Research Fund, CMRF). The authors wish it to be known that, in their opinion, George C. Tseng and Chunrong Cheng should be regarded as joined first authors. The authors wish it to be known that, in their opinion, George C. Tseng and Chunrong Cheng should be regarded as joined first authors.
Investigating Multi-cancer Biomarkers and Their Cross-predictability in the Expression Profi les of Multiple Cancer Types
George C. Tseng, Chunrong Cheng, Yan Ping Yu, Joel Nelson, George Michalopoulos and Jian-Hua Luo