
Abstract
The soluble urokinase plasminogen activator receptor (suPAR) has been detected in blood, plasma, serum, urine, ovarian cystic fluid, and cerebrospinal fluid. Elevated suPAR levels in plasma have been associated with negative outcomes in various diseases, such as bacteremia, sepsis, SIRS, cardiovascular disease, cancer, and tuberculosis. The primary aim of this study was to investigate whether suPAR can be detected in saliva from healthy individuals and thus, if saliva suPAR can be related to plasma suPAR, CRP, BMI, or gender. Blood and unstimulated whole saliva was collected from 20 healthy individuals (10 female and 10 male, median age of 28 years; range 21–41). CRP and suPAR were measured with ELISA in saliva and serum/plasma. suPAR was detected in all saliva samples in the 5.2–28.1 ng/mL range, with a median value of 17.1 ng/mL. Saliva suPAR was significantly higher (
Introduction
The urokinase-type plasminogen activator receptor (uPAR) is present on various immunologically active cells including monocytes, neutrophils, activated T lymphocytes, and macrophages, and also on endothelial cells, keratinocytes, fibroblasts, smooth muscle cells, megakaryocytes, and certain tumor cells.
1
uPAR consists of three homologous domains (DI, DII and DIII) and is linked to the cell surface by a glycosylphosphatidylinositol (GPI) anchor. Domain DI carries the main binding site for the urokinase-type plasminogen activator (uPA).
2
The binding of uPA to its receptor uPAR mediates a variety of cellular activities like migration, adhesion, differentiation, and proliferation.
1
A soluble bioactive form of uPAR (suPAR) is shredded or cleaved from the cell surface.
1
Full-length suPAR (suPARI–III) consists of all three domains but lacks the GPI anchor and can be cleaved into two soluble forms, suPARII–III and suPARI.
1
The soluble receptor has similar extracellular functions as uPAR
3
and has been detected in various body fluids, including blood, plasma, serum, urine, ovarian cystic fluid, and cerebrospinal fluid.1,4–6 In healthy individuals, suPAR levels are quite stable in both blood and urine, however, suPAR levels increase with age and are slightly higher in plasma from females when compared to males.
7
Several studies indicate that an elevated suPAR level in plasma is associated with a negative outcome in various diseases, including
Material and Methods
Sample Collection
This study included a total of 20 healthy volunteers (10 female and 10 male) with a median age of 28 years; range 21–41 years. All participants gave written consent and the study was conducted in accordance with the sixth revision of the Declaration of Helsinki. Participants were students recruited at Malmö University; all were nonsmokers and asked to refrain from eating 12 h prior to the sample collection. Weight and height were measured. Saliva and blood samples were collected in the morning (8–10 a.m.). After centrifugation, serum and plasma aliquots were immediately frozen at –20 °C. Unstimulated whole saliva was collected from the individuals using an oral swab (5001.02, Salimetrics, PA, USA). Participants rinsed their mouth with water and then the swab was placed under the tongue on the floor of the mouth for 1–2 minutes. After collection, the swab was centri-fuged at 1500×
suPAR in Plasma and Saliva
Plasma (EDTA) and saliva suPAR concentrations were analyzed using a commercially available enzyme immunoassay (suPARnostic™, Virogates, Copenhagen, Denmark) according to the manufacturer's instructions. The assay is a double monoclonal antibody sandwich assay that measures all circulating suPAR, including intact and cleaved forms of the receptor. The suPARnostic™ ELISA is recommended for EDTA plasma samples and hence spike, recovery, and linearity of dilution experiments were performed with saliva samples to validate the assay. Briefly, six saliva samples (with low, medium and high suPAR levels) were diluted 1:2 and 1:4 with the manufacturer's dilution buffer (PBS pH 7.4 with proprietary additives) and assayed after dilution. Linearity was defined relative to the calculated amount of suPAR based on the standard curve and was assessed by comparing observed vs. expected values based on undiluted samples. Spiked samples were prepared by adding three different concentrations of a spike stock solution to six saliva samples. Recoveries for spiked saliva samples were calculated by comparing observed vs. expected values based on the spiked controls. The diluent for the spike stock solution was the same as the standard diluent.
CRP in Serum and Saliva
A highly sensitive ELISA for determination of the CRP concentration in human serum was used (Oxis International Inc., CA, USA) according to the manufacturer's instructions. CRP in saliva was determined with a sandwich ELISA designed for measurement of saliva CRP (Salimetrics, PA, USA) according to the manufacturer's instructions.
Statistical Methods
All statistical analyses were performed with SPSS version 18. The linear association of variables was evaluated by using Pearson's correlation coefficient (r). The significance was tested using the paired t-test; statistical significance was considered at
Results
The results of CRP and suPAR measurements in blood and saliva are presented in Table 1.
suPAR and CRP in human saliva and blood.

suPAR in Plasma
suPAR in plasma was in the 1.04–4.01 ng/mL range. As depicted in Figure 1 the results indicate significantly different suPAR levels in plasma between male and female subjects,
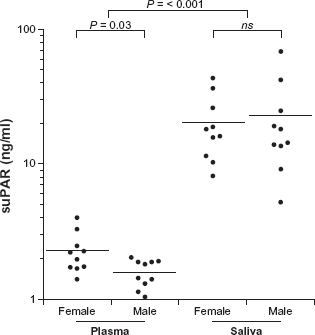
suPAR levels in plasma and saliva between female and male. Solid bars indicate mean values. suPAR was determined by suPARnostic™ ELISA.
suPAR in Saliva
suPAR was detected in all saliva samples (Fig. 1) and was in the 5.21–18.1 ng/mL range; median value =17.1 ng/mL. Saliva suPAR was significantly higher (
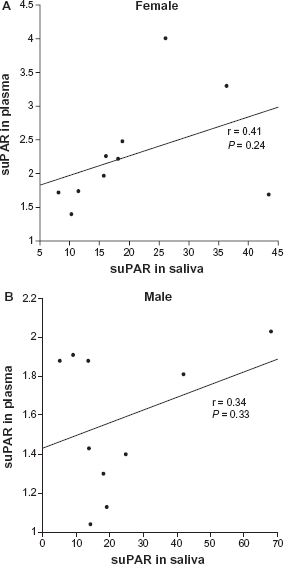
Correlation between saliva and plasma suPAR for female (A) and male (B).
Spike, recovery, and linearity of dilution experiments were conducted with saliva samples in order to validate and assess the accuracy of the suPARnostic™ ELISA. Values obtained for spiked samples are presented in Table 2; the recovery of added suPAR was in the 90%–93% range. Linearity of dilution experiments resulted in 104% ± 6% recovery at 1:2 dilutions and 102% ±11% recovery at 1:4 dilutions. The results indicated that the suPARnostic™ ELISA accurately measures suPAR in saliva. Additionally, suPAR in saliva collected with an oral swab was compared to saliva collected by passive drooling; both sampling methods yielded similar levels of suPAR.
Spike and recovery results for saliva samples analysed with suPARnostic™ ELISA. suPAR levels are presented as mean ± SD of six different saliva samples.

suPAR and CRP
Saliva CRP was significantly lower (
Discussion
To our knowledge, this study is the first to show that suPAR can be detected in saliva. The results show that saliva suPAR levels are significantly higher but not correlated to plasma suPAR levels. This is surprising considering that the level of most biomarkers is often significantly lower in saliva, compared to plasma/serum. Although some molecules diffuse or are actively transported into saliva from blood, others are synthesized by the salivary glands. The mode of entry of suPAR into saliva is not yet investigated, however, if saliva suPAR is locally synthesized, a correlation with plasma levels would not necessarily be expected. In the present study the participants had saliva suPAR concentrations that were about 12-fold higher than the corresponding plasma concentrations (Fig. 1). Such high concentrations of suPAR are not likely obtained without a high expression of uPAR in the oral cavity. Information about uPAR expression in the gingival tissue or salivary glands is limited, but its ligand, uPA, is expressed in gingival tissues.13,14 Furthermore, Virtanen el al 15 showed that uPA is expressed in the secretory cells of the salivary glands and secreted at low levels in saliva. Considering the high levels of saliva suPAR found in the present study and the fact that full-length suPAR is able to bind uPA, 16 an explanation for the low saliva uPA levels might be that the suPAR-uPA complex cannot be detected by the assay used. The role of suPAR in saliva is still unknown and further investigations are needed to establish the reasons for the high levels of saliva suPAR. It is worth stressing that an elevated suPAR concentration in saliva may be a consequence of periodontal inflammation. Oral health status was not investigated in this study; it would be of substantial value to examine if periodontal conditions affect the saliva suPAR level.
Saliva collection is non-invasive and easy to perform compared to blood drawing, but little is known about the biomarker expression levels in saliva. Saliva volume, viscosity, content of mucins, abundance of particulate matter, and bacterial load vary considerably between individuals. These factors have the potential to influence the reliability and validity of the measurements of saliva biomarkers. Saliva sample collection in this study was done with an oral swab; filtering saliva through an oral swab and centrifuging prior to the assay tend to minimize some of these sources of variation. Nevertheless, the swab collection yielded results similar to the ones from passive drooling collection (result not shown). Saliva suPAR was measured with the commercially available suPARnostic™ ELISA, developed and recommended for EDTA-plasma. However, recovery studies show that saliva is a suitable medium for this assay. In addition, the same ELISA has been used to measure suPAR in urine 4 and cerebrospinal fluid 6 with reproducible results.
According to Eugen-Olsen et al, 7 a normal plasma suPAR range for healthy individuals 20–30 years of age, is 2.5–2.9 ng/mL for females and 1.5–2.5 ng/mL for males. Similar results have been found in this study with the exception of one female subject (age 24, BMI 31) who had a slightly high plasma suPAR value at 4.0 ng/mL, she also had a saliva suPAR level above mean (26 ng/mL). Likewise, the man (age 31, BMI 28) with the highest plasma suPAR (2.0 ng/mL) also had the highest saliva suPAR among the male subjects. Hence, it would be of considerable value to measure saliva suPAR in different populations, with expected high or low plasma suPAR.
CRP is an acute phase marker and currently the best quantitative measure of an ongoing inflammation and hence, associations between suPAR and CRP were investigated. CRP and suPAR levels were correlated in blood but not in saliva, among the females in this study. A number of studies focused on correlations between CRP and suPAR in blood show conflicting results,11,17,18 for example, early studies done by Slot et al 19 demonstrated that suPAR and CRP correlated in patients with rheumatoid arthritis but not in patients with reactive arthritis. A prospective cohort study by Eugen-Olsen et al 7 including 2602 individuals (ages 41–71) established a moderate positive correlation between CRP and suPAR in serum/plasma. Also, a lack of association between BMI and plasma suPAR but a correlation between BMI and CRP was demonstrated, in agreement with this study. Their theory was that CRP and suPAR may reflect different inflammatory aspects, and thus suPAR appears less related to dysmetabolic conditions.
In the present study there was no saliva-serum CRP correlation; the results are consistent with a previously published study 20 which also measured saliva and plasma levels of CRP in a young healthy subject group. On the other hand, a study by Quellet-Morin et al 21 observed a moderate to strong association between CPR in saliva and serum. A lower correlation was found at serum CRP levels below 2.0 mg/L in comparison to high CRP levels (≥2.0 mg/L), suggesting that the prediction of serum CRP levels from saliva CRP levels is more accurate at higher serum concentrations. In addition, Punyadeera et al 22 demonstrated a correlation between saliva and serum CRP at serum concentrations above 5 mg/mL. In the present study none of the subjects had serum CRP concentrations higher than 3.7 mg/L. In healthy individuals, normal CRP levels are generally considered to be <3 mg/L. Low-grade inflammation can produce minor elevations of CRP in the 3–10 mg/L range while CRP levels higher than about 10 mg/L are typically associated with infection. 23 Salivary CRP levels in the present study are in agreement with previously published data by Dillon et al and Ouellet-Morin et al.20,21 Five of the participants had saliva CRP levels higher than 2 SD from the mean, ie, 6.2 μg/mL in healthy adults, according to the kit manufacturer. Correspondingly high values were not observed from serum CRP. The high CRP saliva samples were serially diluted and re-analyzed; the dilutions followed a linear scale. Nevertheless, there was still no saliva-serum CRP correlation when excluding those five extreme values from the analysis. Quellet-Morin et al 21 also reported 10 (of totally 61 participants) extreme saliva CRP values that could not be explained by biological or clinical variables (poor precision of the assay, blood contamination, saliva pH, or the participants health conditions).
In conclusion, our results indicate that suPAR levels are higher in saliva than plasma but saliva and plasma suPAR are not correlated in healthy young adults with normal plasma suPAR levels. It is obvious that correlations established in the present study are of limited value due to the small cohort. However, the results obtained point to some interesting issues to be explored in future studies. The mechanism by which suPAR is carried from blood to saliva needs to be further investigated, taking into consideration that elevated saliva suPAR levels may be a product of local synthesis in the gingival tissue or the saliva glands.
It has been suggested that plasma suPAR may be a general marker of low grade inflammatory processes and that elevated suPAR levels correlate with risks of developing cancer, diabetes, and cardiovascular disease in the general population.7,10,11 Hence, it would be of considerable value to explore if saliva suPAR also could be a marker similar to plasma suPAR; measuring saliva suPAR is straightforward and non-invasive, facilitating screening in large populations.
Disclosures
Author(s) have provided signed confirmations to the publisher of their compliance with all applicable legal and ethical obligations in respect to declaration of conflicts of interest, funding, authorship and contributorship, and compliance with ethical requirements in respect to treatment of human and animal test subjects. If this article contains identifiable human subject(s) author(s) were required to supply signed patient consent prior to publication. Author(s) have confirmed that the published article is unique and not under consideration nor published by any other publication and that they have consent to reproduce any copyrighted material. The peer reviewers declared no conflicts of interest.