
Abstract
Detection of differential gene expression using microarray technology has received considerable interest in cancer research studies. Recently, many researchers discovered that oncogenes may be activated in some but not all samples in a given disease group. The existing statistical tools for detecting differentially expressed genes in a subset of the disease group mainly include cancer outlier profile analysis (COPA), outlier sum (OS), outlier robust t-statistic (ORT) and maximum ordered subset t-statistics (MOST). In this study, another approach named Least Sum of Ordered Subset Square t-statistic (LSOSS) is proposed. The results of our simulation studies indicated that LSOSS often has more power than previous statistical methods. When applied to real human breast and prostate cancer data sets, LSOSS was competitive in terms of the biological relevance of top ranked genes. Furthermore, a modified hierarchical clustering method was developed to classify the heterogeneous gene activation patterns of human breast cancer samples based on the significant genes detected by LSOSS. Three classes of gene activation patterns, which correspond to estrogen receptor (ER)+, ER– and a mixture of ER+ and ER–, were detected and each class was assigned a different gene signature.
Introduction
The most widely used method for detecting differential gene expression in comparative microarray studies is the two-sample t-statistic. A gene is determined to be significant if the absolute t-value exceeds a certain threshold c, which is usually determined by its corresponding P-value or false discovery rate. Recently, Tomlins et al 1 introduced the cancer outlier profile analysis (COPA) method for detecting cancer genes which are differentially expressed in a subset of disease samples. Heterogeneous patterns of oncogene activation were observed in the majority of cancer types considered in their studies. Thereafter, several further studies in this direction have been proposed. Tibshirani and Hastie 2 introduced the outlier sums (OS) method, Wu 3 proposed the outlier robust t- statistic (ORT), and Lian 4 introduced the maximum ordered subset t-statistics (MOST) procedure.
In this study, a simple statistical test named Least Sum of Ordered Subset Square t-statistic (LSOSS) is proposed for detecting cancer outlier differential gene expression. The performance of LSOSS was compared to existing procedures using both simulated and real data sets. Furthermore, we extended previous studies by classifying heterogeneous gene activation patterns of human breast cancer.
Existing statistical methods
Assuming case-control microarray data were generated for detecting differentially expressed genes consisting of n samples from a normal group and m samples from a cancer group. Let x
The two-condition t-statistic for gene i is defined by:


The t-statistic is powerful when most cancer samples are activated.
Tomlins et al
1
defines the COPA statistic as


The COPA statistic uses a fixed rth sample percentile, which is determined by users. This limitation was overcome by the OS statistic
2
defined by:


Wu
3
modified the OS statistic by proposing the ORT statistic which consists mainly in changing the definition of R


μ
Methods
The least sum of ordered subset variance t-statistic
In our proposed method, least sum of ordered subset square t-statistic (LSOSS), mean expression values in normal and cancer samples were considered instead of median expression values. Our hypothesis was that if outliers are present among cancer samples, the distribution of gene expression values in cancer samples will have two peaks. The higher peak corresponds to activated samples while the lower peak indicates inactivated samples. Consequently, this outlier issue can be addressed through the idea of detecting a “change point” or “break point” in the ordered gene expression values of the cancer group. A model related to fitting least squares should be effective for this goal. For each gene, an optimal change point in its expression can be detected and could be used to investigate potential outliers in cancer samples. To this end, we propose the Least Sum of Ordered Subset Square t-statistic (LSOSS). The general idea of LSOSS is to use the sum of squares of two ordered subsets of cancer samples to estimate the square sum of the t-statistic and to use the mean value of the appealing subset of cancer samples to estimate the mean value of cancer samples of the t-statistic.
The proposed LSOSS method involves the following steps:
For each gene i, the expression levels in cancer samples are sorted in descending order and then divided into two subsets:

For the two subsets, the mean and sum of squares for each gene i are calculated:
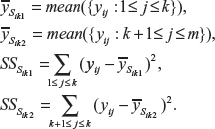
The only issue left to be solved is the value k that divided the two subsets. For that purpose an exhaustive search was implemented for all possible values ranging from 1 to m-1. The optimum value of k is obtained by minimizing the pooled sum of squares for cancer samples given by:

Let s
ix
2 be the sum of squares for normal samples given by:

The pooled standard error estimated for gene i is defined by

The LSOSS statistic for declaring a gene i with outlier differential expression in case samples is computed as:

(
A modified hierarchical clustering method for classification of heterogeneous gene activation patterns of human breast cancer
We developed a modified hierarchical clustering method for classification of heterogeneous gene activation patterns of human breast cancer samples. 100 permutations were conducted in order to assign a P-value for each gene. The top d genes detected by LSOSS, at the P-value <0.05, were selected for further analysis. For each gene i, the cancer samples that were selected as outliers were marked by 1 and the rest were marked by 0:
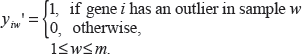
Thus, each cancer sample w can be represented by a vector with a rank d consisting of 0 or 1:

For each cancer sample, the number of 1's indicates the number of genes with outlier expression in that sample compared to other case samples. The similarity between any two cancer samples w and v was denoted by the number of common outlier expression, which can be obtained by counting the number of 1's computed by
Results
Simulation studies
Simulation studies were conducted to compare the performance of LSOSS with those of MOST, ORT, OS, COPA and the t-statistic. To this end, the R source code from Lian 4 was used. The simulation was conducted assuming equal number of normal and cancer samples (n = m = 20) and the expression data was generated from a standard normal distribution. Expression for 2000 genes were simulated, of which 1000 genes were assumed to be differentially expressed and their data was generated by adding a constant, u, to their expression in the first k cancer samples.
The receiver operating characteristic (ROC) curve was used for evaluating the performance of the different statistical methods. Figure 1 shows the ROC curves for different combinations of k and u. When k = 10 and u = 2, LSOSS clearly outperforms others methods and was second best when k = 5 or 15 and u = 2. When k = 20 and u = 2, LSOSS was comparable to ORT and better than OS and COPA. When u is decreased to 1 with k = 10, LSOSS is the only method comparable to the t-statistic. LSOSS shows a low sensitivity when k = 2. However, the case where only one or two samples are activated within a large number of cancer samples may be less realistic. Overall, the performance of LSOSS is appealing in terms of detection power.
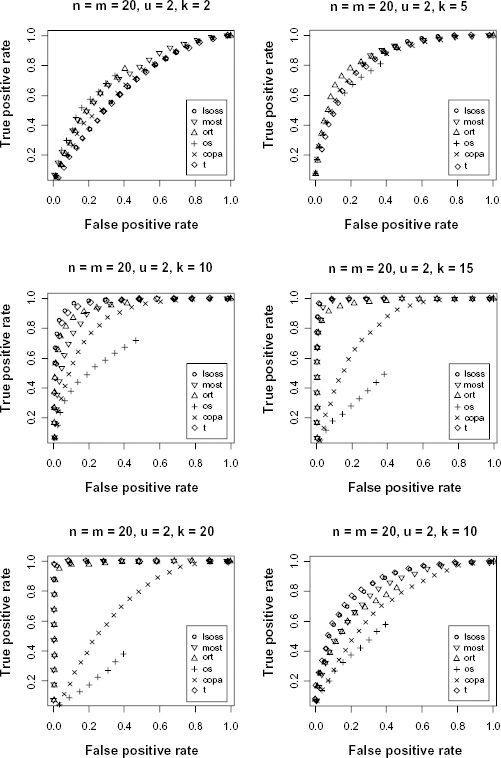
ROC curves comparing different statistical methods.
Application to human breast cancer data
The breast cancer microarray data from West et al 5 is available at http://data.cgt.duke.edu/west.php. The data were normalized by the quantile method 6 and the log transformation of the expression values were used for the following analysis. There are in all 7129 genes and 49 tumor samples in this dataset. Among them, 25 tumor samples have negative lymph nodes (LN–) and 24 tumor samples have positive lymph nodes (LN+). We treated the negative LN samples as the control group and the positive LN samples as the cancer group. Genes with expression below a certain threshold (log(10)) in at least 20 samples were removed from the analysis. When evaluating LSOSS based on human breast cancer data, we studied how many genes among the top 25 genes selected separately by different statistical approaches showed biological relevance in the literature. The numbers of breast cancer related genes identified by existing methods (Table 1) were 8, 8, 4, 3, and 2 for MOST, ORT, OS, the t-statistics, and COPA, respectively. However, our proposed method (LSOSS) has identified 9 breast cancer related genes: KCNH2, 7 NEO1, 8 MAGEA3, 9 ENG, 10 GABRG2, 11 ATM, 12 NUP88, 13 CYP3A7 14 and PMP22. 15 Although it should not be treated as a golden standard method for evaluating different statistical tools, this type of analysis generally validates the statistical results and highlights their biological relevance.
Genes confirmed to be associated with breast cancer that are ranked on the top 25 identified using different cancer outlier detection approaches.

Application to human prostate cancer data
To further assess the performance of LSOSS on real data, we downloaded a human prostate cancer dataset. 16 This dataset, generated by the Affymetrix HG-U95av2 chip, consists of 52 prostate tumor samples and 50 normal adjacent samples. The raw data were converted to expression values using a robust multi-array average (RMA) approach. 17 Different statistical methods were run on this dataset and their performances was evaluated by the number of genes among the top 25 genes selected by each approach known to have biological relevance according to the National Cancer Institute Cancer Gene Index, available at https://cabig.nci.nih.gov/inventory/data-resources/cancer-gene-index/. The comparison of these different statistical approaches is summarized in Table 2. LSOSS, which identifies 5 prostate cancer related genes RB1, 18 UBE2E3, 19 BMI1, 20 BTG2 21 and ELF1, 22 was the best approach with this dataset.
Genes confirmed to be associated with prostate cancer that are ranked on the top 25 identified using different cancer outlier detection approaches.

Classification of heterogeneous gene activation patterns of human breast cancer
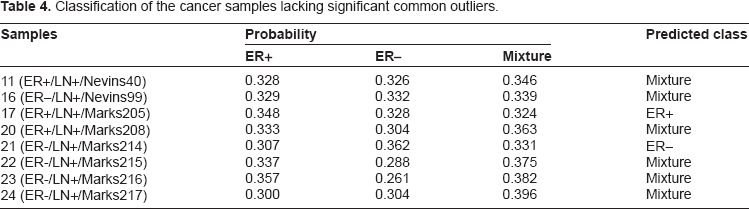
Breast cancer is a heterogeneous disease.23,24 Although a number of candidate cancer outliers were identified by existing tools, the heterogeneous gene activation patterns of cancer samples were not addressed after the usage of such methods. LSOSS was applied to the human breast cancer data set from West et al. 5 At a P-value cutoff of 0.05, 228 genes were selected for further analysis. The hierarchical clustering method described in the Methods section was then implemented. Three main classes of heterogeneous activation patterns of human breast cancer were observed (Fig. 2). The samples and common outliers in each class are shown in Table 3. Interestingly, we found that the first class consists of 6 ER+ samples, the second class consists of 5 ER– samples, and the third class is a mixture of 4 ER+ and 1 ER– samples. The common outlier genes in each class are regarded as its genetic signature. It is worth noting that although some genes may be part of the genetic signature of different classes of cancer samples, each class has a unique gene signature. For the remaining 8 cancer samples without significant common outliers, their classes were assigned according to their coverage of the gene signatures for different classes (Table 4). Among them, 6 were classified into the mixture group and two others were classified into ER+ and ER– groups.

Color image for classification of heterogeneous gene activation patterns of human breast cancer.
Classes and biomarkers of heterogeneous gene activation patterns of human breast cancer.

Data are shown in the format of “sample index (sample name)”;
Data are shown in the format of “gene ranking (gene symbol)”.
Classification of the cancer samples lacking significant common outliers.
Discussion and Conclusions
Unraveling the heterogeneous patterns of cancer samples is an important goal in medical research, especially for clinical diagnosis and the molecular understanding of cancer mechanisms. The heterogeneous patterns of oncogene activation have been well studied and several useful statistical tools have been proposed. LSOSS is a reasonable model to detect cancer outlier differential gene expression. For each gene, LSOSS tries to find an optimal “change point” in the ordered expression values of cancer samples. If one gene is expressed heterogeneously in cancer samples, the variance of gene expression values in cancer samples is overestimated by the t-statistic while LSOSS gives an appropriate estimate. Furthermore, LSOSS uses the mean value of the appealing subset instead of the overall mean value of the cancer samples. Thus, LSOSS detects cancer outliers more easily. If one gene is expressed homogeneously in cancer samples, LSOSS still works well because it behaves similarly to the t-statistic because the mean values of two subsets are expected to be very close in this case.
However, a single oncogene with heterogeneous expression cannot fully account for the heterogeneous gene activation patterns of cancer samples as the synergic and epistatic effects among multiple oncegenes should not be neglected. Thus, it is necessary to classify cancer samples and assign each class a specific gene signature. This goal, if achieved, will definitely facilitate the understanding of different underlying pathologies and genetics for heterogeneous cancers. Our proposed scheme could be a useful tool toward this goal. Three classes of heterogeneous gene activation patterns of human breast cancer were detected with specific gene signatures. In addition, these heterogeneous gene activation patterns may be regarded as the signatures for subtypes of human breast cancer. Thus, the procedure presented could also be useful in detecting and classifying breast cancer subtypes. The classification of breast cancer subtypes has been well discussed.25–28 Our approach, however, differed from previous studies mainly in that the classification is based on different combinational activation patterns of candidate genes instead of clustering their expression values. The detection of specific gene interactions accounting for heterogeneous gene activation patterns of cancers is our next goal in this direction.
Disclosure
This manuscript has been read and approved by all authors. This paper is unique and is not under consideration by any other publication and has not been published elsewhere. The authors and peer reviewers of this paper report no conflicts of interest. The authors confirm that they have permission to reproduce any copyrighted material.
Footnotes
Acknowledgements
We thank Jamie Williams for critical reading of the manuscript. This study was supported in part by resources and technical expertise from the University of Georgia Research Computing Center, a partnership between the Office of the Vice President for Research and the Office of the Chief Information Officer.