
Abstract
Cow's milk is economically important to the agricultural industry with the nutritive value of milk being routinely measured. This does not give full insight into normal mammary tissue turnover during the course of lactation, which could be important for both an understanding of milk production and animal welfare. We have previously demonstrated that submicron particles, including extracellular vesicles (EVs), can be measured in unprocessed cow's milk by flow cytometry and that they correlate with stage of lactation. A number of different techniques are available to measure EVs and other milk-derived particles. The purpose of this study was to compare two different methodologies and the value of fluorescent staining for the phospholipid phosphatidylserine (PS), which is exposed on the surface of EVs (but not other milk-derived particles). We used two different flow cytometers and nanotracker analysis to detect milk-derived particles in whole and skimmed milk samples. Our findings indicate significant correlation, after staining for PS, suggesting potential for larger multicenter studies in the future.
Introduction
Cow's milk is an economically important product to the agricultural industry and is, currently, a largely untapped resource for providing information about its production and composition. Traditionally, the nutritive value of milk (fat, protein, and lactose percentage) has been routinely measured, but more recent studies have demonstrated that milk can be used to predict greenhouse gas emissions from cows 1 and also to show the composition of fats. 2 We have attempted to use a variety of different measurements on milk samples, after minimal processing, to help understand the underlying biology of the lactation curve, including how mammary epithelial cell turnover affects lactation. 3
Extracellular vesicles (EVs) are rapidly emerging as important biomarkers for health and disease. They are found in all bodily fluids so far examined, including plasma, urine, tears, saliva, sweat, and milk, 4 and have also been demonstrated in plant matter and microorganisms. 5 EVs are released from a wide range of cells, including immune cells, endothelial cells, and epithelial cells. The release of EVs from progenitor cells is believed to be an important way in which stem cells are able to function. 6 Increased numbers of EVs have been measured in patients with cancer, and it has been shown that they are important for metastasis, 6 while they are also increased in obesity and cardiovascular disease and are an important component of chronic inflammatory disorders. 4 They carry a range of cargo, including protein, mRNA, and importantly miRNA, 5 which can be delivered to distant cells within the organism, leading to changes in the recipient cell behavior and metabolism. Cargo is packaged by the parent cell in a regulated way, and there is increasing evidence that not only the number of released EVs but also the range of cargo may differ depending on the activation state of that cell. EVs are therefore collectively believed to act as vehicles to enable intercellular trafficking of large molecules that would otherwise be cleared from the circulation, sometimes called “rececrine” signaling. EVs have also been shown to facilitate communication between a host organism and its microbiota and between mother and suckling offspring when released into milk, 7 and, as an unintended consequence of this, EVs may also participate in interspecies communication when they enter the food chain. 8
Although first described many years ago as “platelet dust”, 9 EVs have now been subclassified into three (or sometimes more) main groupings, including exosomes (50–150-nm vesicles, formed via an endocytic pathway), microvesicles (MVs; sometimes referred to as microparticles, 100–2000 nm and formed by budding out of the plasma membrane in a calcium-dependent regulated process), and apoptotic bodies (>1000 nm) formed by blebbing of the plasma membrane as cells undergo apoptosis. All the three classes of EVs share some characteristics, and, importantly for their identification as biomarkers, they are often decorated with phosphatidyl-serine (PS). During vesicle formation, the plasma membrane may lose its membrane asymmetry, exposing PS on the outer leaflet. This facilitates EV identification by means of binding to Annexin V, which can be labeled with a variety of fluorochromes to aid detection and quantification. 10 The release of EVs and the nature of the cargo within may be related to the activation state of the parent cell, 5 ie, whether the cell has been subject to pro-inflammatory stimulus or is undergoing normal cellular metabolic processes or apoptosis. There is also potential to determine the identity of the parent cell, whether from resident mammary epithelial cells or from infiltrating white blood cells such as tissue macrophages and neutrophils. Therefore, characterization of EVs in milk in the context of a mixed population of milk-derived particles at different stages of lactation may provide additional information about the normal turnover and inflammatory status of the mammary gland.
Measurement of EVs has been demonstrated using a range of different techniques, with compromises to be made in terms of sample volume, time to prepare and analyze individual samples, and the nature of the qualitative and quantitative information gathered. 4 We have previously described the measurement of MVs in cow's milk using a flow cytometric approach, where we demonstrated a correlation between the numbers of MVs detected in whole milk (WM) samples and the stage of lactation. 3 One of the disadvantages of the instrumentation used for our previous study was that it was not able to detect particles smaller than approximately 200 nm. Thus, important populations such as exosomes could not be reliably measured using this technique. The objectives of the current study were to investigate three different instruments for measuring particles in raw milk, to determine the EV fraction (based on PS positivity), and to compare the results for skimmed milk (SM) and WM. We wanted to determine whether any of the techniques could be suitable without extensive prior processing of samples as this would not be feasible for large sequential studies comprising commercial herd(s), typically over 100 animals per sampling, and distributed over a wide geographical area, in order to compare a wide range of factors including herd genetics and different management regimes in the future. Several methods have been described for the detection of EV. 11 Electron microscopy is widely regarded as the gold standard for EV detection; however, preparation of samples is time-consuming and the results are not quantitative. In contrast, flow cytometry has been used extensively for the measurement of EVs from a range of different sources, but there are some limitations. In this study, we compared the same set of samples using two different flow cytometers (a Becton Dickinson FACS Canto II and a Beckman Coulter Cytoflex) and a Nanosight NS500. Flow cytometers work by measuring the number of single particles (often cells in suspension) that pass a laser beam in a single stream. However, events are also discriminated on size, and additional properties such as granularity (for cells), as well as the presence of characteristic markers with the addition of fluorescently conjugated antibodies or stains. Older instruments, such as the Canto II, typically have a limit of detection of particles, ie, between 200 and 340 nm size,12,13 so are only able to measure MV populations. This has been reduced to 100–150 nm using newer laser technology such as in the Cytoflex instrument, enabling the measurement of some exo-somes and MVs. A recognized limitation of flow cytometric analysis of EVs is the phenomenon of swarm detection, where the presence of a cluster of several small vesicles below the lower limit of detection for the instrument is detected as one larger vesicle by the laser. 14 This can lead to inaccuracies of measurement. Nanotracking analysis (NTA) works on a different principle such that particles in suspension are identified based on their light scattering properties and Brownian motion that enables the calculation of particle size distribution and particle concentration and can measure smaller particle sizes that can be lower than 50 nm for highly refractive particles. All the instruments used in this study were additionally able to distinguish PS-positive and PS-negative populations using Annexin V staining. An important aspect of this study was to determine whether any comparisons of vesicle number could be made with a simple collection and storage protocol and minimal manipulation of the milk samples prior to analysis, since extensive isolation protocols are not feasible for large inter-herd studies, which may involve analysis of several hundred samples on a monthly basis.
Materials and Methods
Samples
The milk samples used in this study were from a larger study designed to investigate factors affecting EV density in milk collected from a commercial dairy herd systematically throughout lactation. The herd was located on the Boltons Park Farm of the Royal Veterinary College at Potters Bar, Hertfordshire, UK. All milking animals in the 100-cow herd were sampled monthly throughout lactation, on the day that the milk recorder from the National Milk Records service visited. Foremilk samples were collected regularly between December 2014 and March 2015 from each cow. The cows were from different ages and stages of lactation but were all Holsteins managed commercially and were due to be milked throughout the experimental period. Milk was collected during the morning milking, after udders had been cleaned and stripped, into 50-mL Falcon tubes (ThermoFisher). The samples used in this study were from a randomly selected group of 10 cows at one time point. They were not subjected to any experimental procedures, over and above the normal day-to-day practices of such a herd and milk sampling during milking.
Laboratory preparation
Samples were transported back to the laboratory on ice, for processing within three hours of collection. Each sample was split into two- and one-half used as WM, while the other half had the fat removed (SM) by centrifugation at 1500 ×g for 10 minutes at 4 °C, in a Sorvall Legend XFR with TX750 swing-out rotor (ThermoFisher). WM and SM samples were aliquoted into 2-mL samples and snap frozen at −80 °C.
Flow cytometry I (Canto II; FACS)
Milk samples were prepared for analysis as described earlier. 3 Briefly, samples were thawed on ice and 2 μL was diluted with 198-μL 0.22-μm filter-sterilized 1× Annexin V buffer (eBioscience). Then, 2-μL Annexin V – PE-Cy7.7 was added to 50-μL diluted sample followed by incubation on ice for 15 minutes. Then, 450-μL 1× Annexin V buffer was added, and immediately prior to analysis by flow cytometry 10-μL FlowCount absolute counting beads (Beckman Coulter) and 1-μL 1.1-μm latex beads (Sigma), previously diluted 1:1000 from manufacturer's stock, were added to each tube. Acquisition was for two minutes at a low flow rate using a FACS Canto II (Becton Dickinson), which was calibrated daily using Cytometer, Set-up and Tracking (CST) beads (Becton Dickinson) according to the manufacturer's instructions. Buffer alone and both sizing and enumeration beads alone were analyzed prior to sample acquisition to ensure that any background noise was eliminated from the gates used for post-acquisition analysis. Postacquisition analysis was performed using DIVA 6.0 software (Becton Dickinson) as described earlier 3 and as shown in Figure 1A-D for representative plots showing gated sizing bead, enumeration bead, and EV populations. A single dilution of milk sample was used based on our previous study. 3
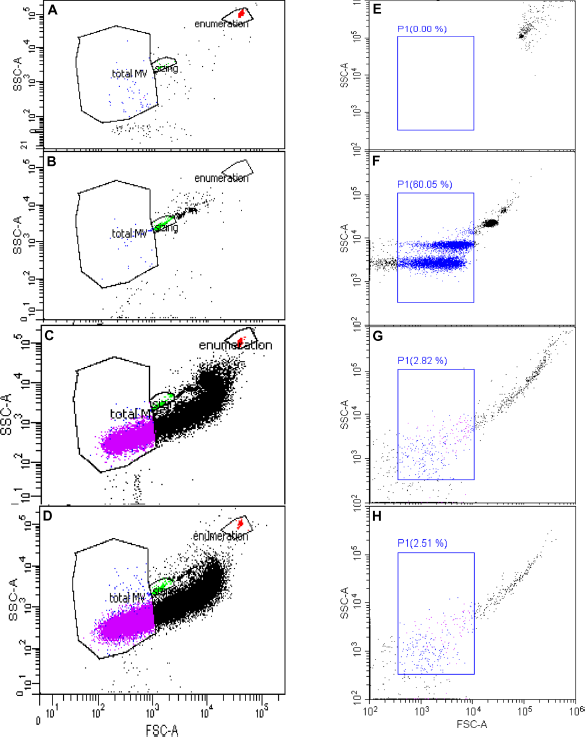
Representative plots of flow cytometric analysis of the same milk samples. (
Flow cytometry II (Cytoflex; CYTO)
Samples were prepared as mentioned earlier. Briefly, they were diluted (1:100) in 1× Annexin V buffer and 50 μL was stained with 2-μL Annexin V PE-Cy7.7 for 15 minutes on ice. They were diluted with 450-μL 1× Annexin V buffer and immediately analyzed using a Cytoflex flow cytometer (Beckman Coulter) at low flow rate, with 10,000 events. The instrument was calibrated with Cytoflex Daily QC Fluorospheres according to the manufacturer's instructions followed by Megamix-Plus FSC reagent (0.1, 0.3, 0.5, and 0.9 μm; Biocytex; Diagnostica Stago) and FlowCount beads. Buffer alone was analyzed prior to sample acquisition to ensure that any background noise was eliminated from the gates used for post-acquisition analysis. Post acquisition analysis was carried out using CytExpert analysis software (Beckman Coulter). Representative plots showing enumeration beads, Megamix beads, and gated EV populations are shown in Figure 1E-H. A single dilution of each milk sample was used based on our initial optimization (data not shown).
NTA (Nanosight NS500)
1-uL of milk sample was added to 49-μL 1× Annexin V buffer and 2-μL Annexin V PE-Cy7.7 for 15 minutes on ice. They were further diluted to 1:100,000 and analyzed using a Nanosight NS500 (Malvern Instruments). Samples were analyzed as described earlier. 15 Briefly, 5 × 30-second videos of light scattering at camera level 12 were recorded and analyzed using automated analysis software settings (NTA 2.3; Malvern Instruments). Fluorescence measurements were made under flow conditions at camera level 16 with a 500-nm long pass filter. A single dilution of each milk sample was used based on our initial optimization (data not shown).
Statistical analysis
The 20 milk samples (10 WM and 10 SM) were analyzed in a variety of ways. First, in order to see if there was a difference between WM and SM, paired comparison t-tests were conducted within machine for the three different EV measurements together (total [TOT], Annexin V+ [AnnV+], and Annexin V– [AnnV–]). The Pearson correlation coefficients between SM and WM results were also calculated from these data (n = 30). Next, all the results from the three machines were analyzed by linear regression and the Pearson correlation coefficients between each pair of machines calculated (n = 60).
Results
A summary of the measurements by milk type, particle type, and instrument is shown in Table 1. Bearing in mind that each cell in Table 1 contained the same 10 milk samples, the interesting aspect is the consistency, or lack, of results in each column. Within each particle type, the columns are consistent except for CANTO measurements, where SM results were considerably less than the WM results. Between the three instruments, there was little consistency. For AnnV+, CANTO = NTA > 50× CYTO except for WM FACS.
Mean and SD of particles (number/μL) by particle type, milk type, and instrument.

SM versus WM
The 10 samples of milk were divided into two, with one half prepared as SM and the other half as WM for analysis. The plots of SM versus WM for TOT and AnnV+ EV number/μL were combined and are shown in Figure 2 for each of the three machines. The correlations between the two sets of measurements (± standard error [SE]) were 0.88 ± 0.05 (CANTO), 0.96 ± 0.03 (CYTO), and 0.79 ± 0.07 (NTA); all significantly greater than 0. Assuming no difference between the means for SM and WM within each machine, the paired-comparison t-test probabilities were <0.001 (CANTO), 0.95 (CYTO), and 0.84 (NTA). Because the CANTO data showed a skewed distribution, due to a few very large values, the data were log transformed and the resulting non-skewed data reanalyzed. This resulted in the paired-comparison t-test having a probability of <0.001, a similar result to the untransformed data.
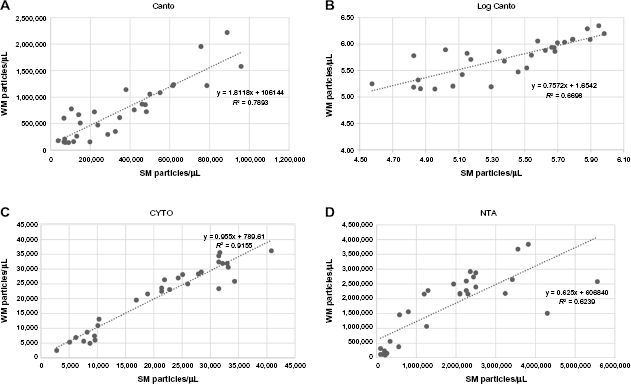
The relationship between particle density measurements from whole and skimmed samples from the same milk, by the three instruments. (
These results suggest that there was virtually no difference between the CYTO results for WM and SM, slightly more difference between them for the NTA and a real difference in the CANTO results.
Comparison of the three machines
Figure 3 shows the results of plotting the measurements from each machine against that from each other machine (n = 60; 10 samples, WM and SM, AnnV+, AnnV-, TOT). The readings from the CANTO machine had virtually no relationship with the other two (correlations, ~0.15 in each case; not significant [NS]), but the CYTO and NTA had a correlation of 0.75, significantly greater than 0. Reanalyzing the log-transformed CANTO data made no difference to these results.

The relationship between the same particle measurements taken on the three machines, irrespective of SM/WM or type of particles. (
This implies that the CANTO was measuring a different fraction of particle characteristics from the other two. The CYTO and NTA machine clearly were measuring similar characteristics of the milk samples but were about two orders of magnitude, as shown by the regression coefficient, ie, NTA = (90 × CYTO) − 143,489.
Comparison of the three machines within milk type
In order to investigate whether there was any effect of SM or WM on the relationships between the three machines, the data were analyzed within milk type (Table 2). First, the correlations involving WM were always greater than those involving SM, with the exception of NTA. Second, the correlations between CYTO and NTA were always the largest by a considerable margin. Third, the correlations between CANTO and LogFACS were high but not close to 1. These results indicate that the relationship between instruments was affected by the type of milk analyzed to the same degree.
The correlations between the three machines calculated within milk type.

Comparison of the three machines within EV type
Correlations were calculated between the results of the three machines within particle type (Table 3). These correlations differed from those seen earlier. In Table 3, it was the correlation between CANTO and CYTO was significant for AnnV+ but not for TOT. No other correlations were different from zero. This contrasts strongly from the results within milk type, where CYTO and NTA were highly related.
The correlations between the three machines calculated within particle type.

Comparison of results by machine, measurement type, and milk type
A further breakdown of correlations was calculated within milk type, particle type, and machine and is shown in Table 4. Once again, there was no relationship between CYTO and NTA within any grouping. However, the results from the CANTO were related to CYTO and NTA but varied depending on the type of milk sampled and the type of particles measured. There was a more significant correlation between the data obtained from CANTO and CYTO when taking into account the Annexin V positivity of particles in both the WM and SM fractions (Table 4).
The correlations between the three machines calculated within particle type and milk type.

Particle size
The Nanosight instrument provided data on the distribution of particles by size within the milk samples. Figure 4 plots the distribution of particles size for total particles and AnnV+ EVs for WM and SM measured by NTA. Considering the total particle results first, there were more in the 105–175-nm range in the SM compared to the WM, but above this range there were more particles in the WM. The results from the Annexin V-stained samples were rather different. In this case, the WM samples had considerably more particles of all sizes in the range of 20–400 nm.

The distribution of particles size for total and AnnV+ particles for WM and SM, measured by NTA. (
The three instruments used in this comparison all measured a slightly different range of particle sizes: CANTO 200–1000 nm, CYTO 100–1000 nm, and the NTA 1–2000 nm. Given that there were no particles >600 nm found in the NTA results, then the difference between the instruments was in their ability to measure small particles. Figure 4 indicates that 10% of all particles would not have been measured by the CYTO and 73% by the CANTO instruments. However, taking the given measurement ranges for each machine and correlating the total number of particles measured in those ranges using the NTA data, then the correlations between the machines were between 0.96 (correlations involving CANTO) and 0.99 (CYTO and NTA). This indicates that although the ranges of particles measured by each instrument may vary, their relative measurements should have been similar.
Discussion
The aim of this study was to investigate three different instruments for measuring milk-derived particles and PS-positive EVs in raw and minimally processed milk in order to determine whether results obtained using different methods could be compared. This is important when considering using one of these methods to analyze milk derived-particles at different stages of lactation in large multicenter studies in the future, where the typical herd size will be 100 or more cows from each farm, to be analyzed on a monthly basis. Based on the analysis shown in Tables 1–4, although the values obtained for particle concentration were numerically different (Table 1), there was a significant correlation in the values obtained from measurements taken using the Cytoflex and Nanosight instruments but not the Canto (Table 2, Fig. 2). As also expected, the results from WM and SM samples correlated very well when analyzing data obtained from both the Cytoflex and Nanosight (Fig. 2C and D). However, there was no significant correlation when comparing particle counts obtained from WM and SM using the Canto (Fig. 2A and B). This may be because the Canto additionally measures milk fat globules, which do not characteristically have exposed PS but are removed during the skimming protocol due to their lower density. Interestingly, there were a higher proportion of AnnV+ particles measured in both SM and WM on the Canto compared to the other instruments (Table 1). When the presence of exposed PS (Annexin V staining) was taken into account (Table 3), there was a correlation between the data obtained from Cytoflex and Canto for the AnnV+ population but no correlation between the three machines for the total population (Table 3). Further analysis to take into account both milk processing and Annexin V positivity revealed correlation between results obtained with the Canto and both the Cytoflex and NTA for the AnnV+ population analyzed in WM sample (Table 4). This is of particular interest, because we previously showed that the AnnV+ particle population in WM correlated with day of lactation (days in milk) of individual cows within our herd. 3 Finally, when size distribution was taken into account (Fig. 4), there would be significant correlations in the measurements between all the three machines if they performed in the same way as the Nanosight measurements would indicate. There is, however, increasing evidence that a large proportion of EVs circulating in plasma 16 or released from cells during in vitro culture do not display PS and therefore are not able to bind Annexin V efficiently and that the PS status may change during maturation and differentiation of cells, 17 which merits further investigation of an additional marker for milk-derived EVs, to distinguish them from other milk-derived particles of similar size. The difference in the percentages of AnnV+ and AnnV– particles between the different machines may reflect the size of the different subpopulations that have been measured in this study. It has also been noted that smaller sized particles have a greater curvature of their outer leaflet, and so even though PS may be randomly distributed between the two leaflets of their membrane, up to two thirds will actually be displayed on the outside. 18
It is important to note that for this study we did not isolate individual populations of milk-derived particles. The isolation of exosomes and other individual EV populations is possible from cow's milk but in our experience requires several additional steps compared to plasma isolation. 19 This would not be feasible for large-scale studies involving multiple commercial herds on different management systems, as we hope to carry out in the future.
The presence of EVs and other submicron particles in milk may be a useful noninvasive tool to monitor mammary cell turnover and general udder health during lactation cycle and may also be useful in the detection of mastitis or infection in large commercial dairy herds. Currently, the total somatic cell count is recorded but may not totally reflect (patho)physiological changes during lactation or infection and only mammary biopsies have been available to provide this information. This is an invasive and time-consuming technique and has significant welfare issues that make it unsuited to large-scale sequential monitoring either for research or routine purposes. 20
Our findings demonstrate that it should be possible to carry out larger studies across a number of different farms in different geographical locations utilizing different laboratories for the analysis of milk-derived particles and EVs and using a simple collection, processing, and storage protocol to further demonstrate the value of EVs and related circulating particles in raw cow's milk as a noninvasive biomarker of lactation efficiency and udder health. There are advantages and disadvantages of all the three machines tested in this study; the Nanosight NS500 used was the top of the range and the more affordable version would be more cumbersome to use for multiple fluorescently stained samples. Overall, the Cytoflex is probably the most versatile, since it has a smaller cutoff size than the Canto and as it has multiple lasers (similar to the Canto or other flow cytometers) EVs could be additionally stained for exosome and cell-specific markers. The Canto (and similar generation of flow cytometers) is probably most widely available, and although these machines will not be able to pick up smaller vesicles and require the addition of beads for accurate enumeration of the microfluidics, they are likely to enable multiple stains of EV populations similar to the Cytoflex.
Further studies are now required to compare data across our full herd and for a full lactation cycle. Additionally, we will now develop a toolkit of cross-reactive and bovine-specific antibodies to stain different cell surface markers with fluorochrome-labeled antibodies to enable the measurement of EVs potentially from different cell types and to further distinguish them from other milk-derived particles. Bovine miRNA and exosomes have previously been identified in human plasma, 8 which suggests that they are protected during transit through the human gut and have effects on immune responses in vitro and in vivo.21,22 Development of milk-specific markers will enable identification for studies to determine whether cow's milk and dairy products are the source of these vesicles and whether they could be used for novel treatments in the future.
Author Contributions
Conceived and designed the experiments: CL, GP. Analysed the data: CL, GP, AB, CG. Wrote the first draft: CL, GP. Contributed to writing the manuscript: CL, GP, CG. Agree with manuscript results and conclusions: GP, AB, CG, CL. Made critical revisions and approved final version: GP, CL. All authors reviewed and approved of the final manuscript.
Footnotes
Acknowledgment
The authors would like to thank Sarah Clarson (Beckman Coulter), Charlie Verity, and the staff at Boltons Park Farm.