
Abstract
There is an urgent need to develop novel anti-malarials in view of the increasing disease burden and growing resistance of the currently used drugs against the malarial parasites. Proliferation inhibitors targeting
Keywords
Introduction
Malaria is a devastating disease causing millions of death annually, apart from thousands of man hours lost to morbidity.
1
The majority of deaths due to malaria are caused by
Amongst various experimental methods, the experimental cell based assays to identify growth inhibitors of
The striking growth and complexity of High Throughput Screening (HTS) data has increased the importance of data mining techniques to aid efficient data analysis and decision-making at crucial phase of drug discovery. 6 Such techniques are often helpful to discover meaningful patterns and rules in the screened data. These patterns form the basis for building models that are effectively applied to prioritize compounds for the subsequent phases. Data mining methods can assist identification of false leads at an early stage and also facilitate understanding of Structural and Activity Relationships. 7 Supervised and unsupervised methods are increasingly being applied to build predictive bioactivity compound models. 8 In various studies, classification of compounds has been carried out using machine learning methods like Decision Tree (DT), k-Nearest Neighbours (kNN), Artificial Neural Networks (ANN), PLS Discriminant Analysis (PLS-DA) and all of them have shown statistically significant performance. 9 It is encouraging to note that the existing mathematical methods in Quantitative Structural and Activity Relationship (QSAR) field are being constantly upgraded and novel mathematical algorithms are continuously evolving. At the same time, the increasing availability of published compounds assays in PubChem database has stimulated greater interest to apply these robust methods, leading to development of highly accurate predictive models.10–12
In recent years, SVM based classification has gained wide usage in Ligand Based Virtual Screening (LBVS) mainly due to its efficient generalization capabilities and empirical performance.13–15 SVM based ligand screening has been illustrated as an ideal tool for rapid screening of large compound libraries with enhanced hit rate and better coverage.16,17 Unlike most of the LBVS methods which work on similarity based principles, SVM based classification has been shown to yield structurally diverse hits.
18
In a comparative study conducted by Plewczynski et al.
19
SVM with a linear kernel was found to be the best performing algorithm, compared to the other methods namely; kNN, ANN, DT, Random Forest (RF) and Naïve Bayesian Classification (NBC). Summarily, the performance of SVM methods is better when compared with above-discussed methods and hence we have used SVM in our studies. In previous studies, linear methods have been applied for classification of antimalarial compounds; however, there are fewer reports about usage of nonlinear methods.20,21 In this study, we have developed linear as well as nonlinear SVM models to classify compounds for anti-proliferative activity against
Materials and Methods
Generation of training and independent testing set
All the molecular structures for generating SVM models were retrieved from the PubChem bioassay data corresponding to the bioassay ID “AID-1815”.4,5 The Bioassay reports 441 active compounds with the potency ranging from 0.06 μM to 14.12 μM. The assay was based on qHTS for differential inhibitors of proliferation of
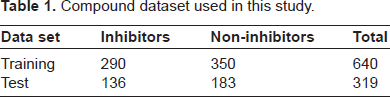
In preparing the training and independent test dataset, we have considered all the compounds labelled as active or inactive for their inclusion in the positive and negative training dataset. In the bioassay, 441 compounds are reported as active (potency ranging between 0.06 μM to 14.12 μM) and 558 compounds as inactive, ie, a total of 999 compounds. These compounds were pre-processed for removal of redundant compounds, which resulted in 426 active and 533 inactive compounds. All the non-redundant compounds, 959 in numbers, were standardized and hydrogen atoms were added using JChem 5.2. 22 The data set of 959 compounds was divided into training and testing set such that exactly 80% was reserved for training and the remaining 20% was retained for independent testing, ie, not to be included in the training step. Thus the training data comprised of total 640 compounds, while the test set comprised of 319 compounds (Table 1). SVM models described here after are developed based on the training set of 290 active compounds and 350 inactive compounds. Some of the potent proliferation inhibitors in the training data are shown in Table 2. The training and testing dataset is available online as supplementary material (Supplementary file 1 and 2).
Compound dataset used in this study.
Selected proliferation inhibitors in the training dataset.

Descriptor calculation and selection
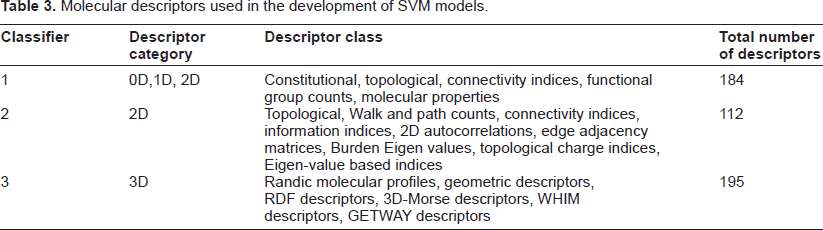
Molecular descriptors are the numeric representation of physico-chemical features extracted from various structural representation of a molecular structure. 23 Such a quantitative representation is obtained as the result of a logical and mathematical procedure that transforms chemical information encoded within a symbolic representation of a molecule into a useful number. In this work, a number of 0D (constitutional descriptors), 1D (functional group counts), 2D (topological, walk and path counts, connectivity indices, information indices, 2D autocorrelations, edge adjacency matrices, Burden Eigen values, topological charge indices, Eigen-value based indices) and 3D (Randic molecular profiles, geometric, RDF, 3D-Morse, WHIM, GETWAY) descriptors were calculated using DRAGON software. 24 Details of individual descriptors can be found in the reference manual of DRAGON software. The list of descriptors used in the study for developing different SVM models is presented in Table 3. Calculations for 0D, 1D and 2D descriptors were based on 2D structures of the compounds where as 3D descriptors calculations were based on JChem generated single low energy conformers. We generated three models based on different sets of descriptors; the first one based on 0D, 1D and 2D descriptors, the second one based exclusively on 2D descriptors and the third model based exclusively on 3D descriptors. The total number of selected descriptors was above 300 in each case. In order to reduce redundancy and noise in the training data, we reduced the number of descriptors in each case. For instance, in case of the model based on 0D, 1D and 2D descriptors, the total number of calculated descriptors was 383. We reduced the total number of descriptors to 184 by the following approach: firstly, descriptors with the same values and near-constant descriptors were eliminated. Secondly, redundant descriptors were removed by pair correlation method. The pair wise correlations for all descriptors were examined and one of the two descriptors with the correlation coefficient r of 0.9 and higher was excluded. Finally, three different models were developed using 184 (0D, 1D, 2D), 112 (2D) and 195 (3D) descriptors respectively. SVM training and testing files require normalized data input, hence we normalized our training data to range within –1 to +1.
Molecular descriptors used in the development of SVM models.
SVM algorithm
The SVM method was developed by Vapnik. 25 SVM algorithms project input data into a high-dimensional feature space using kernel functions, so that an optimal plane (maximal-margin hyper plane) may be drawn which can demarcate positive and negative datasets. The hyper plane is dependent on choice of kernel function and representative training examples, called support vectors. Optimized SVM classification model is generated by iterations of learning and evaluations, based on optimized choice of training support vectors, kernel functions and parameters. In developing SVM models for this work, we have used LIB-SVM, available freely at (http://www.csie.ntu.edu.tw/~cjlin/libsvm). 26 The SVM model built in this study is based on C-SVC (C-Support Vector Classification) algorithm implementation of LIBSVM. As the number of features used here is less than the number of instances, we primarily used a nonlinear kernel for building the SVM model. However, models based on linear kernel were also developed to compare their performance. A coarse grid-based optimization of the kernel parameters C and the hyper parameter γ was performed to achieve the highest classification accuracy.
Model validation
The training data set of 640 compounds was subjected to five-fold cross validation to find the best kernel parameters C and γ by maximizing the accuracy and minimizing the error. In five-fold cross-validations, the training data is split into 5 folds; one fold is used for testing, the remaining ones for training. This is iterated five times, such that each of the data sets is used as a test data. The optimum values of C and y were then used to retrain the SVM model. The performance of the models was also assessed on the independent test dataset, using standard statistical measures namely- sensitivity: the percentage of correctly predicted active compounds, specificity: the percentage of correctly predicted inactive compounds, accuracy: the percentage of correctly predicted active and inactive compounds. In addition, balanced measures like MCC, Balanced Accuracy (BAC) and AUC (Area under ROC curve) were also computed. 27 MCC = 1 indicates a perfect prediction while MCC = 0 indicates a random prediction.
These evaluation measures can be mathematically expressed as:
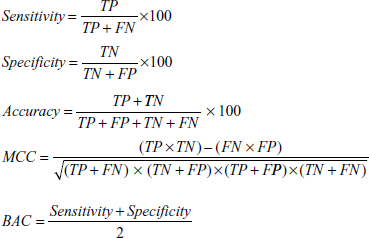
where TP is the number of true positives, FN is the number of false negatives, TN is the number of true negatives and FP is the number of false positives.
Principal Component Analysis (PCA) and Applicability Domain (AD)
As expected, the models based on machine learning methods normally show good performance for compounds that share similar properties as those in the training set. Thus, it is of ever-increasing concern to define the AD of the models, and to check if it is valid for any new molecules. AD is the boundary defined by the descriptor space in the training data. Any new chemical compound should essentially be positioned in the boundary of the chemical space of the training set, in order to be qualified for reliable prediction. 28 Several simple and complex approaches are used to define AD; based on range, distance, geometric and density distribution. One of the simplest and widely applied approach is the AD based on range-based definition with a preliminary PCA rotation. 29 In the present study, we have defined the AD of the model and evaluated its validity on the test set and the screening dataset based on Principal Component (PC) ranges. This method will be helpful to confirm whether a new compound is inside or outside the AD. PCA based definition of AD, reduces the higher dimensionality of the data (due to large number of descriptors) and facilitates simple exploration besides maintaining the variation of the data. This is achieved by identifying directions, or PCs, along which there is maximal variation in the data. Each PC is expressed as a linear combination of the original descriptors. It may be noted that PCs are orthogonal to each other, and the correlation between any two PCs is zero. PCA in the study was performed using R package. 30 The PCA was carried out for the training data of the best model that showed highest classification accuracy. PCA of the independent test set and screening set of NCI diversity set II was also performed in order to validate the applications of the model.
SVM model as virtual screening tool
We used NCI diversity set of 1364 compounds retrieved from the NCI/DTP Open Chemical Repository (http://dtp.nci.nih.gov/branches/dscb/div2_explanation.html) for virtual screening purpose. 31 The compounds were processed in the same way as done for the training set and descriptors were calculated. Subsequently, 1328 compounds were suitable for descriptor calculation and were predicted for their activity by the best SVM model.
Results and Discussion
In the present study, we have developed SVM based model for prediction of proliferation inhibitors of
Model validation
The overall cross validation accuracy of the models is in the range of 80% to 83%, this suggests the self-consistency of the data and also validates the reliability of the models (Table 4). Area Under the ROC curve (AUC) values for all the models (~0.88) indicates an overall good performance of the models than random classification.
SVM model parameters and evaluation of classification performance.

Performance of model based on 0D, 1D and 2D descriptors
Best kernel parameters determined by five-fold cross validation and the corresponding results obtained with each model are illustrated in Table 4. The model was based on a set of 184 descriptors belonging to 0D, 1D and 2D category which yielded highest accuracy in cross validation as well as over independent test set. The model performed consistently well with an accuracy of 83%, and an AUC of 0.88 in five -fold cross validation. The model was able to correctly classify 117 inhibitors (86%) and 160 non-inhibitors (87%) with an overall accuracy of 87% and MCC of 0.73. Although the number of inactive compounds is slightly higher than the active compounds in the training set, almost equal sensitivity and specificity was obtained. This signifies the balanced performance of the model with respect to good recognition rate and low false prediction rate. The overall performance of the model was found to be satisfactory as evident from the independent testing data performance. The better accuracy of the model can be attributed to the appropriate choice of 0D, 1D and 2D descriptors that were capable to discriminate proliferation inhibitors and non-inhibitors. The model based on these descriptors showed consistent and optimum performance when compared with other models.
Performance of models based on 2D and 3D descriptors
The nonlinear model based on 2D descriptors showed second best performance with a five-fold cross validation accuracy of 82%, overall testing accuracy of 85%, sensitivity of 84% and MCC measure of 0.69. Some of the 2D descriptors applied in this model are overlapping with the ones used in the first model. This implies the specific contribution of 2D descriptors in better discrimination of active and inactive compounds with good sensitivity and specificity than models based on 3D descriptors. Linear model based on 2D descriptors had the lowest cross validation accuracy although with good testing accuracy (81%) comparable to other models. As shown in Table 4, the model based on 3D descriptors ranks last in the testing accuracy, specificity and sensitivity. Perhaps, the overall limited structural diversity in the compounds could be a limiting step for performance of shape based 3D descriptors. In general, all the models showed a balance in terms of their specificity and sensitivity as demonstrated by the BAC. The overall BAC of all SVM models ranges from 0.80 to 0.87. However, in all the cases RBF based models outperformed corresponding linear models with higher classification accuracy.
Applicability Domain
PCA was applied here to define the AD of the best model and also to map the active and inactive compounds in their respective chemical spaces. PCs are basically the linear combinations of the original 184 descriptors used in this study. The AD is calculated on the basis of the PC ranges. The minimum and maximum values of principal components are set by considering all the compounds in the training data set. Figure 1 shows the first three principal components of the compounds in the training set that has been used to define the AD of the model. The compounds in the independent testing set were also found to be within the AD (Fig. 2). PCA results reveal in general that, the active and inactive compounds occupy different clusters in the chemical space, although there was no clear boundary between the two classes. The training data shows limited structural diversity, which poses a restraint on the sensitivity and specificity of the model. These parameters could be apparently improved by increasing the number of diverse structures in training set.
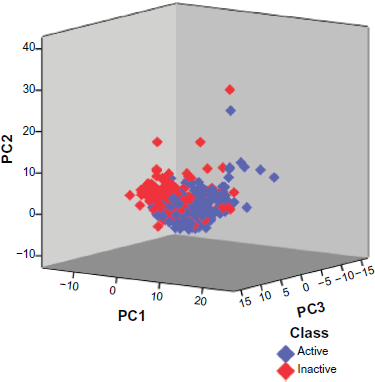
Visualization of chemical space in training dataset. Proliferation inhibitors (blue diamonds) and non-inhibitors (red diamonds) are represented using the first three Principal Components. The figure depicts the range of Principal Components of the compounds in the training set that define the applicability domain (AD).

Visualization of chemical space in testing dataset. The figure illustrates the compounds in the independent testing dataset lying within the applicability domain of the classifier.
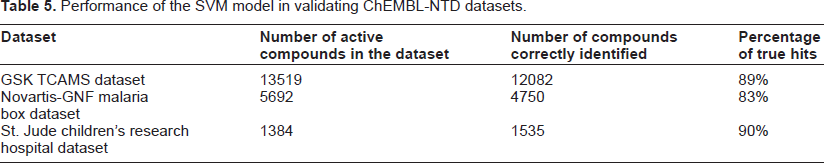
Additional validation using ChEMBL-NTD datasets
While we were developing the models, three novel datasets of proliferation inhibitors of
Performance of the SVM model in validating ChEMBL-NTD datasets.
Virtual screening of inhibitors
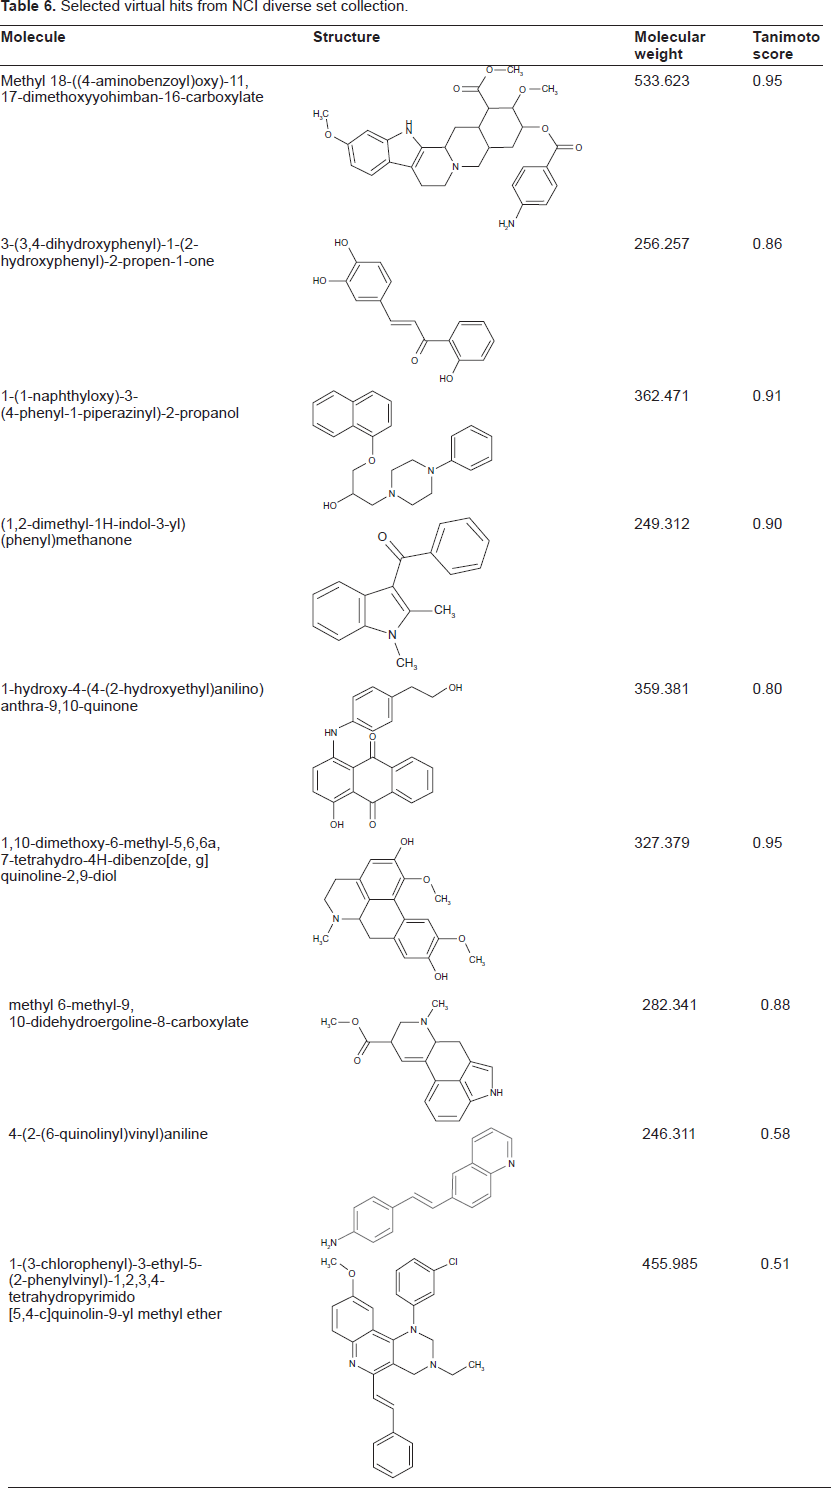
We have utilised the best SVM model based on 0D, 1D and 2D descriptor category for identifying further novel inhibitors from NCI diversity collection of 1364 compounds. Only 1328 compounds passed through the descriptor calculation. First we tested, if all 1328 compounds were within the AD of the model using the first three principal component ranges of the 184 descriptors (as described in the methods). About 70 compounds violated the descriptor ranges observed for compounds in the training set. Therefore we considered them unreliable for prediction. The outliers were discarded and the remaining 1257 compounds were predicted using best SVM model. The model predicted about 580 compounds as positive and remaining 677 as negative. In the NCI diversity set, we observed that there were four known proliferation inhibitors which were correctly classified. The predicted compounds were prioritised according to the probability score of LIBSVM. Further, we compared predicted active compounds to those in the training dataset, to check their similarity in terms of Tanimoto coefficient. The Tanimoto coefficient for the 580 predicted positive NCI diversity set compounds against the 290 positive training compounds ranged from 0.98 to 0.24. Some of the predicted active compounds and their corresponding maximum Tanimoto score to the compounds in the training data are shown in Table 6.
Selected virtual hits from NCI diverse set collection.
Conclusion
The SVM model based on 184 0D, 1D and 2D descriptors of the inhibitors exhibited the highest accuracy with lower false-hit rate. The selected molecular descriptors have sufficiently captured the features required to discriminate
Disclosures
This manuscript has been read and approved by all authors. This paper is unique and is not under consideration by any other publication and has not been published elsewhere. The authors and peer reviewers of this paper report no conflicts of interest. The authors confirm that they have permission to reproduce any copyrighted material.
Footnotes
Acknowledgements
Department of Biotechnology (DBT, India) grant for “Bioinformatics Infrastructure Facility” at ICGEB and Indian Council of Medical Research (ICMR) fellowship to Sangeetha Subramaniam is duly acknowledged.