
Abstract
Corticomuscular coupling estimated by EEG-EMG coherence may reveal functional cortical driving of peripheral muscular activity. EEG-EMG coherence in the beta band (15–30 Hz) has been extensively studied under isometric muscle contraction tasks. We attempted to study the time-course of corticomuscular connectivity under a dynamic target tracking task. A new device was developed for the real-time measurement of dynamic force created by pinching thumb and index fingers. Four healthy subjects who participated in this study were asked to track visual targets with the feedback forces. Spectral parameters using FFT and complex wavelet were explored for reliable estimation of event-related coherence and EEG-EMG correlogram for representing corticomuscular connectivity. Clearly distinguishable FFT-based coherence and cross-correlogram during the visual target tracking were observed with appropriate hyper-parameters for spectral estimation. The system design and the exploration of signal processing methods in this study supports further exploration of corticomuscular connectivity associated with human motor control.
Keywords
Introduction
There are at least two neuronal population activities that can be observed with electroencephalography (EEG) during the production of human voluntary muscle contraction: one is the slow, DC potential starting about 1.5 s before movement, the Bereitschaftspotential or movement-related cortical potential;1,2 another is the rhythmic power change observed most obviously in the alpha (8–13 Hz) and beta (15–30 Hz) bands.3,4 The function of the oscillatory activity in the sensorimotor cortex associated with human motor control is still unclear. Previous studies revealed that the amplitude of cortical rhythmic activity decreases during the movement of the contralateral hand, which has been termed as event-related desynchronization (ERD). 5 The amplitude of the oscillatory activity in the beta band shows a rebound or 'idling rhythm' after movement, which has been termed event-related synchronization (ERS). 6 In addition to the rhythmic power changes in the sensorimotor cortex, the coherence between cortical rhythms and muscular activity in electromyography (EMG) has been explored during isometric muscle contraction.7–9 The EEG-EMG coherence may indicate the efficiency of cortical motor drive of peripheral muscles. 10 Thus, if the oscillatory activity over sensorimotor cortex has a functional role in motor control, it should show systematic variation following a specific motor task. This has been previously explored by a precision grip task, where coherence between cortical rhythm and EMG was assessed during the steady grip of a compliant, spring-like load.7,11,12
In this study, we want to explore temporal changes in oscillatory synchronization in the beta band (15–30 Hz) between human motor cortical activities recorded by EEG and hand muscle activities by EMG that vary according to the time course of the task and the level of compliance of the gripped objects. We developed a novel device providing precise measurement of grip force in real-time, where the measured force is able to be visually fed back to subjects for precise control of finger grip. We also explored better hyper-parameters of spectral segment length and window length to enhance the representation of the time-course of EEG-EMG coherence and correlogram. At the same time, complex wavelet-based coherence was also explored and compared with Fourier transform-based coherence estimation.
Methods
Subjects
The experiments were performed on four healthy volunteers (two males and two females), ranging from 22 to 30 years old. The protocol was approved by the institutional review board, and the subject gave informed consent.
Device and behavioral task
The self-made device for real-time measurement of grip force is illustrated in Figure 1. The subject was asked to use the thumb and index finger of his/her right hand to grip the button-like force sensors on each end of two sliding tracks. The two sliding tracks connected with two shafts with a 10 N spring load on the other side. The subjects squeezed the two buttons to open the spring load. As the compliance provided by the spring is proportional to the displacement, maximum force is required when moving the two buttons to the center, i.e. maximum extension of the spring load.

Self-made device for finger grip. Two force sensors were mounted on the end of two sliding tracks. One position sensor measured the displacement when gripping. The force produced by the thumb and index finger were recorded and fed back to the subject in the visual paradigm.
Before the precise grip task, the subject was asked to move the buttons to the center for calibrating the maximum force (the visual command is illustrated in the upper part of Fig. 1).
After calibration, the subject was instructed to squeeze the button in order to keep the feedback force (depicted by the green bar in Fig. 2) inside the target bars (brown color). The target force was set at two levels: 20% and 30% of the maximum force. The subject needed to control both the thumb and index finger so that the green bar indicating squeezing feedback forces were within the target bars on both sides (left for thumb and right for index finger). During the finger grip, the subject was asked to maintain gaze at the center of monitor and avoid blinks or eye movement.
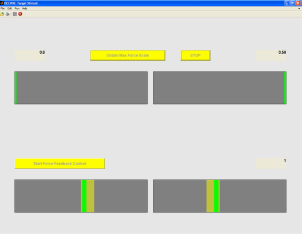
The screenshot of the home-made MATLAB-based paradigm for visual target tracking. Subject was asked to squeeze his/her fingers to the center of the track to measure the maximum force (upper part). Then subject performed repeated task: tracking the yellow target by the feedback squeezing force to make the narrow green inside the brown bar (lower part).
Recordings
Bipolar surface EMG was recorded from first dorsal interosseous (1DI), abductor pollicis brevis (APB), and extensor digitorum communis (EDC) of the right hand and forearm with a bandpass of 0.1–100 Hz. EEG was recorded from 29 (tin) surface electrodes (FP1, F3, F7, C3A, C1, C3, C5, T3, CP3, P3, T5, O1, FP2, F4, F8, C4A, C2, C4, C6, T4, CP4, P4, T6, O2, FZ, FCZ, CZ, CPZ, and PZ), attached on an elastic cap (Electro-Cap International, Inc., Eaton, OH, USA) according to the international 10–20 system. 13 EEG and EMG Signals from all channels were amplified (Neuroscan Inc., El Paso, TX), filtered (0.1–100 Hz), and digitized (sampling frequency, 250 Hz).
Analysis
The EMG signals were high passed at 10 Hz and then rectified. Both EEG and EMG signal were epoched from −3 to 12 s with respect to the start of squeezing. A total of 20 epochs were recorded, and no epoch was excluded since blink artifact was controlled. The time-course of coherence or correlogram was obtained from continuous estimation for each sliding time-window.
Figure 3 demonstrates EEG/EMG acquisition and the following data analysis. After the signals were pre-amplified and filtered at 0.1 to 100 Hz, the analog signals were converted to digital signal for processing. EEG-EMG coherence and correlogram estimation were conducted. With coherence estimation, FFT-based method and Wavelet method were adopted and compared. For each estimation, different sliding window length was investigated in presenting the spectrums.

Flow chart of EEG/EMG data acquisition and processing procedures.
Coherence that provides a statistical relationship between two signals x(t) and y(t) from two sources in a certain frequency band was calculated by:

Pxy is the cross-spectra between x(t) and y(t), and Pxx and Pyy the auto-spectra of x(t) and y(t) respectively. The magnitude or power of the spectra is denoted as |Pxy|. Normalized with the auto-spectra of two signals, the coherence Cxy is valued from 0 to 1. The calculation method for coherence was similar to the method provided in. 14
The power spectral estimation for coherence was explored with different estimation parameters. As the time and frequency resolution in time-frequency representation are a trade-off with each other, we explored a set of sliding time-window lengths resulting in different time-frequency resolution. Another important issue for spectral estimation is the estimation variance, which is on the other hand, a trade-off with frequency resolution. We investigated two segment lengths for the power spectral estimation. The cross-spectra and auto-spectra were obtained by the average of FFT-based periodograms from non-overlapped segments. 15
The cross-spectra Pxy, auto-spectra Pxx and Pyy using averaged periodogram were calculated by:


For each time point in the time-course, data in the corresponding sliding time-window was extracted from all 20 epochs and was concatenated consecutively, where N is the length of the concatenated data i.e. 20 X length of sliding window. The concatenated data was segmented without overlap, the length of each segment was L, with total N/L (integer) segments for calculation. The periodogram for each segment was calculated and the power spectra was obtained by the average of the periodograms, where PAVxy denotes the averaged periodogram, and Plxy,i is the periodogram for the i th segment with the length of L, similar for PAVxx and PAVyy. The significant value is determined by:

Where α is the confidence level and N/L the number of segments. In the time-frequency representation, the EEG-EMG coherence was threshold at the 95% confidence level, 16 so that any points below that threshold were corrected to zeros.
The wavelet may provide a better temporal resolution than Fourier transform-based spectral estimation. The complex coherence coefficients were estimated using complex Gaussian wavelet with the scale from 2 to 28 and interval of 0.1. The equivalent central frequency was ranged about 2–60 Hz. Similar to the coherence estimation from the Fourier Transform-based spectral estimation, wavelet coherence was estimated with different length of sliding window.
Cross-correlogram provides another view of relationship between two signals from two sources. Instead of indexing with frequency band, the cross-correlogram provides the linear relationship with a certain time delay. 17 Mathematically, the cross-correlogram is a plot of cross-correlation Rxy(m) versus m (time delay). Evaluation of the cross-correlation is given by:

N is the length of the concatenated data i.e. 20 × length of sliding window.
Before the calculation of correlogram, the EEG and EMG signal were bandpass filtered within 15–30 Hz. Cross-correlation normalized by auto-correlation was calculated for each of the sliding time-windows. As the length of the time-window determines the variance of the estimation, we explored a set of lengths of the sliding time-window.
Results
EMG signal during visual target tracking
The exploration of coherence and correlogram was performed on the EEG signal from electrode C3 over the sensorimotor area and the EMG signal recorded from EDC on right forearm. The time-course of EMG signal with force feedback control and EEG signal from electrode C3 during visual target tracking are illustrated in Fig. 4.
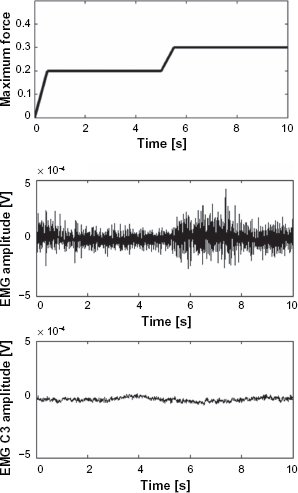
Time course of the target force (relative to measured maximum force), EMG signal recorded from EDC and EEG signal from electrode C3 following the tracking of the visual target.
FFT-based EEG-EMG coherence estimation
For coherence estimation, the segment length determines the frequency resolution. We investigated the coherence with two different segment lengths; 128 points or about 0.5 s, and 256 points or about 1 s, with the sampling rate of 250 Hz. The resulting corresponding frequency resolutions or frequency bin width were 2 Hz with segment length of 128 and 1 Hz with segment length of 256.
Though the segment lengths for power spectral estimation were different, the FFT length for nonparametric spectral estimation was the same at 512 points. The 512-point FFT was achieved by zero-padding so that the FFT length does not affect frequency resolution.
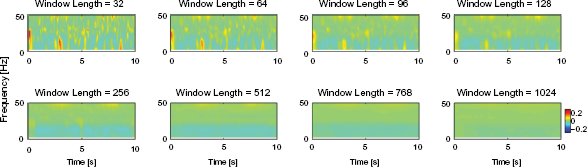
The time-frequency plot of the coherence estimated with segment length of 128 points for spectral estimation is illustrated in Figure 5. The time-course of the coherence was calculated continuously from sliding time-windows with different length; 32, 64, 96, 128, 256, 512, 768, and 1024. The increase of time interval for the sliding windows was at 1/8 proportions of the window length. For example, the time-course of the coherence estimated from a sliding time-window with length of 32 points, the time course of the coherence was calculated on the interval of 32/8 = 4 points or 0.01 s, and for each time point, the time-window for coherence estimation was extracted from 16 points before and 16 points after the corresponding time. The 32 point data from each of 20 epochs was extracted and linked together making a total length of 32 × 20 = 640 points data for coherence or spectral estimation. Therefore, there was 4 segments 640/128 −1 = 4 (–1 to exclude the final marginal point).

Time-course of FFT-based EEG-EMG coherence during visual tracking with grip force feedback. The segment length for spectral estimation was 128 points, i.e. frequency resolution was about 2 Hz. The coherence was corrected by 95% threshold.
No pattern in the coherence time-course was recognizable under smaller lengths of time-window; 32, 64, 96, 128, and 256, although the temporal resolution was better than the longer time-windows.
It was noticed that the 95% threshold correction did not correct all of the variance of coherence, whereas the distribution of coherence with the time window length of 32 points was random even after the correction. The longer length of time-window provided recognizable coherence estimation, though with the compromise of lower temporal resolution. The clearly recognizable coherence in the high beta band around 25 Hz was observed during both 20% and 30% maximum contraction, where coherence during 30% contraction was larger than that of 20% contraction. However, during the transition period from 0% to 20% and 20% to 30%, no coherence was recognizable. We also noticed that the larger coherence occurring around 3 s was smoothed out when applying a longer time-window of 1024.
We also explored higher frequency resolution using a segment length of 256 points, providing a frequency resolution about 1 Hz. The corresponding time-course of the coherence is illustrated in Figure 6. Since the length of the segment was increased, the number of segments was decreased under the same length of time-window. Accordingly, a clearly recognizable coherence was observed under longer length of time-window, i.e. 512, 768 and 1024.

Time-course of FFT-based EEG-EMG coherence during visual tracking with grip force feedback. The segment length for spectral estimation was 256 points, i.e. frequency resolution was about 1 Hz. The coherence was corrected by 95% threshold.
The central frequency of the observed coherence was the same as that estimated by the segment length of 128, where the band width was improved to about 1 Hz. Similar to the estimation with segment length of 128, the coherence was smoothed when estimated with longer time-window.
The EEG-EMG coherence for all subjects is illustrated in Figure 7. The segment length for power spectral estimation was 256 points, and sliding time-window length was 512 points. The peak frequencies of the coherence were all in the beta band from 22 Hz to 28 Hz. The peak coherence value of subject 1 was higher than those of the other subjects.

EEG-EMG coherence selected during visual tracking with grip force feedback for four subjects. Central frequency for subject 1 was around 25 Hz, for subject 2 was around 22 Hz, for subject 3 was around 28 Hz and for subject 4 was around 22 Hz. The significant level was 0.0739, marked by the black dash line.
Wavelet-based coherence estimation
Higher coherence was seen from the wavelet-based estimation with a shorter length of window, such as 32 or 64. However, wavelet-based coherence was not observed when a longer window is used. Compared with FFT-based estimation, beta-band coherence was not elicited using complex Gaussian wavelet-based estimation.
EEG-EMG correlogram
The correlogram was also estimated under different lengths of the sliding time-window. Before calculation of the correlogram, both EEG and EMG signal were bandpassed with a 4th order Butterworth filter of 15–30 Hz. The data within a certain time-window was extracted from all epochs, and then they were concatenated for correlation estimation. Under a short length of time-window of 32 points, the correlogram corresponding to shorter delays was observed during most of two contraction periods. The duration of recognizable correlogram was longer than that of the coherence. Correlogram corresponding to longer delays became clear when the length of time-window was longer. Similar to the coherence estimation, the temporal resolution was blurred when the length of time-window was longer.
From the correlogram, we also observed that during the transition periods when starting to squeeze and changing contraction from 20% maximum force to 30% maximum force, the time lag of peak correlogram was different from those of steady grip.
Figure 10 shows the EEG-EMG cross-correlogram during visual tracking for the four subejcts. The correlogram was calculated versus time delay from −0.1 s to 0.1 s. Similar to the coherence, the peak correlogram values of subject 2 was higher than those of other subjects.
Discussion
Spectral variance in coherence estimation
The coherence was obtained from the cross-spectra normalized by auto-spectra of two signals. FFT-based nonparametric spectral estimation may have excessive variance in the estimation, 15 and as a result, makes the coherence estimation inaccurate.
We employed a modified periodogram method; the average of periodograms by segmenting the estimated signals. The modified method may blur the frequency resolution, but will decrease estimation variance. Theoretically, the estimation variance is inversely proportional to the number of segments, 15 i.e. the larger the number of segments, the smaller the estimation variance for the spectral estimation. The variance in the estimation of coherence with a shorter time-window length, i.e. a small number of segments, is the result of the variance of spectral estimation. Therefore, for accurate coherence estimation, the excessive variance in spectral estimation needs to be reduced by appropriately segmenting the signal, even though the segmentation may decrease the frequency resolution.
Although it is important to reduce the estimation variance, the temporal resolution in the representation of coherence time-course may also be blurred under a longer sliding time-window (see Fig. 5 and Fig. 6). On the other hand, nonparametric spectral estimation requires the signal to be stationary during the whole estimation period. However, the signal may no longer be stationary for a longer time-window. Therefore, better parameters for accurate coherence estimation might be highly data-dependent. Careful study of optimal sets of parameters is needed for accurate measurement.
Coherence and correlogram
The correlogram was clearly recognizable during most of the steady grip period, and even during the transition period, whereas coherence was only recognizable during a very short period in steady contraction. We suppose that the estimation variance for correlation and coherence might be the reason for the different representation. The variance of spectral estimation for coherence is inversely proportional to the number of segments, i.e. N/L where N is the total length of the concatenated data, and L is the segment length. The variance for correlation estimation is inversely proportional to N – m, where m is the index of time delay. When m is not close to N (in most cases, this is true), N – m is larger than N/L so that the variance of correlogram is smaller than that of coherence. Therefore, the correlogram might reveal more detailed information that coherence can not provide.
Time-course of wavelet-based EEG-EMG coherence during visual tracking with grip force feedback. The coherence was estimated with different length of window from 32 to 1024.

Time-course of EEG-EMG correlogram during visual tracking with grip force feedback. Both EEG and EMG signal were pre-filtered by a 4-th order Butterworth IIR filter with bandpass of 15–30 Hz. The peak interval in correlogram was about 0.04 s, indicating a central frequency of 25 Hz.
The correlogram for larger time delays estimated under a shorter length of time-window was not visible as shown in Figure 7. The reason might be that the variance is larger when m is closer to N, where N is relatively small so that N – m is small.
During the transition period when the subject started contraction until steady contraction, or from 20% contraction to 30% contraction, we observed recognizable correlogram under a shorter length of time window, although no coherence was recognizable during the transition period. We consider that both EEG and EMG signals vary greatly during the transition period, so that the signal can be treated as stationary only in a short time-window. For this reason, both correlation and power spectral estimation is no longer appropriate for a longer time-window. Considering the variance in coherence estimation from a short time-window, the correlogram can only be recognizable from the estimation in a short time-window.
Wavelet-based coherence estimation was proved as an efficient tool to elicit corticomuscular connectivity. 18 However, the wavelet-based coherence was less effective than FFT-based coherence estimation. One possible reason was the difference in the paradigm that we investigated the corticomuscular connectivity during a dynamic movement with visual tracking, whereas the previous work investigated the coherence during isometric contraction. From the FFT-based estimation, we found that the coherence presented in a narrow frequency band, indicating that FFT-based estimation may be more efficient for narrow band activity. However, future investigation of different mother wavelets might be required for better wavelet-based coherence estimation.
Functional role of beta rhythm
About the functional role of the cortical-motoneuronal interaction, early study suggested that the cortical-muscular coherence is a manifestation of motor binding due to a zero-phase loop incorporating descending motor activity and peripheral feedback. 19 Later research 20 which showed that the EEG-EMG amplitude correlation suggested a cortical drive mechanism which may be relatively independent of peripheral feedback supported the findings of McAuley 21 who suggested a central origin of peripheral 20 Hz oscillations which were shown to be at least partly independent of peripheral feedback. This may attribute to the reason that the 20 Hz motor cortex oscillations were thought to arise under stationary conditions, i.e. during isometric contraction, no dynamics of motor control need to be encoded and therefore the same motor commands were continuously sent by motor cortex at a regular pace to the muscle.

EEG-EMG cross-correlogram selected during visual tracking with grip force feedback for four subjects. The peak interval was around 0.04 s, indicating a central frequency of about 25 Hz.
In contrast, we explored the time-course of EEG and EMG coherence as well as cross-correlogram under a visual target tracking paradigm, where the force contraction was not constant, instead, set at two levels with a transition period in between. Both estimations demonstrate cortex to muscle connection in beta band (15–30 Hz) with central frequency of 25 Hz. The coherence and cross-correlogram provides further evidence of the functional role of beta band rhythmic activity in motor control. Under varied motor parameters, i.e. the different levels of force contraction, both coherence and cross-correl-ogram indicated dynamic synchronization between cortical motor neurons and peripheral muscles, i.e. larger coherence and cross-correlogram when making larger contraction force. However, we have investigated a limited number of subjects; further exploration is required for supporting the functional role of beta activity.
As a visual-motor task, the visual processing will interfere neural network that makes motor output. It is of interest to study how neurons from visual areas innervate motor neurons through inter-neuron connections. In consistence to previous findings on neuromuscular coherence with tonic movement, 8 the corticomuscular coherence was also focalized on motor areas only when performing phasic movement as investigated in this study. No significant coherence as well as correlogram was found in occipital areas. It suggests that the connection of inter-neurons in cortex might function differently from that of corticomuscular connections.
Conclusion
The developed device is capable for real-time measurement of dynamic force to study the time-course of corticomuscular connectivity associated with a visual-motor tracking task. We found that cross-correlogram provided better representation of corticomuscular connectivity than FFT-based coherence and wavelet-based coherence, though more detailed study with different parameters such as wavelet-based coherence with other mother wavelets might be required in the future investigation. The system design and the exploration of signal processing methods in this study will support further exploration of corticomuscular connectivity associated with human motor control.
Disclosures
This manuscript has been read and approved by all authors. This paper is unique and is not under consideration by any other publication and has not been published elsewhere. The authors and peer reviewers of this paper report no conflicts of interest. The authors confirm that they have permission to reproduce any copyrighted material.