
Abstract
This study aims to quantify the effects of geometry and stiffness of aneurysms on the pulse wave velocity (PWV) and propagation in fluid-solid interaction (FSI) simulations of arterial pulsatile flow. Spatiotemporal maps of both the wall displacement and fluid velocity were generated in order to obtain the pulse wave propagation through fluid and solid media, and to examine the interactions between the two waves. The results indicate that the presence of abdominal aortic aneurysm (AAA) sac and variations in the sac modulus affect the propagation of the pulse waves both qualitatively (eg, patterns of change of forward and reflective waves) and quantitatively (eg, decreasing of PWV within the sac and its increase beyond the sac as the sac stiffness increases). The sac region is particularly identified on the spatiotemporal maps with a region of disruption in the wave propagation with multiple short-traveling forward/reflected waves, which is caused by the change in boundary conditions within the saccular region. The change in sac stiffness, however, is more pronounced on the wall displacement spatiotemporal maps compared to those of fluid velocity. We conclude that the existence of the sac can be identified based on the solid and fluid pulse waves, while the sac properties can also be estimated. This study demonstrates the initial findings in numerical simulations of FSI dynamics during arterial pulsations that can be used as reference for experimental and in vivo studies. Future studies are needed to demonstrate the feasibility of the method in identifying very mild sacs, which cannot be detected from medical imaging, where the material property degradation exists under early disease initiation.
Keywords
Introduction
Changes in the mechanical properties of the arterial wall have been shown to disrupt the normal hemodynamics of the arteries and contribute to various cardiovascular diseases (CVDs). 1 In particular, changes in aortic stiffness have been reported in prior studies as an independent indicator of all-cause and CVD-related mortalities.2–5 Assessing the arterial stiffness has been collectively and increasingly recommended to be an essential part of clinical diagnosis, therapy, and follow-up procedures.6,7 Abdominal aortic aneurysm (AAA) is one of the leading causes of cardiovascular-related morbidity and mortality in United States and worldwide, with an increasing prevalence in recent years.8–10 The most common criterion currently used in assessing rupture risk and clinical intervention of AAAs is based on sac size (eg, when a sac diameter reaches ~5–5.5 cm or when the growth rate reaches 1 cm per year).11–13 However, studies have shown that diameter alone may not be the most decisive factor in decision making, because some small AAAs could rupture while some large ones could survive during the normal life expectancy of the patient.14–16 Therefore, such size-based intervention methods may offer insufficient or unnecessary treatments for different patients, and new criteria are needed for making reliable and effective interventions. On the other hand, it has been shown that the development of AAA constitutes alterations in the contents and fibrillar structures of elastin and collagen, which therefore induce local changes in the wall's mechanical properties.9,17 In particular, degradation of the elastin content and structure has been associated with the local softening of the wall and balloon-like dilation, while collagen failure has been linked to sac failure.16,18 Therefore, changes in the structural and mechanical properties of the wall are expected to take place at earlier stages of development than geometric changes that can be detected at later stages of the disease, and the use of bio-markers related to the wall's mechanical properties may improve disease diagnosis.
A set of techniques for the estimation of arterial stiffness is based on dilation-pressure curves; 19 but it has the major drawbacks of being invasive—eg, the use of pressure catheters—or incurring potentially large inaccuracies—eg, using non-patient-specific peripheral-to-central pressure transfer functions.20,21 The second category of methods is based on the velocity of the pulsatile wave traveling along the aorta. Pulse wave velocity (PWV) has been shown to be related to the underlying wall stiffness by the Moens-Korteweg formula.22–24 The current clinical gold standard for PWV estimation is based on measuring the temporal pulse profiles at carotid and femoral arteries6,25 and obtaining an average velocity as the distance measured over the skin divided by the time delay between the pulse profiles.26, 27 The carotid-femoral-based methods are prone to inaccuracies' being primarily induced by not using the exact arterial geometry, eg, the true traveled distance. In addition, assuming a single longitudinal flow direction between the carotid and the femoral arteries leads to further inaccuracies in measuring the true distance.6,28 Moreover, the wall stiffness—and thus PWV—has been shown to vary regionally along the vascular branch, 19 and assuming an average PWV for the entire carotid-femoral segment might not thus represent a meaningful assessment. To overcome this problem, imaging techniques may be used as noninvasive alternatives for obtaining regional wall motions.29–31 In particular, the ultrasound-based method of pulse wave imaging (PWI) has recently been developed by our group, aiming at obtaining the regional PWV noninvasively. PWI's feasibility studies have been performed on different applications such as normal and aneurysmal murine aortas32,33 and human aortas in vivo,30,34,35 human carotid in vivo, 36 aneurysmal and hypertensive patients,37,38 canine aorta ex vivo, 39 experimental phantoms,30,40 in fully coupled fluid-structure interaction (FSI) aortic simulations,40–43 and in comparison with appla-nation tonometry. 30
As indicated above, there occur local changes in AAA wall stiffness during disease progression, and therefore—based on a loose application of the Moens-Korteweg equation—the PWV is also expected to vary regionally. The performance of the PWI method can be compromised in applications involving sites of local changes in wall composition and geometry, such as arterial branching, aneurysms, and stenotic lesions, where precise detection of propagating waves becomes challenging due to the disruptive, complex patterns of the reflected waves.33,44 Obtaining AAA samples at different stages of the disease with precisely controlled geometry and material properties in vivo is impossible. Therefore, simulation studies can be an efficient surrogate to simulate the pulsatile flow in healthy and AAA geometries with different sac wall geometry characteristics and stiffness values in order to gain insight into the effects of geometry and material properties on pulse wave propagation and velocity.
Conventional finite-element method (FEM) simulations of vascular biomechanics have primarily relied on solid-state (SS) modeling of blood vessels experiencing static or pulsatile internal pressure replicating the hemody-namic effects; 45 however, a more accurate description of fluid mechanics—as well as solid mechanics 46 —can be obtained by incorporating the two-way fluid-structure interaction (FSI) effects. Fully coupled FSI simulations using patient-specific geometries and anisotropic finite strain constitutive relations have been carried out for healthy and pathological arteries,47–50 aiming at computing biomechani-cal properties such as fluid velocity and pressure as well as wall displacement and stress.51,52
FSI simulations using patient-specific AAA geometries have been previously performed to assess the risk of rupture by measuring the wall stress.49,50,53–56 These studies have proposed that the wall stress reliably predicts potential rupture, as opposed to the traditionally used marker of AAA size. Fully dynamic FSI simulations can be used to quantify pulsatile wall radial displacement and its axial motion along the aorta over time and to calculate the PWV. There have been a few studies reporting temporal data on arterial radial wall displacement during dynamic FSI simulation but without recording the spatial data, and therefore no PWV measurements were made. 46 Even though the aortic tissues have been shown to behave under anisotropic, viscoelastic, nonlinear, and inhomogeneous regims,10, 16, 47, 50, 53, 57, 58 the majority of arterial FSI simulation studies have been done on simplified material properties such as isotropic, elastic, linear, and homogenous scenarios. Previously, we had reported studies using coupled Eulerian-Lagrangian (CEL) FSI simulations of aortic pulse wave propagation, particularly on validating against phantom and in vitro canine studies39,40 and on detecting wall local inclusions.41,42
In this study, CEL simulations of human aortas with straight as well as AAA geometries of different sac stiffness were performed to obtain the fluid-induced pulsatile wall deformations. The findings on the aortic pulsations can provide additional insight into pulse wave analysis in arteries with irregular geometry and wall properties and serve as the stepping stone for future studies on physiologically relevant geometrical and material parameters.
Materials and Methods
Modeling parameters
Human aortas with idealized normal (ie, nonaneurysmal) and AAA geometry were considered for modeling the arterial pulse wave propagation under cyclic fluid flow (Fig. 1). The AAA idealized geometry was generated based on the Eurostar standard dimensions using realistic preoperation measurements on 3,413 patients with infrarenal abdominal aortic aneurysms, 59 which was then used to generate the nonaneurysmal geometry by removing the sac. In order to reduce computational burden, a quarter of the entire axis-symmetric 3D model was used (Fig. 2). The CEL explicit solver in Abaqus 6.11–1 (Simu-lia) was used to perform the fully coupled FSI simulations in order to capture the mutual effects of the fluid and wall pulsatile wave motions on each other. The CEL solver has previously been validated in providing accurate description of the wave dynamics.40,41 In CEL, the fluid dynamics is modeled with an Eulerian mesh domain, whereas the Lagrangian mesh domain is used to model the structural mechanics (see Appendix). According to the CEL solver requirement, the Eulerian domain was chosen to be large enough to ensure that it includes all Lagrangian elements at all times throughout the entire dynamic simulation. In order to match the ongoing counterpart experimental phantom studies, the fluid was modeled as water with material properties of density ρ = 1,000 kg/m2, reference sound speed c0 = 1,483 m/s, and dynamic viscosity μ = 1 mPa s. Similarly, the wall's material properties were defined to also mimic those from experimental phantom studies as were characterized under tensile and compressive mechanical testing within a strain range of ε = 0–10% at the rate of ε̇ = 1%/s, using an Instron 5848 microtester and an ARES-G2 rheometer (TA Instrument), respectively. Given the rubber-like behavior of the phantom wall, the material behavior was defined as hyperelastic with the tensile-compressive experimental data to fit best to a third-order Ogden model using the Abaqus material assessment tool (Fig. 3) as follows:

Schematics of idealized human aortic geometries: (A) straight, and (B) Eurostar AAA. Cross sections 1 and 7 indicate the boundary condition locations. On the AAA geometry, cross sections 3 and 5 define the sac zone, and cross sections 2 and 6 correspond to representative locations pre- and post-sac, respectively.

Quadrant 3D meshed geometries and the adjacent paths on the lower wall (Lagrangian nodes) and inside the lumen (Eulerian nodes) to be used for extraction of the wall displacement and fluid velocity outputs, respectively. (A, C) Straight and (B, D) Eurostar AAA geometries.

Mechanical testing of the phantom wall: (A) Experimental phantom stress-strain relationship along with the fits of different hyperelastic models. (B, C) DIC-obtained axial and lateral, respectively, strain maps that were used to obtain axial and lateral strains for Poisson's ratio calculation.

where λi is the deviatoric principal stretches, and α n and β n are the material constants. A digital image correlation (DIC) system (Correlated Solutions Inc.) was used to measure the surface axial and lateral strain fields under uniaxial tension in order to estimate the Poisson's ratio (Fig. 3). Each axial and lateral strain was calculated as the average of the strain measurements at nine different local points on the specimen surface. The accuracy of DIC measurements was verified under zero strain field, eg, rigid body motion. The Lagrangian boundary conditions (BCs) were applied by fixing all six degrees of freedom (DOFs) on both ends of the tube. On the Eulerian domain, a symmetrical BC was applied on the symmetry plane and a zero-pressure BC was applied on the tube outlet. Furthermore, fluid velocity with a sinusoidal profile with a magnitude of 3.63 m/s and a frequency of 5.4 Hz was also applied as the dynamic BC on the tube inlet to serve as the driving force for the fluid and the flow-induced solid motions. Similar to the material parameters, the flow parameters were chosen relevant to the pulsatile pump used in the ongoing experimental phantom studies.39,40 Furthermore, two additional simulations were performed on AAA aortas with the same geometrical parameters, but the wall modulus at the sac zone (between sections 3 and 5 in Fig. 1) was set to be 1.5 times lower (softer sac) and 3 times higher (stiffer sac).60–63 Assuming a similar hyperelastic regimen of the material behavior, the same experimental data obtained previously were mathematically scaled down/up to obtain pseudo-data for the softer/stiffer sacs, before similar third-order Ogden parametric model fit was performed on them.
Computational framework
A Precision T7600 workstation with Intel® Xeon® CPU (16 cores) at 3.10 GHz and 96 GB RAM was used to perform the computations. The mesh topology on the AAA quadrant axis-symmetric geometry contained a total of 233,520 elements, leading to a total computation time of 180 hours for a simulation time of 0.5 seconds (a time increment in the order of 1 × 10⁷ seconds). A frame rate of 1,000 fps was used to extract the output parameters.
Output analysis
The radial component of the wall displacement, Uy, and the axial component of the fluid velocity, Vz, were extracted along the nodal paths on the lower wall (Lagrangian) and neighboring fluid inside the lumen (Eulerian), respectively (Fig. 2). The spatial data were plotted against time to obtain the spatiotemporal maps, allowing an easy and full visualization of the wave propagation and qualitative understanding of the local pulse wave propagation. Furthermore, the spatiotemporal maps were also used to calculate the PWV of the waves as the slope of the linear fit to the wave peaks in order to provide quantitative measures of the wave dynamics, as previously described in detail.40–42
Results
Material characteristics
The tensile-compressive stress-strain experimental data for the strain range of ε = −10–10% are shown in Figure 3A. Also shown in the figure are the strain-stress approximations based on the Marlow, Mooney, and Rivlin third-order Ogden and neo-Hookean hyperelastic models, being fitted within an extrapolated strain range of ε = −20–20%, in order to make sure that we were on the safe side of capturing possible large strains. The results showed the third-order Ogden model yielding the best fit of the experimental phantom stress-strain data while also describing the high-strain stiffening relevant to fibrillar soft biological tissues such as the aortic wall. The material parameters obtained from fitting to the experimental data, as well as to the scaled-down and scaled-up data (ie, softer and stiffer materials), are listed in Table 1. Figure 3B and C shows the DIC-based axial and lateral strain fields, respectively, for a representative specimen. Linear fitting to the average biaxial strain data resulted in a Poisson's ratio of ν = 0.49 ± 0.06 (n = 6), which is consistent with the nearly incompressible properties of soft tissues. A wall Poisson's ratio of ν = 0.49 was used in the definition of the material properties.
Material constants of the third-order ogden model for the soft, normal, and stiff walls obtained by Abaqus material behavior data-fitting module.

Straight geometry with homogenous walls
The vertical component of wall displacement, Uy, and axial component of the fluid velocity, Vz, were plotted in the spatiotemporal maps in Figure 4. There are three main cycles of the inlet pulsatile flow. Given the initial transient dynamics of the wave formation, only the second and third cycles were considered for obtaining the quantified results of the wave propagation throughout this study. The maps illustrate a relatively homogenous propagation of the wall and fluid pulse waves, with multiple pulse waves seen within each cycle. Between the cycles, there are primarily multiple weak reflected waves until the main forward wave comes in from the following cycle. Also shown in the figure is the regional PWVs estimated on the forward and reflected waves, showing relatively close PWVs on the forward (ie, positive velocity) and the reflected waves (ie, negative velocity).
Spatiotemporal maps from the straight geometry aorta. (A) Vertical component of the wall displacement. (B) Axial component of the fluid velocity.
AAA geometry with the softer sac
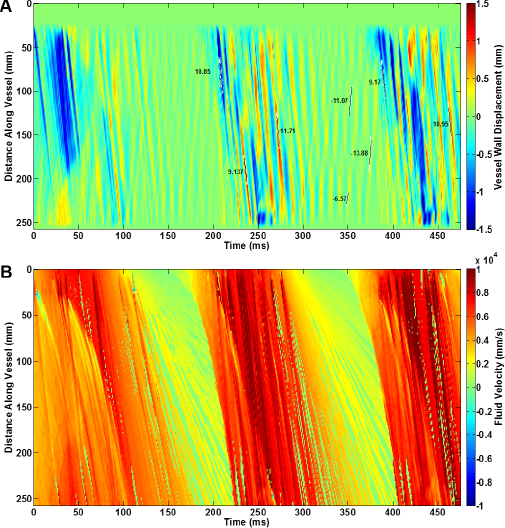
Figure 5 shows the spatiotemporal maps of the wall displacement vertical component, Uy, and fluid velocity axial component, Vz, obtained on the AAA geometry with the 1.5 times softer sac. Both the wall displacement and fluid velocity wave propagation indicate distinct patterns on the sac region, which is also marked on the maps based on an a priori known geometry. The wall displacement map (Fig. 5A) shows the sac to undergo higher displacement magnitudes with multiple forward and reflective waves that only travel within the sac zone boundaries. The homogenous propagation of the main forward wave is also seen to be disrupted at the sac region; however, it continues to propagate along the lumen after the sac. Also shown in Figure 5A is the regional PWV estimates on the forward and reflected waves, showing the pre-sac reflected waves to travel more slowly (eg, PWV = 5.8 ± 1.30 m/s) than the post-sac forward waves (eg, PWV = 9.39 ± 0.54 m/s). Short-traveling waves are also shown within the sac region traveling with the lowest velocities (eg, PWV = 4.55 ± 1.91 m/s).

Spatiotemporal maps from the aneurysm geometry aorta with the sac walls 1.5 times softer than the rest of the walls of the aorta. (A) Vertical component of the wall displacement. (B) Axial component of the fluid velocity.
AAA geometry with sac of the same stiffness
Figure 6 illustrates a frame of the fluid velocity magnitude vectors, V, on AAA geometry with the stiffness of the sac being the same as the stiffness of the rest of the aortic wall. The figure shows the propagation of a main forward-traveling fluid wave right after it has arrived at the sac. The entry of the fluid wave into the sac geometry is also accompanied by the creation of vortices, an observation that has also been reported by others. 51 Later on, a strongly attenuated chaotic motion was seen across the wall, corresponding to a steadier and less turbulent flow past the peak of the inlet flow profile, until the next main forward wave comes in from the following pulse. The spatiotemporal maps of the wall displacement vertical component, Uy, and fluid velocity axial component, Vz, are shown in Figure 7. The general observation is similar to that of in Figure 5 for the soft sac model. In particular, the sac zone is clearly identifiable on both the wall displacement and fluid velocity spatiotemporal maps. Also shown on the figure are the regional PWV estimates on the forward and reflected waves. The results show that the pre-sac reflected waves travel more slowly (eg, PWV = 7.07 m/s) than the post-sac forward waves (eg, PWV = 10.09 ± 1.43 m/s). Yet, the short-traveling waves within the sac region show the slowest propagation (eg, PWV = 2.84 m/s).

Vector representation of fluid velocity magnitude at the entrance of the sac at t = 205 ms. The formation of the vortex in the fluid corresponds to the formation of the reflected wave in the wall.

Spatiotemporal maps from the aneurysm geometry aorta with the sac walls possessing the same stiffness as the rest of the walls of the aorta. (A) Vertical component of the wall displacement. (B) Axial component of the fluid velocity.
AAA geometry with the stiffer sac
Figure 8 shows the spatiotemporal maps of the wall displacement vertical component, Uy, and the fluid velocity axial component, Vz, obtained on the AAA geometry with the 3 times stiffer sac. Compared to the two previous AAA models with softer sacs (Figs. 5 and 7), the results in Figure 8 show a lower displacement magnitude at the sac; however, the sac displacement is still higher than that of the rest of the wall. Compared to the previous softer sac models, the sac zone is not as distinguishable based on the wall displacement wave propagation, but the fluid velocity wave propagation still show the sac zone markedly. The pre-sac reflected and post-sac forward waves travel with PWVs of 4.52 ± 0.55 and 10.87 ± 0.69 m/s, respectively.

Spatiotemporal maps from the aneurysm geometry aorta with the sac walls 3 times stiffer than the rest of the walls of the aorta. (A) Vertical component of the wall displacement. (B) Axial component of the fluid velocity.
Wall displacement and fluid velocity temporal profiles
In order to obtain better insight into the fluid-solid interactions, Figure 9 illustrates the fluid velocity and wall displacement profiles at five different cross sections on the straight and AAA geometry aortas (see Fig. 1 for the cross-section locations). The results show that for the most part, the fluid velocity pulse is ahead of the wall displacement pulse for ~10–20 ms. As it goes further along the lumen, ie, increasing section number, the flow and displacement profiles get in more synchrony, which could possibly be explained by the fact that the flow—and thus the fluid-solid interaction—gets more developed as it propagates further along the vessel.
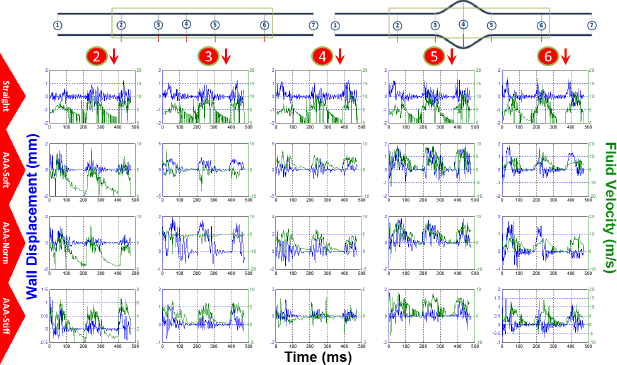
Wall displacement (blue) and fluid velocity (green) for cross sections 2–6 on the straight aorta (first row), AAA aorta with 1.5 time softer sac (second row), for AAA with same stiffness sac (third row), and for AAA with 3 times stiffer sac (fourth row).
Discussion
FSI simulations can serve as a powerful and effective tool to study the arterial pulsatile motions. However, the results from the numerical methods should be interpreted within the limitations of such methods and under the full understanding of the underlying assumptions. In the present study, three full cycles of a pulsatile wave were simulated. However, in order to minimize the transient dynamics in the wave development and propagation, quantitative analyses such as PWV estimates were performed on the second and third pulse cycles. Most studies on FSI modeling of aneurysmal blood vessels have focused on characterizing parameters such as wall shear stress and pressure in order to find the maximum values and the locations at which they take place.50,51,54–56 The present study aimed at characterizing the pulse wave propagation on aortas with various material and geometrical properties (Figs. 4, 5, 7, and 8) and identifying markers on the propagation patterns that could be used in experimental phantoms and in vivo PWI studies in which the wall's local irregularities are involved. The wall displacement results indicate the presence of the sac in the aneurysmal geometries (Figs. 5A, 7A and 8A) versus nonaneurysmal geometry (Fig. 4A). Furthermore, within the aneurysmal geometries, multiple forward and reflected waves for each inlet flow cycle are observed, which explains the complexity of implementing the PWI method on diseased aortas, as suggested by others. Part of such phenomena can be explained by the presence of the sac that generates disruption in the wave propagation and causes additional reflections within the sac boundaries. For the straight geometry, the theoretical frequencies of natural vibration modes are fn = 2.84, 5.68, 8.52, …, kHz, which fall well beyond the excitation frequency of f = 5.4 Hz by the inlet flow; and it is expected that the natural frequencies of the aneurysmal geometries would not deviate much from this range. Therefore, the multiple waves on the wall motions observed here were unlikely to be part of the natural modes of vibrations. However, it has been shown that not incorporating the damping effects into the structural material properties—which otherwise exist in viscoelastic behavior—could cause oscillations in the pressure profile, 49 which can also cause wall oscillations and can partly explain the observations seen here. Based on the straight tube geometry and flow conditions, the flow is expected to be well in the turbulent regime (and beyond the physiological regime), and the presence of the geometrical and material irregularities in the AAA model could only add to the chaotic nature of the fluid (and solid) motions, as seen in the spatiotemporal maps in Figures 5, 7, and 8. Overall, it was found that both the wall displacement and fluid velocity spatiotemporal maps can be used to identify the existence of the sac. However, the wall displacement results were found to be more sensitive to sac stiffness variations. In all AAA-geometry aortas, displacement magnitudes on the sac were found to be higher than the rest of the wall—even for the model with a stiffer sac—perhaps due to a higher pressure gradient inside the sac. Ongoing studies seek to characterize the fluid pressure and the pressure wave propagation as well, in order to gain further insights into how the pressure wave could be related to velocity and displacement waves. Using an average PWV on the forward waves in the straight model to be 10.30 m/s, the dimensions given in Figure 1, and the material properties defined, a Young's modulus of E = 806.18 kPa was obtained using the Moens-Korteweg equation. Although the material was described here as a third-order Ogden model based on the fit to the available experimental data, the low strain range in the same strain-stress curves, ie, ε = 0–2%, yields an average Young's modulus of E = 676.92 ± 36.81 kPa, indicating a 19.09% overestimation of the modulus by the simulation results here. Similar differences between simulation and experimental results have previously been found and explained in detail in terms of the several assumptions underlying each study.39,40 It should be again noted that the present study was established based on the idealized aneurysm geometry with a simple one-layer aortic wall. Future studies are needed in order to examine the wave dynamics on patient-specific aneurysmal geometries with various diameters of the sac and bifurcations, and with aortic wall composed of intima/media/ adventitia layers and thrombus, such as those developed by Lin et al. 64 The accuracy of the results may also be improved by using more physiologically relevant modeling parameters such as material properties and input/boundary conditions. Other studies have shown that modeling the arterial wall as porous, 47 viscoelastic, nonlinear, inhomogeneous, 52 and anisotropic 50 and the fluid as viscous, 55 incompressible, and non-Newtonian 54 affects the FSI dynamics and results in different outputs on the fluid such as shear stress and pressure. More interestingly, in the present study, it was shown that incorporating the viscosity effects into the structural material properties, instead of modeling the structure as purely elastic, helps reduce oscillations in the pulsatile pressure profile 49 and, therefore, in the wall displacement profile. As far as the initial and boundary conditions that were set in this study are concerned, they serve the purpose of simulating the laboratory experimentation of the PWI method, in which a peristaltic device pumps water into an aortic segment that is fully secured on both ends. The full constraint of the tube endings causes artificial stiffening, which affects the wave reflection and dynamics. Improving the initial, boundary, and flow conditions to those relevant to physiological parameters is expected to make the wave dynamics and reflected/forward wave interactions closer to in vivo conditions. Studies are needed to examine such physiologically relevant parameters before any attempts toward clinical implications of simulations results are made.
Conclusion
In this study, dynamic, FSI, finite element simulations have been shown to be promising in modeling the pulsatile flow through arterial models and obtaining the wall displacement and fluid velocity pulse wave propagation. FSI simulations were performed on straight and aneurysmal geometry aortas with softer, the same stiffness, and stiffer sacs, respectively, aiming at examining the effects of geometric and material changes on the pulse wave propagation and velocities. Characterizing such effects can be best performed through simulation studies given that experimental and in vivo specimens with precisely controlled geometry and stiffness might prove costly and/or impossible. The results showed that the presence of the aneurysm sac can be detected through both the wall displacement and fluid velocity propagation profiles observed on the spatiotemporal maps. On average, the within-sac forward waves, pre-sac reflected waves, and post-sac forward waves exhibited orderly, increasing PWVs, all of which also increased with the sac stiffness. The present study is the first report on using numerical models to investigate FSI dynamics of arterial pulsations in aneurysmal aortas. The qualitative and quantitative markers on the wave propagation provided insights that can be used to better guide the experimental and in vivo pulse wave analysis studies.
Author Contributions
Conceived and designed the experiments: DS. Analyzed the data: DS, HL, KL. Wrote the first draft of the manuscript: DS. Contributed to the writing of the manuscript: DS, KL, HL. Agree with manuscript results and conclusions: DS. Jointly developed the structure and arguments for the paper: DS. Made critical revisions and approved final version: DS. All authors reviewed and approved of the final manuscript.
Footnotes
Acknowledgments
DS would like to thank Dr. Elisa Konofagou and the members of the Ultrasound and Elasticity Imaging Lab (UEIL), Department of Biomedical Engineering, Columbia University, for assisting with the modeling setup and the helpful discussions.